
Reports
Reports
Australia, New Zealand and India Building Information Modeling (BIM) Market: Snapshot
The vast rise in infrastructure development activities across India, Australia, and New Zealand in the past few years has been complemented with an increased focus on the usage of digital tools for the proper estimation of cost and time required for project completion. As the overall focus on cost and time values continues to rise in the highly competitive construction industry, traditional 3D visualization tools such as AutoCAD, 3DMax, and CATIA are being increasingly replaced by building information modelling (BIM) solutions.
Building information modelling (BIM) is a 3D visual presentation of a technical drawing that includes the plan, elevation, and section of a building. It is a kind of digital fabrication system in which the actual model of the building is digitally constructed with accurate values. Apart from 3D visualization, BIM also covers 4D and 5D, which comprise the time and cost plans of a construction project.
According to Transparency Market Research, the Australia, New Zealand, and India building information modelling (BIM) market was worth US$214.0 mn in 2015 and is expected to reach US$1,335.3 mn by 2024, expanding at a remarkable CAGR of 22.3% from 2016 to 2024.
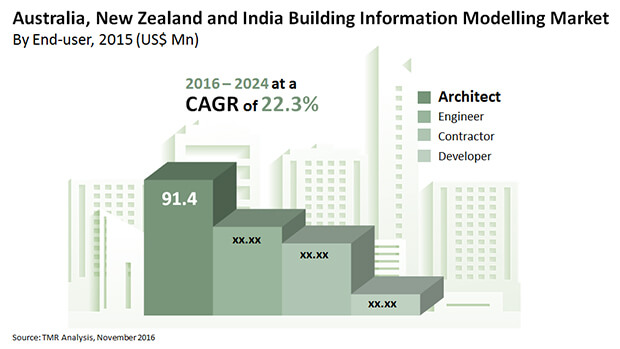
Architects Continue to Remain Dominant Consumers of BIM Solutions
Architects, contractors and engineers are some of the prominent end users of BIM solution in India, New Zealand, and Australia. Across all three, the segment of architects is the key consumer of these solutions, accounting for over 40% of these markets in 2015. Over the forecast period as well, the segment is projected to continue to have a strong influence on the overall development of the BIM market and exhibit growth at a remarkable pace across these countries.
However, the usage of BIM solutions across the contractor segment is expected to exhibit growth at a faster pace than the architects segment across these countries over the forecast period. In India, the segment is expected to expand at a 26.6% CAGR, in Australia it will exhibit a 25% CAGR and in New Zealand, it will exhibit a slightly lesser 21% CAGR as compared to the architect sector.
Thanks to Vast Rise in Infrastructure Development Activities, India to Account for Bulk of Sales
In terms of revenue, India is presently the leading market building information modeling solutions, accounting for nearly 43% share in the overall revenue of the Australia, New Zealand, and India building information modelling (BIM) market in 2015. Moreover, the country is expected to remain the leading consumer of building information modeling solutions throughout the forecast period. India’s building information modeling market is primarily driven by the rapid rate of development of the healthcare infrastructure of the country.
The building information modeling market in Australia is also expected to exhibit adequate growth over the forecast period. Rising use in the construction of bridges, roads and highways is key to the high demand for building information modeling solutions in the country. The Australia building information modelling market will also be driven due to high demand across the rail, transit, and aviation sectors in the next few years.
The encouraging pace of infrastructure development activities across New Zealand is also expected to lead to favorable growth opportunities for the building information modeling market. Over the period between 2016 and 2024, the New Zealand building information modeling market is expected to exhibit a 20.3% CAGR.
Some of the most remarkable companies operating in the Australia, New Zealand, and India building information modelling market are Dassault Systèmes SA, GRAITEC, Nemetschek AG, AECOM Technology Corporation, Pentagon Solutions Ltd., Synchro Software Ltd., Autodesk Inc., Beck Technology Ltd., Bentley Systems, and Tekla Corporation.
1. Preface
1.1. Market Definition and Scope
1.2. Market Segmentation
1.3. Key Research Objectives
1.4. Research Highlights
2. Assumptions and Research Methodology
3. Executive Summary : Building Information Modeling (BIM) Market
4. Market Overview
4.1. Introduction
4.1.1. Product Definition
4.1.2. Industry Evolution / Developments
4.2. Key Market Indicators
4.3. Market Dynamics
4.3.1. Drivers
4.3.2. Restraints
4.3.3. Opportunity
4.4. Porter’s Five Force Analysis
4.5. Ecosystem Analysis
4.6. Market Outlook
5. Australia Building Information Modeling (BIM) Market Analysis and Forecasts
5.1. Introduction & Definition
5.2. Key Findings / Developments
5.3. Key Market Trends
5.4. Market Size (US$ Mn) Forecast By Solution, 2014-2024 (US$ Mn)
5.4.1. Software
5.4.1.1. On-premise
5.4.1.2. Cloud-based
5.4.2. Professional & Consultancy Service
5.5. Market Size (US$ Mn) Forecast By End-use Industry
5.5.1. Water and Waste Water
5.5.2. Bridges, Roads and Highways
5.5.3. Rail, Transit, and Aviation
5.5.4. Energy Generation Facilities
5.5.5. Houses and Apartments
5.5.6. Factories and Warehouses
5.5.7. Educational Institutions and Commercial Spaces
5.5.8. Government Buildings
5.5.9. Healthcare Infrastructures
5.5.10. Dams and Others
5.6. Market Size (US$ Mn) Forecast By End-user
5.6.1. Engineers
5.6.2. Architects
5.6.3. Contractors
5.6.4. Developers
5.7. Market Attractiveness Analysis
5.7.1. By Solution
5.7.2. By End-use Industry
5.7.3. By End-user
6. New Zealand Building Information Modeling (BIM) Market Analysis and Forecasts
6.1. Introduction & Definition
6.2. Key Findings / Developments
6.3. Key Market Trends
6.4. Market Size (US$ Mn) Forecast By Solution, 2014-2024 (US$ Mn)
6.4.1. Software
6.4.1.1. On-premise
6.4.1.2. Cloud-based
6.4.2. Professional & Consultancy Service
6.5. Market Size (US$ Mn) Forecast By End-use Industry
6.5.1. Water and Waste Water
6.5.2. Bridges, Roads and Highways
6.5.3. Rail, Transit, and Aviation
6.5.4. Energy Generation Facilities
6.5.5. Houses and Apartments
6.5.6. Factories and Warehouses
6.5.7. Educational Institutions and Commercial Spaces
6.5.8. Government Buildings
6.5.9. Healthcare Infrastructures
6.5.10. Dams and Others
6.6. Market Size (US$ Mn) Forecast By End-user
6.6.1. Engineers
6.6.2. Architects
6.6.3. Contractors
6.6.4. Developers
6.7. Market Attractiveness Analysis
6.7.1. By Solution
6.7.2. By End-use Industry
6.7.3. By End-user
7. India Building Information Modeling (BIM) Market Analysis and Forecasts
7.1. Introduction & Definition
7.2. Key Findings / Developments
7.3. Key Market Trends
7.4. Market Size (US$ Mn) Forecast By Solution, 2014-2024 (US$ Mn)
7.4.1. Software
7.4.1.1. On-premise
7.4.1.2. Cloud-based
7.4.2. Professional & Consultancy Service
7.5. Market Size (US$ Mn) Forecast By End-use Industry
7.5.1. Water and Waste Water
7.5.2. Bridges, Roads and Highways
7.5.3. Rail, Transit, and Aviation
7.5.4. Energy Generation Facilities
7.5.5. Houses and Apartments
7.5.6. Factories and Warehouses
7.5.7. Educational Institutions and Commercial Spaces
7.5.8. Government Buildings
7.5.9. Healthcare Infrastructures
7.5.10. Dams and Others
7.6. Market Size (US$ Mn) Forecast By End-user
7.6.1. Engineers
7.6.2. Architects
7.6.3. Contractors
7.6.4. Developers
7.7. Market Attractiveness Analysis
7.7.1. By Solution
7.7.2. By End-use Industry
7.7.3. By End-user
8. Competition Landscape
8.1. Market Player – Competition Matrix (By Tier and Size of companies)
8.2. Market Share Analysis By Company (2015)
8.3. Company Profiles (Details – Overview, Financials, Recent Developments, Strategy)
8.3.1. Autodesk Inc.
8.3.1.1. Company Details (HQ, Foundation Year, Employee Strength)
8.3.1.2. Market Presence, By Segment and Geography
8.3.1.3. Revenue and Operating Profits
8.3.1.4. Strategy and Historical Roadmap
8.3.1.5. SWOT Analysis
8.3.2. Beck Technology Ltd.
8.3.2.1. Company Details (HQ, Foundation Year, Employee Strength)
8.3.2.2. Market Presence, By Segment and Geography
8.3.2.3. Revenue and Operating Profits
8.3.2.4. Strategy and Historical Roadmap
8.3.2.5. SWOT Analysis
8.3.3. Dassault Systemes SA
8.3.3.1. Company Details (HQ, Foundation Year, Employee Strength)
8.3.3.2. Market Presence, By Segment and Geography
8.3.3.3. Revenue and Operating Profits
8.3.3.4. Strategy and Historical Roadmap
8.3.3.5. SWOT Analysis
8.3.4. Synchro Software Ltd.
8.3.4.1. Company Details (HQ, Foundation Year, Employee Strength)
8.3.4.2. Market Presence, By Segment and Geography
8.3.4.3. Revenue and Operating Profits
8.3.4.4. Strategy and Historical Roadmap
8.3.4.5. SWOT Analysis
8.3.5. Tekla Corporation
8.3.5.1. Company Details (HQ, Foundation Year, Employee Strength)
8.3.5.2. Market Presence, By Segment and Geography
8.3.5.3. Revenue and Operating Profits
8.3.5.4. Strategy and Historical Roadmap
8.3.5.5. SWOT Analysis
8.3.6. Bentley Systems, Inc.
8.3.6.1. Company Details (HQ, Foundation Year, Employee Strength)
8.3.6.2. Market Presence, By Segment and Geography
8.3.6.3. Revenue and Operating Profits
8.3.6.4. Strategy and Historical Roadmap
8.3.6.5. SWOT Analysis
8.3.7. Pentagon Solutions Ltd.
8.3.7.1. Company Details (HQ, Foundation Year, Employee Strength)
8.3.7.2. Market Presence, By Segment and Geography
8.3.7.3. Revenue and Operating Profits
8.3.7.4. Strategy and Historical Roadmap
8.3.7.5. SWOT Analysis
8.3.8. AECOM
8.3.8.1. Company Details (HQ, Foundation Year, Employee Strength)
8.3.8.2. Market Presence, By Segment and Geography
8.3.8.3. Revenue and Operating Profits
8.3.8.4. Strategy and Historical Roadmap
8.3.8.5. SWOT Analysis
8.3.9. Nemetschek AG
8.3.9.1. Company Details (HQ, Foundation Year, Employee Strength)
8.3.9.2. Market Presence, By Segment and Geography
8.3.9.3. Revenue and Operating Profits
8.3.9.4. Strategy and Historical Roadmap
8.3.9.5. SWOT Analysis
8.3.10. GRAITEC
8.3.10.1. Company Details (HQ, Foundation Year, Employee Strength)
8.3.10.2. Market Presence, By Segment and Geography
8.3.10.3. Revenue and Operating Profits
8.3.10.4. Strategy and Historical Roadmap
8.3.10.5. SWOT Analysis
9. Key Takeaways
List of Tables
Table 01: Australia BIM Market Forecast, By Solution, 2014 – 2024 (US$ Mn)
Table 02: Australia BIM Market Forecast, By Software, 2014 – 2024 (US$ Mn)
Table 03: Australia BIM Market Forecast, By End-use Industry, 2014 – 2024 (US$ Mn)
Table 04: Australia BIM Market Forecast, By End-user, 2014 – 2024 (US$ Mn)
Table 05: New Zealand BIM Market Forecast, By Solution, 2014 – 2024 (US$ Mn)
Table 06: New Zealand BIM Market Forecast, By Software, 2014 – 2024 (US$ Mn)
Table 07: New Zealand BIM Market Forecast, By End-use Industry, 2014 – 2024 (US$ Mn)
Table 08: New Zealand BIM Market Forecast, By End-user, 2014 – 2024 (US$ Mn)
Table 09: India BIM Market Forecast, By Solution, 2014 – 2024 (US$ Mn)
Table 10: India BIM Market Forecast, By Software, 2014 – 2024 (US$ Mn)
Table 11: India BIM Market Forecast, By End-use Industry, 2014 – 2024 (US$ Mn)
List of Figures
Figure 01: Vale Chain Analysis
Figure 02: Market Value Share (Revenue) By Solution (2016)
Figure 03: Market Value Share (Revenue) By End-use Industry (2016)
Figure 04: Market Value Share (Revenue) By End-user (2016)
Figure 05: Market Value (Revenue) Share By Geography (2016)
Figure 06: Australia BIM Market Revenue (US$ Mn) and Y-o-Y Forecast, 2014 – 2024
Figure 07: Australia BIM Market Value Share Analysis, By Solution, 2016 and 2024
Figure 08: Australia BIM Market Value Share Analysis, By End-use Industry, 2016 and 2024
Figure 09: Australia BIM Market Value Share Analysis, By End-user, 2016 and 2024
Figure 10: BIM Market Attractiveness Analysis, By Solution
Figure 11: BIM Market Attractiveness Analysis, By End-use Industry
Figure 12: BIM Market Attractiveness Analysis, By End-user
Figure 13: New Zealand BIM Market Revenue (US$ Mn) and Y-o-Y Forecast, 2014 – 2024
Figure 14: New Zealand BIM Market Value Share Analysis, By Solution, 2016 and 2024
Figure 15: New Zealand BIM Market Value Share Analysis, By End-use Industry, 2016 and 2024
Figure 16: New Zealand BIM Market Value Share Analysis, By End-user, 2016 and 2024
Figure 17: BIM Market Attractiveness Analysis, By Solution
Figure 18: BIM Market Attractiveness Analysis, By End-use Industry
Figure 19: BIM Market Attractiveness Analysis, By End-user
Figure 20: India BIM Market Revenue (US$ Mn) and Y-o-Y Forecast, 2014 – 2024
Figure 21: India BIM Market Value Share Analysis, By Solution, 2016 and 2024
Figure 22: India BIM Market Value Share Analysis, By End-use Industry, 2016 and 2024
Figure 23: India BIM Market Value Share Analysis, By End-user, 2016 and 2024
Figure 24: BIM Market Attractiveness Analysis, By Solution
Figure 25: BIM Market Attractiveness Analysis, By End-use Industry
Figure 26: BIM Market Attractiveness Analysis, By End-user
Figure 27: Australia, New Zealand and India BIM Market Share Analysis (2015)
Copyright © Transparency Market Research, Inc. All Rights reserved
Trust Online

Building Information Modelling Market