
Reports
Reports
The market for controlled release fertilizers in Asia Pacific is witnessing an immense rise, thanks to the growing need for food. The rapidly increasing population in this region has fueled two important needs of humans, food and shelter, which has resulted in less arable land but more people to feed.
Farmers and agriculturists are using advanced products and specialty fertilizers such as controlled release fertilizers to heighten crop yields from the limited farming land available across Asia Pacific. They are also focusing on modernizing their farming methods to boost harvest with the help of these fertilizers in order to fulfill the ever-rising demand for food.
The market opportunity in controlled release fertilizers in Asia Pacific, which stood at US$1.1 bn in 2014, is projected to rise at a CAGR of 7.20% from 2015 to 2023 and reach US$2.1 bn by the end of 2023.
China and India Lead Consumption of Controlled Release Fertilizers in Asia Pacific
The Asia Pacific controlled release fertilizers market is led by China and India. In 2014, China accounted for the majority share of the overall consumption of controlled release fertilizers and was closely followed by India and Japan. Together, these countries held a share of around 87% of its overall demand in this region that year.
Over the coming years, the demand for controlled release fertilizers is expected to increase at a faster rate than conventional fertilizers in these countries. However, the lack of awareness regarding the benefits offered by these fertilizers and their high cost will limit their application in other regions, which is why they are likely to witness a moderate growth in their adoption in the agriculture and the horticulture sectors.
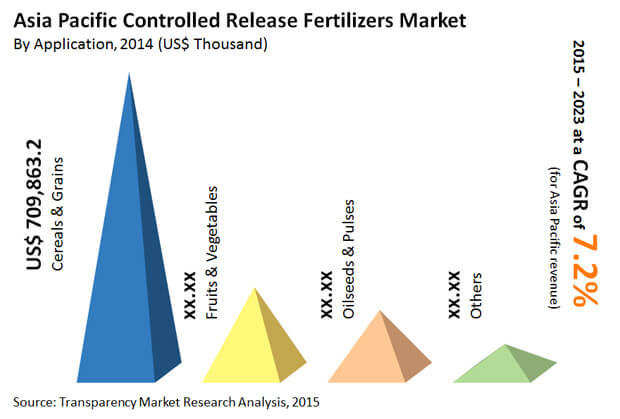
Controlled Release Fertilizers Find Maximum Application in Cereals and Pulses
Controlled release fertilizers are heavily utilized in the cultivation of oilseeds and pulses, cereals and grains, and fruits and vegetables. These fertilizers are also used to grow turf and ornamental plants. Among these, farmers mostly use these fertilizers in cereals and grain crops.
As cereals and grain are one of the most important parts of traditional diets in Asia Pacific – they hold almost two-third share of the overall calorie intake of an average Asian person - local farmers and agriculturists are being encouraged to uptake sustainable agriculture practices in order to increase their production with the efficient usage of specialty fertilizers such as controlled release fertilizers.
In 2014, the revenue generated by the application of controlled release fertilizers in cereals and grain attained a value of US$0.7 mn. Rising at a CAGR of 7.40% from 2015 to 2023 it is expected to reach US$1.3 mn by the end of the forecast period.
The Asia Pacific market for controlled release fertilizers demonstrates a moderately consolidated structure. ATS Group, Eurochem Agro Gmbh, Shikefeng Chemical Industry Co. Ltd., Kingenta Ecological Engineering Group Co. Ltd., Nufarm Ltd., Central Glass Co. Ltd., Haifa Chemicals Ltd., Compo Gmbh & Co. KG, Hif Tech Marketing Sdn. Bhd., Greenfeed Agro Sdn Bhd, Hanfeng Evergreen Inc., and AgroBridge are the major manufacturers of controlled release fertilizers in Asia Pacific.
Controlled Release Fertilizers Market to Witness Significant Growth Owing to Rising Demand from Increasing Demand from Agricultural Sector
The rapidly increasing population, coupled with the increasing need to feed them is likely to aid in expansion of the global controlled release fertilizers market. Expanding food and yields request alongside decreasing per capita portion of rich land across the globe will raise the interest for different controlled release fertilizers in impending years. The high populace development combined with a quick speed of urbanization has altogether diminished the portion of horticultural or arable land per individual. There is a steady need to support the rural profitability across the globe and this will bit by bit move center towards great quality fertilizers to improve the dirt properties and increment the land efficiency. This positive pattern is expected to gainfully affect the worldwide controlled release fertilizers market.
Low item mindfulness and plenitude of substitutes, for example, urea will limit the development of item market over figure time span. The controlled release fertilizers are exorbitant because of unique polymer coatings on the regular compost items which may likewise frustrate the market development rate. The items are not promoted in monetarily creating and immature nations because of the significant expenses. Additionally, ranchers of these locale don't know about the advantages of the items attributable to accessibility of ease regular fertilizers.
Notwithstanding, the absence of mindfulness in regards to the advantages offered by these fertilizers and their significant expense will restrict their application in different districts, which is the reason they are probably going to observe a moderate development in their appropriation in the agribusiness and the cultivation areas.
Controlled release fertilizers are utilized for continuous release of supplements into the dirt. In these items the fertilizers granules are typified in coatings of sulfur or polymers. Decreasing accessibility of arable land and steady expansion in food request will raise the interest of the item. With expanding interest for better land efficiency, numerous ranchers and agriculturists are slowly moving their concentration towards these eco-accommodating fertilizers.
Chapter 1 Preface
1.1 Report Description
1.2 Market Segmentation
1.3 Research Scope & Assumptions
1.4 Research Methodology
Chapter 2 Executive Summary
2.1 Controlled Release Fertilizers Market, 2014 - 2023, (Tons) (US$ Thousand)
2.2 Controlled Release Fertilizers: Market Snapshot, 2014 & 2023
Chapter 3 Controlled Release Fertilizers – Industry Analysis
3.1 Introduction
3.2 Value Chain Analysis
3.3 Market Drivers
3.3.1 Increasing Demand for Better Yield Crops
3.3.2 Shift Toward Sustainable Agriculture
3.4 Restraints
3.4.1 Lack of Awareness and High Cost Compared to Conventional Chemical Fertilizers
3.5 Opportunity
3.5.1 Prospective Applications in Lawn & Garden Industry
3.6 Porter’s Five Forces Analysis
3.6.1 Bargaining Power of Suppliers
3.6.2 Bargaining Power of Buyers
3.6.3 Threat of New Entrants
3.6.4 Threat of Substitutes
3.6.5 Degree of Competition
3.7 Controlled Release Fertilizers Market: Market Attractiveness, by Application
3.8 Controlled Release Fertilizers Market: Market Attractiveness, by Country
3.9 Company Market Share Analysis (% Share, 2014)
Chapter 4 Price Trend Analysis
4.1 Asia Pacific Controlled Release Fertilizers Market Price Trend Analysis, 2014–2023 (US$/Ton)
Chapter 5 Controlled Release Fertilizers Market – Product Analysis
5.1 Asia Pacific Controlled Release Fertilizers Market: Product Analysis
5.2. Controlled Release Fertilizers Market for Polymer Sulfur Coated Urea/Sulfur Coated Urea, 2014 – 2023 (Tons) (US$ Thousand)
5.2. Controlled Release Fertilizers Market for Polymer Coated Urea, 2014 – 2023 (Tons) (US$ Thousand)
5.2. Controlled Release Fertilizers Market for Polymer Coated NPK Fertilizer, 2014 – 2023 (Tons) (US$ Thousand)
5.2. Controlled Release Fertilizers Market for Others, 2014 – 2023 (Tons) (US$ Thousand)
Chapter 6 Controlled Release Fertilizers Market – Application Analysis
6.1 Asia Pacific Controlled Release Fertilizers Market: Application Analysis
6.2 Controlled Release Fertilizers Market for Cereals & Grains, 2014 – 2023 (Tons) (US$ Thousand)
6.2 Controlled Release Fertilizers Market for Oilseeds & Pulses, 2014 – 2023 (Tons) (US$ Thousand)
6.2 Controlled Release Fertilizers Market for Fruits & Vegetables, 2014 – 2023 (Tons) (US$ Thousand)
6.2 Controlled Release Fertilizers Market for Others, 2014 – 2023 (Tons) (US$ Thousand)
Chapter 7 Asia Pacific Controlled Release Fertilizers - Regional Analysis
7 Asia Pacific Controlled Release Fertilizers Market Volume Share by Region
7.1 China
7.1 China Controlled Release Fertilizers Market Volume by Product, 2014 – 2023 (Tons)
7.1 China Controlled Release Fertilizers Revenue by Product, 2014 – 2023 (US$ Thousand)
7.1 China Controlled Release Fertilizers Market Volume by Application, 2014 – 2023 (Tons)
7.1 China Controlled Release Fertilizers Market Revenue, by Application, 2014 – 2023 (US$ Thousand)
7.2 India
7.2 India Controlled Release Fertilizers Market Volume by Product, 2014 – 2023 (Tons)
7.2 India Controlled Release Fertilizers Revenue by Product, 2014 – 2023 (US$ Thousand)
7.2 India Controlled Release Fertilizers Market Volume by Application, 2014 – 2023 (Tons)
7.2 India Controlled Release Fertilizers Market Revenue, by Application, 2014 – 2023 (US$ Thousand)
7.3 Japan
7.3 Japan Controlled Release Fertilizers Market Volume by Product, 2014 – 2023 (Tons)
7.3 Japan Controlled Release Fertilizers Revenue by Product, 2014 – 2023 (US$ Thousand)
7.3 Japan Controlled Release Fertilizers Market Volume by Application, 2014 – 2023 (Tons)
7.3 Japan Controlled Release Fertilizers Market Revenue, by Application, 2014 – 2023 (US$ Thousand)
7.4 Australia
7.4 Australia Controlled Release Fertilizers Market Volume by Product, 2014 – 2023 (Tons)
7.4 Australia Controlled Release Fertilizers Revenue by Product, 2014 – 2023 (US$ Thousand)
7.4 Australia Controlled Release Fertilizers Market Volume by Application, 2014 – 2023 (Tons)
7.4 Australia Controlled Release Fertilizers Market Revenue, by Application, 2014 – 2023 (US$ Thousand)
7.5 Korea
7.5 Korea Controlled Release Fertilizers Market Volume by Product, 2014 – 2023 (Tons)
7.5 Korea Controlled Release Fertilizers Revenue by Product, 2014 – 2023 (US$ Thousand)
7.5 Korea Controlled Release Fertilizers Market Volume by Application, 2014 – 2023 (Tons)
7.5 Korea Controlled Release Fertilizers Market Revenue, by Application, 2014 – 2023 (US$ Thousand)
7.6 Indonesia
7.6 Indonesia Controlled Release Fertilizers Market Volume by Product, 2014 – 2023 (Tons)
7.6 Indonesia Controlled Release Fertilizers Revenue by Product, 2014 – 2023 (US$ Thousand)
7.6 Indonesia Controlled Release Fertilizers Market Volume by Application, 2014 – 2023 (Tons)
7.6 Indonesia Controlled Release Fertilizers Market Revenue, by Application, 2014 – 2023 (US$ Thousand)
7.7 Pakistan
7.7 Pakistan Controlled Release Fertilizers Market Volume by Product, 2014 – 2023 (Tons)
7.7 Pakistan Controlled Release Fertilizers Revenue by Product, 2014 – 2023 (US$ Thousand)
7.7 Pakistan Controlled Release Fertilizers Market Volume by Application, 2014 – 2023 (Tons)
7.7 Pakistan Controlled Release Fertilizers Market Revenue, by Application, 2014 – 2023 (US$ Thousand)
7.8 Malaysia
7.8 Malaysia Controlled Release Fertilizers Market Volume by Product, 2014 – 2023 (Tons)
7.8 Malaysia Controlled Release Fertilizers Revenue by Product, 2014 – 2023 (US$ Thousand)
7.8 Malaysia Controlled Release Fertilizers Market Volume by Application, 2014 – 2023 (Tons)
7.8 Malaysia Controlled Release Fertilizers Market Revenue, by Application, 2014 – 2023 (US$ Thousand)
7.9 Thailand
7.9 Thailand Controlled Release Fertilizers Market Volume by Product, 2014 – 2023 (Tons)
7.9 Thailand Controlled Release Fertilizers Revenue by Product, 2014 – 2023 (US$ Thousand)
7.9 Thailand Controlled Release Fertilizers Market Volume by Application, 2014 – 2023 (Tons)
7.9 Thailand Controlled Release Fertilizers Market Revenue, by Application, 2014 – 2023 (US$ Thousand)
7.10 Philippines
7.10 Philippines Controlled Release Fertilizers Market Volume by Product, 2014 – 2023 (Tons)
7.10 Philippines Controlled Release Fertilizers Revenue by Product, 2014 – 2023 (US$ Thousand)
7.10 Philippines Controlled Release Fertilizers Market Volume by Application, 2014 – 2023 (Tons)
7.10 Philippines Controlled Release Fertilizers Market Revenue, by Application, 2014 – 2023 (US$ Thousand)
7.11 Vietnam
7.11 Vietnam Controlled Release Fertilizers Market Volume by Product, 2014 – 2023 (Tons)
7.11 Vietnam Controlled Release Fertilizers Revenue by Product, 2014 – 2023 (US$ Thousand)
7.11 Vietnam Controlled Release Fertilizers Market Volume by Application, 2014 – 2023 (Tons)
7.11 Vietnam Controlled Release Fertilizers Market Revenue, by Application, 2014 – 2023 (US$ Thousand)
7.12 Myanmar
7.12 Myanmar Controlled Release Fertilizers Market Volume by Product, 2014 – 2023 (Tons)
7.12 Myanmar Controlled Release Fertilizers Revenue by Product, 2014 – 2023 (US$ Thousand)
7.12 Myanmar Controlled Release Fertilizers Market Volume by Application, 2014 – 2023 (Tons)
7.12 Myanmar Controlled Release Fertilizers Market Revenue, by Application, 2014 – 2023 (US$ Thousand)
7.13 Cambodia
7.13 Cambodia Controlled Release Fertilizers Market Volume by Product, 2014 – 2023 (Tons)
7.13 Cambodia Controlled Release Fertilizers Revenue by Product, 2014 – 2023 (US$ Thousand)
7.13 Cambodia Controlled Release Fertilizers Market Volume by Application, 2014 – 2023 (Tons)
7.13 Cambodia Controlled Release Fertilizers Market Revenue, by Application, 2014 – 2023 (US$ Thousand)
7.14 Rest of Asia Pacific
7.14 Rest of Asia Pacific Controlled Release Fertilizers Market Volume by Product, 2014 – 2023 (Tons)
7.14 Rest of Asia Pacific Controlled Release Fertilizers Revenue by Product, 2014 – 2023 (US$ Thousand)
7.14 Rest of Asia Pacific Controlled Release Fertilizers Market Volume by Application, 2014 – 2023 (Tons)
7.14 Rest of Asia Pacific Controlled Release Fertilizers Market Revenue, by Application, 2014 – 2023 (US$ Thousand)
Chapter 8 Company Profiles
8.1 ATS Group
8.2 AgroBridge (Malaysia)
8.3 Shikefeng Chemical Industry Co. Ltd
8.4 Greenfeed Agro Sdn Bhd
8.5 Haifa Chemicals Ltd.
8.6 Hanfeng Evergreen Inc.
8.7 Nufarm Ltd
8.8 HIF TECH SDN. BHD.
8.9 Eurochem Agro Gmbh
8.10 Compo GMBH & Co. KG
8.11 Kingenta Ecological Engineering Group Co., Ltd.
8.12 Central Glass Co., Ltd.
Chapter 9 List of Customers
Chapter 10 Primary Research – Key Findings
Copyright © Transparency Market Research, Inc. All Rights reserved
Trust Online

Asia Pacific Controlled Release Fertilizers Market