
Reports
Reports
Anti-tack agents are materials required for eliminating self-adhesive property of rubber. These materials are applied to the surface of uncured rubber, which provides separation or release after storage during the rubber manufacturing process. Uncured rubber is defined as rubber that does not have superior adhesive properties as compared to other rubbers. Such rubbers possess a sticky characteristic, which is termed as tack. Long-chain polymer molecules are present in rubber in a helical structure, which unravel and form several similar structures when rubber is mixed with other elements. Hence, polymer molecules become entangled when similar uncured rubber surfaces come in contact, which results in cohesion between two rubber surfaces. Hence, helical structures respond to the tighter coil after some time based on stronger cohesion bond. When the temperature of rubber is increased and its viscosity is lowered, its tackiness increases. As a result, anti-tack agents are required to prevent rubber surfaces from sticking to each other.
Anti-tack agents that were developed earlier consisted of high levels of different filler materials and were mixed with soap to coat the rubber. Companies manufacturing rubber began formulating their own anti-tack compounds, thus moving back in the value chain of the rubber industry. These companies produced anti-tacks based on their requirement. Raw material suppliers for the rubber industry also discovered the opportunity to produce anti-tack dips or coatings, which could be supplied to rubber manufacturers. Stearic acid is one of the major raw materials required in the production of stearates. It is commonly present in vegetable and animal oils and fats. However, it is abundant in animal fats as compared to vegetable oils. Vegetable oils and fats include palm oil, cocoa butter, shea butter, and soy oil. Rising prices of fats and oils are resulting in price hike of stearates.
There is lack of consumer awareness regarding stearates such as magnesium stearates across all regions. Various research articles state that magnesium stearate is a toxic and unsafe product. Consumers are highlighting absorption issues related to magnesium stearates. However, there is no such evidence that shows stearates interfere with the intestinal absorption of nutrients. Although magnesium stearate is one of the commonly used incipient in the manufacture of pharmaceuticals, lack of awareness about the stearate among consumers is hampering its market growth. Thus, issues such as rise in raw material prices, environmental regulations, and lack of consumer awareness are likely to hamper growth of the stearates market. This, in turn, is expected to hamper growth of the industry for rubber processing chemicals such as anti-tack agents.
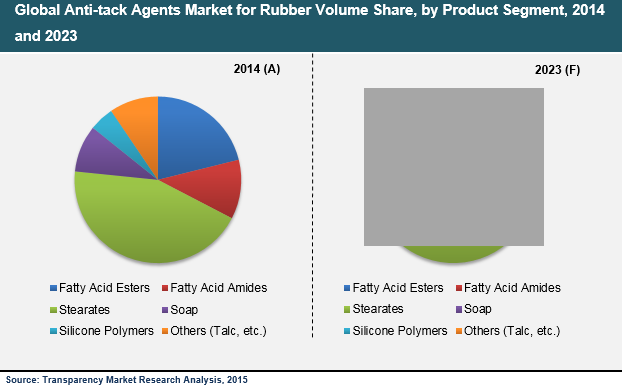
Demand for stearates was the largest in the anti-tack agents market for rubber in 2014. Stearates accounted for over 40% of the anti-tack agents market share in 2014 and are commonly consumed as lubricants and stabilizers in the plastic & rubber processing industry. The plastic & rubber processing industry is one of the major end-users of stearates. In the rubber industry, stearates are considered to be an effective elastomer processing aid and releasing agent. Stearates are often used as vulcanization aid and anti-tacking agent in rubber processing. Fatty acid esters was the second-largest product segment in 2014. Fatty acid esters are used to impart anti-adhesive property to the rubber substrate. Products such as monoglycerides are widely used in the anti-tack agents market for rubber. Other products such as glycerol monostearate (GMS) are also used in uncured rubber and are slowly replacing talc in the anti-tack agents market for rubber.
In 2014, Asia Pacific accounted for over 50% of the anti-tack agents market and exhibited the highest regional demand in the anti-tack agents market for rubber. The region, particularly ASEAN, is largely responsible for substantial production of rubber. This, in turn, has generated high demand for rubber processing chemicals such as anti-tack agents. Countries such as Thailand, Indonesia, and Malaysia are some of the largest consumers of anti-tack agents due to large-scale production of rubber.
Leading companies such as Baerlocher GmbH, Croda International plc, FACI S.p.A., Struktol GmbH, H.L. Blachford Ltd., Evonik Industries AG, Lion Specialty Chemicals Co., Ltd., The HallStar Company, and King Industries, Inc. have been covered in the report.
Chapter 1 Preface
1.1 Report Description
1.2 Market Segmentation
1.2.1 Global Anti-tack Agents Market for Rubber Segmentation: By Product Segment and Region
1.3 Research Scope
1.3.1 Assumptions
1.4 Research Methodology
Chapter 2 Executive Summary
2.1 Global Anti-tack Agents Market for Rubber, 2014–2023 (Tons) (US$ Thousand)
2.1.1 Global Demand for Anti-tack Agents Market for Rubber, 2014–2023 (Tons) (US$ Thousand)
2.2 Anti-tack Agents Market for Rubber: Market Snapshot, 2014 and 2023
Chapter 3 Anti-tack Agents Market for Rubber – Industry Analysis
3.1 Introduction
3.2 Value Chain Analysis
3.3 Market Drivers
3.3.1 Growing Consumption of Rubber in Tire Industry is Expected to Fuel Demand for Anti-tack Agents in Rubber
3.3.1.1 Global Tires Market Volume, 2014–2023 (Bn Units)
3.3.2 Rising Demand for Rubber Processing Chemicals in Rubber Gloves
3.4 Market Restraints
3.4.1 Rising Raw Material Prices Coupled with Environmental Regulations for Anti-tack Agents such as Stearates
3.4.1.1 Raw Material Prices - Vegetable and Tallow Oil (US$ Per Metric Ton)
3.5 Opportunities
3.5.1 China to Dominate Anti-tack Agent Market for SBR
3.6 Porter’s Five forces Analysis
3.6.1 Bargaining Power of Suppliers
3.6.2 Bargaining Power of Buyers
3.6.3 Threat of New Entrants
3.6.4 Threat of Substitutes
3.6.5 Degree of Competition
3.7 Anti-tack Agents Market for Rubber: Market Attractiveness Analysis, 2014
3.8 Anti-tack Agents Market for Rubber: Company Market Share Analysis, 2014
Chapter 4 Raw Material and Price Trend Analysis
4.1 Raw Material and Price Trend Analysis
4.1.1 Stearates
4.1.2 Prices of Vegetable Oil and Tallow 2009 – 2015 (US$/Ton)
4.1.3 Fatty Acid Esters
4.1.4 Price Analysis of Tallow Fatty Acids in the U.S.
Chapter 5 Anti-tack Agents Market for Rubber – Product Segment Analysis
5.1 Global Anti-tack Agents Market for Rubber: Product Segment Overview
5.1.1 Global Anti-tack Agents Market for Rubber Volume Share, by Product Segment, 2014 and 2023
5.2 Fatty Acid Esters
5.2.1 Global Market for Fatty Acid Esters as Anti-tack Agents, 2014–2023 (Tons) (US$ Thousand)
5.3 Fatty Acid Amides
5.3.1 Global Market for Fatty Acid Amides as Anti-tack Agents, 2014–2023 (Tons) (US$ Thousand)
5.4 Stearates
5.4.1 Global Market for Stearates as Anti-tack Agents, 2014–2023 (Tons) (US$ Thousand)
5.5 Soap
5.5.1 Global Market for Soap as Anti-tack Agents, 2014–2023 (Tons) (US$ Thousand)
5.5.2 Silicone Polymers
5.5.3 Global Market for Silicone Polymers as Anti-tack Agents, 2014–2023 (Tons) (US$ Thousand)
5.6 Others (Talc, etc.)
5.6.1 Global Market for Other Anti-tack Agent Products, 2014–2023 (Tons) (US$ Thousand)
Chapter 6 Anti-tack Agents Market for Rubber – Regional Analysis
6.1 Global Anti-tack Agents Market for Rubber: Regional Overview
6.1.1 Anti-tack Agents Market for Rubber Volume Share, by Region, 2014 and 2023
6.2 North America
6.2.1 North America Anti-tack Agents Market for Rubber, Volume, by Product Segment, 2014–2023 (Tons)
6.2.2 North America Anti-tack Agents Market for Rubber, Revenue, by Product Segment, 2014–2023 (US$ Thousand)
6.2.3 U.S.
6.2.3.1 U.S. Anti-tack Agents Market for Rubber, Volume, by Product Segment, 2014–2023 (Tons)
6.2.3.2 U.S. Anti-tack Agents Market for Rubber, Revenue, by Product Segment, 2014–2023 (US$ Thousand)
6.2.4 Rest of North America
6.2.4.1 Rest of North America Anti-tack Agents Market for Rubber, Volume, by Product Segment, 2014–2023 (Tons)
6.2.4.2 Rest of North America Anti-tack Agents Market for Rubber, Revenue, by Product Segment, 2014–2023 (US$ Thousand)
6.3 Europe
6.3.1 Europe Anti-tack Agents Market for Rubber, Volume, by Product Segment, 2014–2023 (Tons)
6.3.2 Europe Anti-tack Agents Market for Rubber, Revenue, by Product Segment, 2014–2023 (US$ Thousand)
6.3.3 Germany
6.3.3.1 Germany Anti-tack Agents Market for Rubber, Volume, by Product Segment, 2014–2023 (Tons)
6.3.3.2 Germany Anti-tack Agents Market for Rubber, Revenue, by Product Segment, 2014–2023 (US$ Thousand)
6.3.4 Italy
6.3.4.1 Italy Anti-tack Agents Market for Rubber, Volume, by Product Segment, 2014–2023 (Tons)
6.3.4.2 Italy Anti-tack Agents Market for Rubber, Revenue, by Product Segment, 2014–2023 (US$ Thousand)
6.3.5 France
6.3.5.1 France Anti-tack Agents Market for Rubber, Volume, by Product Segment, 2014–2023 (Tons)
6.3.5.2 France Anti-tack Agents Market for Rubber, Revenue, by Product Segment, 2014–2023 (US$ Thousand)
6.3.6 U.K.
6.3.6.1 U.K. Anti-tack Agents Market for Rubber, Volume, by Product Segment, 2014–2023 (Tons)
6.3.6.2 U.K. Anti-tack Agents Market for Rubber, Revenue, by Product Segment, 2014–2023 (US$ Thousand)
6.3.7 Spain
6.3.7.1 Spain Anti-tack Agents Market for Rubber, Volume, by Product Segment, 2014–2023 (Tons)
6.3.7.2 Spain Anti-tack Agents Market for Rubber, Revenue, by Product Segment, 2014–2023 (US$ Thousand)
6.3.8 Rest of Europe
6.3.8.1 Rest of Europe Anti-tack Agents Market for Rubber, Volume, by Product Segment, 2014–2023 (Tons) (US$ Thousand)
6.3.8.2 Rest of Europe Anti-tack Agents Market for Rubber, Revenue, by Product Segment, 2014–2023 (US$ Thousand)
6.4 Asia Pacific
6.4.1 Asia Pacific Anti-tack Agents Market for Rubber, Volume, by Product Segment, 2014–2023 (Tons)
6.4.2 Asia Pacific Anti-tack Agents Market for Rubber, Revenue, by Product Segment, 2014–2023 (US$ Thousand)
6.4.3 China
6.4.3.1 China Anti-tack Agents Market for Rubber, Volume, by Product Segment, 2014–2023 (Tons)
6.4.3.2 China Anti-tack Agents Market for Rubber, Revenue, by Product Segment, 2014–2023 (US$ Thousand)
6.4.4 India
6.4.4.1 India Anti-tack Agents Market for Rubber, Volume, by Product Segment, 2014–2023 (Tons)
6.4.4.2 India Anti-tack Agents Market for Rubber, Revenue, by Product Segment, 2014–2023 (US$ Thousand)
6.4.5 ASEAN
6.4.5.1 ASEAN Anti-tack Agents Market for Rubber, Volume, by Product Segment, 2014–2023 (Tons)
6.4.5.2 ASEAN Anti-tack Agents Market for Rubber, Revenue, by Product Segment, 2014–2023 (US$ Thousand)
6.4.6 Rest of Asia Pacific
6.4.6.1 Rest of Asia Pacific Anti-tack Agents Market for Rubber, Volume, by Product Segment, 2014–2023 (Tons) (US$ Thousand)
6.4.6.2 Rest of Asia Pacific Anti-tack Agents Market for Rubber, Revenue, by Product Segment, 2014–2023 (US$ Thousand)
6.5 Latin America
6.5.1 Latin America Anti-tack Agents Market for Rubber, Volume, by Product Segment, 2014–2023 (Tons)
6.5.2 Latin America Anti-tack Agents Market for Rubber, Revenue, by Product Segment, 2014–2023 (US$ Thousand)
6.5.3 Brazil
6.5.3.1 Brazil Anti-tack Agents Market for Rubber, Volume, by Product Segment, 2014–2023 (Tons)
6.5.3.2 Brazil Anti-tack Agents Market for Rubber, Revenue, by Product Segment, 2014–2023 (US$ Thousand)
6.5.4 Rest of Latin America
6.5.4.1 Rest of Latin America Anti-tack Agents Market for Rubber, Volume, by Product Segment, 2014–2023 (Tons)
6.5.4.2 6.5.4 Rest of Latin America Anti-tack Agents Market for Rubber, Revenue, by Product Segment, 2014–2023 (US$ Thousand)
6.6 Middle East & Africa (MEA)
6.6.1 Middle East & Africa (MEA) Anti-tack Agents Market for Rubber, Volume by Product Segment, 2014–2023 (Tons)
6.6.2 Middle East & Africa (MEA) Anti-tack Agents Market for Rubber, Revenue by Product Segment, 2014–2023 (US$ Thousand)
6.6.3 GCC
6.6.3.1 GCC Anti-tack Agents Market for Rubber, Volume by Product Segment, 2014–2023 (Tons)
6.6.3.2 GCC Anti-tack Agents Market for Rubber, Revenue by Product Segment, 2014–2023 (US$ Thousand)
6.6.4 South Africa
6.6.4.1 South Africa Anti-tack Agents Market for Rubber, Volume by Product Segment, 2014–2023 (Tons)
6.6.4.2 South Africa Anti-tack Agents Market for Rubber, Revenue by Product Segment, 2014–2023 (US$ Thousand)
6.6.5 Rest of Middle East & Africa (MEA)
6.6.5.1 Rest of MEA Anti-tack Agents Market for Rubber, Volume by Product Segment, 2014–2023 (Tons)
6.6.5.2 Rest of MEA Anti-tack Agents Market for Rubber, Revenue by Product Segment, 2014–2023 (US$ Thousand)
Chapter 7 Company Profiles
7.1 H. L. Blachford Ltd.
7.2 Croda International plc
7.3 Evonik Industries AG
7.4 Lion Specialty Chemicals Co., Ltd.
7.5 The HallStar Company
7.6 King Industries, Inc.
7.7 FACI SPA
7.8 Peter Greven GmbH & Co. KG
7.9 SASCO Chemical Group, Inc.
7.10 Schill + Seilacher "Struktol" GmbH
7.11 Kettlitz-Chemie GmbH & Co. KG
7.12 Baerlocher GmbH
7.13 McLube
7.14 Chem-Trend L.P.
7.15 Stephenson Alkon Solutions
7.16 Parabor Brasil
7.17 Fragon Produtos para Indústria de Borracha
7.18 Lotréc AB
7.19 Hans W. Barbe Chemische Erzeugnisse GmbH
Chapter 8 Primary Research: Key Findings
8.1 Primary Research
List of Tables
TABLE 1 Anti-tack Agents Market for Rubber: Market Snapshot, 2014 and 2023
TABLE 2 Drivers for Anti-tack Agents Market for Rubber: Impact Analysis
TABLE 3 Restraints for Anti-tack Agents Market for Rubber: Impact Analysis
TABLE 4 North America Anti-tack Agents Market for Rubber, Volume, by Product Segment, 2014–2023 (Tons)
TABLE 5 North America Anti-tack Agents Market for Rubber, Revenue, by Product Segment, 2014–2023 (US$ Thousand)
TABLE 6 U.S. Anti-tack Agents Market for Rubber, Volume, by Product Segment, 2014–2023 (Tons)
TABLE 7 U.S. Anti-tack Agents Market for Rubber, Revenue, by Product Segment, 2014–2023 (US$ Thousand)
TABLE 8 Rest of North America Anti-tack Agents Market for Rubber, Volume, by Product Segment, 2014–2023 (Tons)
TABLE 9 Rest of North America Anti-tack Agents Market for Rubber, Revenue, by Product Segment, 2014–2023 (US$ Thousand)
TABLE 10 Europe Anti-tack Agents Market for Rubber, Volume, by Product Segment, 2014–2023 (Tons)
TABLE 11 Europe Anti-tack Agents Market for Rubber Revenue, by Product Segment, 2014–2023 (US$ Thousand)
TABLE 12 Germany Anti-tack Agents Market for Rubber, Volume, by Product Segment, 2014–2023 (Tons)
TABLE 13 Germany Anti-tack Agents Market for Rubber Revenue, by Product Segment, 2014–2023 (US$ Thousand)
TABLE 14 Italy Anti-tack Agents Market for Rubber, Volume, by Product Segment, 2014–2023 (Tons)
TABLE 15 Italy Anti-tack Agents Market for Rubber, Revenue, by Product Segment, 2014–2023 (US$ Thousand)
TABLE 16 France Anti-tack Agents Market for Rubber, Volume, by Product Segment, 2014–2023 (Tons)
TABLE 17 France Anti-tack Agents Market for Rubber, Revenue, by Product Segment, 2014–2023 (US$ Thousand)
TABLE 18 U.K. Anti-tack Agents Market for Rubber, Volume, by Product Segment, 2014–2023 (Tons)
TABLE 19 U.K. Anti-tack Agents Market for Rubber, Revenue, by Product Segment, 2014–2023 (US$ Thousand)
TABLE 20 Spain Anti-tack Agents Market for Rubber, Volume, by Product Segment, 2014–2023 (Tons)
TABLE 21 Spain Anti-tack Agents Market for Rubber, Revenue, by Product Segment, 2014–2023 (US$ Thousand)
TABLE 22 Rest of Europe Anti-tack Agents Market for Rubber, Volume, by Product Segment, 2014–2023 (Tons)
TABLE 23 Rest of Europe Anti-tack Agents Market for Rubber, Revenue, by Product Segment, 2014–2023 (US$ Thousand)
TABLE 24 Asia Pacific Anti-tack Agents Market for Rubber, Volume, by Product Segment, 2014–2023 (Tons)
TABLE 25 Asia Pacific Anti-tack Agents Market for Rubber Revenue, by Product Segment, 2014–2023 (US$ Thousand)
TABLE 26 China Anti-tack Agents Market for Rubber, Volume, by Product Segment, 2014–2023 (Tons)
TABLE 27 China Anti-tack Agents Market for Rubber Revenue, by Product Segment, 2014–2023 (US$ Thousand)
TABLE 28 India Anti-tack Agents Market for Rubber, Volume, by Product Segment, 2014–2023 (Tons)
TABLE 29 India Anti-tack Agents Market for Rubber Revenue, by Product Segment, 2014–2023 (US$ Thousand)
TABLE 30 ASEAN Anti-tack Agents Market for Rubber, Volume, by Product Segment, 2014–2023 (Tons)
TABLE 31 ASEAN Anti-tack Agents Market for Rubber, Revenue, by Product Segment, 2014–2023 (US$ Thousand)
TABLE 32 Rest of Asia Pacific Anti-tack Agents Market for Rubber, Volume, by Product Segment, 2014–2023 (Tons)
TABLE 33 Rest of Asia Pacific Anti-tack Agents Market for Rubber, Revenue, by Product Segment, 2014–2023 (US$ Thousand)
TABLE 34 Latin America Anti-tack Agents Market for Rubber, Volume, by Product Segment, 2014–2023 (Tons)
TABLE 35 Latin America Anti-tack Agents Market for Rubber Revenue, by Product Segment, 2014–2023 (US$ Thousand)
TABLE 36 Brazil Anti-tack Agents Market for Rubber, Volume, by Product Segment, 2014–2023 (Tons)
TABLE 37 Brazil Anti-tack Agents Market for Rubber Revenue, by Product Segment, 2014–2023 (US$ Thousand)
TABLE 38 Rest of Latin America Anti-tack Agents Market for Rubber, Volume, by Product Segment, 2014–2023 (Tons)
TABLE 39 Rest of Latin America Anti-tack Agents Market for Rubber, Revenue, by Product Segment, 2014–2023 (US$ Thousand)
TABLE 40 Middle East & Africa (MEA) Anti-tack Agents Market for Rubber, Volume, by Product Segment, 2014–2023 (Tons)
TABLE 41 Middle East & Africa (MEA) Anti-tack Agents Market for Rubber, Revenue, by Product Segment, 2014–2023 (US$ Thousand)
TABLE 42 GCC Anti-tack Agents Market for Rubber, Volume, by Product Segment, 2014–2023 (Tons)
TABLE 43 GCC Anti-tack Agents Market for Rubber, Revenue, by Product Segment, 2014–2023 (US$ Thousand)
TABLE 44 South Africa Anti-tack Agents Market for Rubber, Volume, by Product Segment, 2014–2023 (Tons)
TABLE 45 South Africa Anti-tack Agents Market for Rubber, Revenue, by Product Segment, 2014–2023 (US$ Thousand)
TABLE 46 Rest of MEA Anti-tack Agents Market for Rubber, Volume, by Product Segment, 2014–2023 (Tons)
TABLE 47 Rest of MEA Anti-tack Agents Market for Rubber, Revenue, by Product Segment, 2014–2023 (US$ Thousand)
List of Figures
FIG. 1 Global Anti-tack Agents Market for Rubber Segmentation: By Product Segment and Region
FIG. 2 Global Anti-tack Agents Market for Rubber, 2014–2023 (Tons) (US$ Thousand)
FIG. 3 Anti-tack Agents for Rubber: Value Chain Analysis
FIG. 4 Global Tires Market Volume, 2014–2023 (Bn Units)
FIG. 5 Raw Material Prices - Vegetable and Tallow Oil (US$ Per Metric Ton)
FIG. 6 Global Consumption of SBR, 2011
FIG. 7 Porter’s Five Forces Analysis
FIG. 8 Anti-tack Agents Market for Rubber: Market Attractiveness Analysis, 2014
FIG. 9 Anti-tack Agents Market for Rubber: Company Market Share Analysis, 2014
FIG. 10 Global Anti-tack Agent for Rubber Prices for Stearates and Fatty Acid Esters, 2011 – 2015 (US$/Kg)
FIG. 11 Global Vegetable Oil Production, 2007 – 2014 (Mn Tons)
FIG. 12 Prices of Vegetable Oil and Tallow 2009 – 2015 (US$/Ton)
FIG. 13 Global Tallow Fatty Acid Prices, by Region (US$/Kg)
FIG. 14 U.S. Tallow Fatty Acid Prices (FOB), 2011 – 2020 (US$/Kg)
FIG. 15 Global Anti-tack Agents Market for Rubber Volume Share, by Product Segment, 2014 and 2023
FIG. 16 Global Market for Fatty Acid Esters as Anti-tack Agents, 2014–2023 (Tons) (US$ Thousand)
FIG. 17 Global Market for Fatty Acid Amides as Anti-tack Agents, 2014–2023 (Tons) (US$ Thousand)
FIG. 18 Global Market for Stearates as Anti-tack Agents, 2014–2023 (Tons) (US$ Thousand)
FIG. 19 Global Market for Soap as Anti-tack Agents, 2014–2023 (Tons) (US$ Thousand)
FIG. 20 Global Market for Silicone Polymers as Anti-tack Agents, 2014–2023 (Tons) (US$ Thousand)
FIG. 21 Global Market for Other Anti-tack Agent Products, 2014–2023 (Tons) (US$ Thousand)
FIG. 22 Anti-tack Agents Market for Rubber Volume Share, by Region, 2014 and 2023
Copyright © Transparency Market Research, Inc. All Rights reserved
Trust Online

Anti-Tack Agents Market