
Reports
Reports
Analysts’ Viewpoint on On-board Connectivity Market Scenario
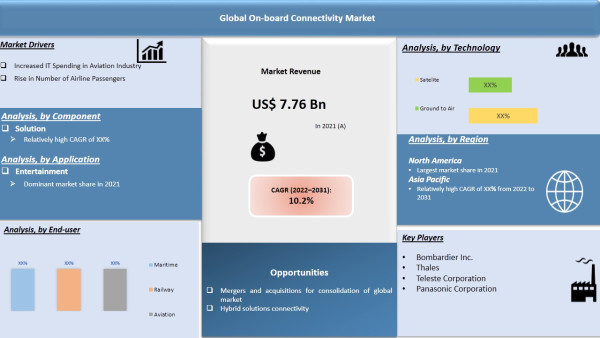
Increase in the number of air passengers and rise in the adoption of mobile electronic devices are key factors driving the global on-board connectivity market. On-board connectivity solutions and services are increasingly being used in various industries such as maritime, railways, and aviation. On-board connectivity solutions offer real-time access to data via a constant and reliable connection from any remote location. The use of on-board connectivity solutions increased rapidly post the COVID-19 pandemic, as the consumption of entertainment and media grew among consumers. Service providers are offering fast, efficient, and affordable on-board connectivity services to enhance their on-board connectivity market share.
On-board connectivity refers to internet connectivity in aircraft, ships, railways, or other transportation systems. Benefits of on-board connectivity include crew and patient safety, operational efficiency, patient care, and communication. Networking technologies involved in providing on-board connectivity are satellite technologies and wireless technologies. Wireless technologies include LTE, Wi-Fi, HSPA, and WIMAX.
Ground-to-air on-board connectivity services provide wireless internet access, mobile phone internet access, group internet packages, and data sharing services. These services enable mobile devices to send and receive short and multimedia messages. On-board Wi-Fi requires airlines, railways, or marines to install new equipment, and sign agreements with telecom operators, satellite service providers, and content providers, which in the long run may increase the cost of travel.
The future of on-board connectivity market is optimistic with companies operating in the aviation sector investing in IT infrastructure, such as wireless connectivity, Internet of Things (IoT), automated solutions, and check-in kiosks, in order to lower their operating expenditure. Adoption of cloud applications, smart network solutions, and satellite communication is also rising among airline operators. These advanced IT technologies promote sustainable operations including data-driven flight path optimization to enhance inflight efficiencies and reduce fuel burn. Increased IT spending in the aviation industry is expected to reduce operating costs. It is also likely to modernize technologies such as the IoT, wireless connectivity, and automated solutions to help deliver a satisfactory onboard passenger experience by providing real-time information to passengers.
Governments across the globe are focused on boosting passenger security in the aviation sector. They are increasingly investing in IT infrastructure to mitigate terrorist attacks such as plane hijacks, bomb blasts, and hijack-crash in the aviation sector. Various telecom companies are investing heavily to expand their connectivity solutions. In August 2022, Inmarsat, a U.K.-based satellite telecommunications company, and Stellar Blu, a provider of high-speed connectivity solutions, announced the development of an advanced next-generation terminal for GX Aviation inflight broadband. Thus, increase in investment in IT infrastructure in the aviation industry is driving the global on-board connectivity market.
Rise in the penetration of Internet of Things (IoT) devices in marine communication is expected to propel the global on-board connectivity market. IoT devices offer high-speed ultra-reliable maritime communication on the ocean. The combination of cellular tower technology and satellite technology provides robust on-board processing solutions that offer various advantages in terms of coverage and bandwidth. Adoption of such hybrid solutions helps deliver synchronized satellite and ground-based communication along with a suite of complementary IT, content, and cyber security services.
Players in the market are focused on the development of robust hybrid communication solutions. Marlink, a leading provider of smart network solutions, builds, plans, and operates best-fit hybrid satellite and terrestrial network solutions that effortlessly connect businesses into a safe, secure, and interconnected community. With the increased requirements for bandwidth and proliferation of devices, hybrid solution connectivity helps deliver advanced systems that improve service accessibility. The aviation sector is increasingly relying on hybrid communication solutions. The European Aviation Network is the first hybrid connectivity solution specially designed for the busy European airspace. Thus, the deployment of hybrid solutions is fueling the global onboard connectivity market.
North America is expected to account for a prominent share of the global on-board connectivity market by the end of 2022. Increase in focus on offering effective communication solutions and services in aviation and marine industries is expected to boost the demand for on-board connectivity solutions in the region. The market in North America is also driven by the presence of major players in the region.
The market in Asia Pacific is projected to grow rapidly during the forecast period. Growth of the market in the region can be ascribed to a rise in IT infrastructure development in countries, such as China, India, Japan, and Singapore, to securely connect with ships and airlines from remote locations.
The global on-board connectivity market is highly fragmented, with a majority of local players controlling a large share of the market. Players in the market are focused on expansion of their product portfolio and market reach through mergers and acquisitions, new product developments, and partnerships with leading players. The next few years are expected to offer scope for the setting up of connectivity on board in untapped markets. Several companies are focused on delivering automated on-board connectivity solutions to provide better customer experiences and unhindered access to connectivity. Alcatel-Lucent S.A., AT&T Inc., Bombardier Inc., Thales Group, Teleste Corporation, Panasonic Corporation, Honeywell International Inc., ZTE Corporation, Nomad Digital, Rockwell Collins, Qualcomm Inc., and Intelsat US LLC are prominent entities operating in the market.
|
Attribute |
Detail |
|
Market Size Value in 2021 |
US$ 7.76 Bn |
|
Market Forecast Value in 2031 |
US$ 19.47 Bn |
|
Growth Rate (CAGR) |
10.2% |
|
Forecast Period |
2022–2031 |
|
Historical Data Available for |
2017–2020 |
|
Quantitative Units |
US$ Bn for Value |
|
Market Analysis |
Includes cross-segment analysis at global as well as regional level. Furthermore, qualitative analysis includes drivers, restraints, opportunities, key trends, ecosystem analysis, and COVID-19 impact analysis. |
|
Competition Landscape |
|
|
Format |
Electronic (PDF) + Excel |
|
Market Segmentation |
|
|
Regions Covered |
|
|
Countries Covered |
|
|
Companies Profiled |
|
|
Customization Scope |
Available upon request |
|
Pricing |
Available upon request |
The on-board connectivity market is anticipated to grow at a CAGR of 10.2% during the forecast period
Component was the largest segment of the global on-board connectivity market
Rise in investment in IT infrastructure in the aviation industry and increase in focus on boosting passenger security in the aviation sector
Increase in adoption of hybrid connectivity solutions and deployment of hybrid communication solutions
Asia Pacific is a more attractive region for vendors in the on-board connectivity market
Alcatel-Lucent S.A., AT&T Inc., Bombardier Inc., Thales Group, Teleste Corporation, Panasonic Corporation, Honeywell International Inc., ZTE Corporation, Nomad Digital, Rockwell Collins, Qualcomm Inc., and Intelsat US LLC
1. Preface
1.1. Market Introduction
1.2. Market Segmentation
1.3. Key Research Objectives
2. Assumptions and Research Methodology
2.1. Research Methodology
2.1.1. List of Primary and Secondary Sources
2.2. Key Assumptions for Data Modelling
3. Executive Summary: Global On-board Connectivity Market
4. Market Overview
4.1. Market Definition
4.2. Technology/ Product Roadmap
4.3. Market Factor Analysis
4.3.1. Forecast Factors
4.3.2. Ecosystem/ Value Chain Analysis
4.3.3. Market Dynamics (Growth Influencers)
4.3.3.1. Drivers
4.3.3.2. Restraints
4.3.3.3. Opportunities
4.3.3.4. Impact Analysis of Drivers and Restraints
4.4. COVID-19 Impact Analysis
4.4.1. Impact of COVID-19 on On-board Connectivity Market
4.4.2. End-user Sentiment Analysis: Comparative Analysis on Spending
4.4.2.1. Increase in Spending
4.4.2.2. Decrease in Spending
4.4.3. Short Term and Long Term Impact on the Market
4.5. Market Opportunity Assessment – by Region (North America/ Europe/ Asia Pacific/ Middle East and Africa/ South America)
4.5.1. By Component
4.5.2. By Technology
4.5.3. By Application
4.5.4. By End-user
5. Global On-board Connectivity Market Analysis and Forecast
5.1. Market Revenue Analysis (US$ Bn), 2016-2031
5.1.1. Historic Growth Trends, 2016-2021
5.1.2. Forecast Trends, 2022-2031
6. Global On-board Connectivity Market Analysis, by Component
6.1. Overview and Definitions
6.2. Key Segment Analysis
6.3. On-board Connectivity Market Size (US$ Bn) Forecast, by Component, 2018 - 2031
6.3.1. Solutions
6.3.2. Services
7. Global On-board Connectivity Market Analysis, by Technology
7.1. Overview and Definitions
7.2. Key Segment Analysis
7.3. On-board Connectivity Market Size (US$ Bn) Forecast, by Technology, 2018 - 2031
7.3.1. Satellite
7.3.2. Ground-to-Air
8. Global On-board Connectivity Market Analysis, by Application
8.1. Overview and Definitions
8.2. Key Segment Analysis
8.3. On-board Connectivity Market Size (US$ Bn) Forecast, by Application, 2018 - 2031
8.3.1. Entertainment
8.3.2. Communication
8.3.3. Monitoring
9. Global On-board Connectivity Market Analysis, by End-user
9.1. Overview and Definitions
9.2. Key Segment Analysis
9.3. On-board Connectivity Market Size (US$ Bn) Forecast, by End-user, 2018 - 2031
9.3.1. Maritime
9.3.2. Railway
9.3.3. Aviation
10. Global On-board Connectivity Market Analysis and Forecasts, by Region
10.1. Key Findings
10.2. On-board Connectivity Market Size (US$ Bn) Forecast by Region, 2018-2031
10.2.1. North America
10.2.2. Europe
10.2.3. Asia Pacific
10.2.4. Middle East & Africa
10.2.5. South America
11. North America On-board Connectivity Market Analysis and Forecast
11.1. Regional Outlook
11.2. On-board Connectivity Market Size (US$ Bn) Analysis and Forecast, 2018 - 2031
11.2.1. By Component
11.2.2. By Technology
11.2.3. By Application
11.2.4. By End-user
11.3. On-board Connectivity Market Size (US$ Bn) Forecast, by Country, 2018 - 2031
11.3.1. U.S.
11.3.2. Canada
11.3.3. Mexico
12. Europe On-board Connectivity Market Analysis and Forecast
12.1. Regional Outlook
12.2. On-board Connectivity Market Size (US$ Bn) Analysis and Forecast, 2018 - 2031
12.2.1. By Component
12.2.2. By Technology
12.2.3. By Application
12.2.4. By End-user
12.3. On-board Connectivity Market Size (US$ Bn) Forecast, by Country and Sub-region, 2018 - 2031
12.3.1. Germany
12.3.2. UK
12.3.3. France
12.3.4. Italy
12.3.5. Spain
12.3.6. Rest of Europe
13. Asia Pacific On-board Connectivity Market Analysis and Forecast
13.1. Regional Outlook
13.2. On-board Connectivity Market Size (US$ Bn) Analysis and Forecast, 2018 - 2031
13.2.1. By Component
13.2.2. By Technology
13.2.3. By Application
13.2.4. By End-user
13.3. On-board Connectivity Market Size (US$ Bn) Forecast, by Country and Sub-region, 2018 - 2031
13.3.1. China
13.3.2. India
13.3.3. Japan
13.3.4. ASEAN
13.3.5. Rest of Asia Pacific
14. Middle East & Africa On-board Connectivity Market Analysis and Forecast
14.1. Regional Outlook
14.2. On-board Connectivity Market Size (US$ Bn) Analysis and Forecast, 2018 - 2031
14.2.1. By Component
14.2.2. By Technology
14.2.3. By Application
14.2.4. By End-user
14.3. On-board Connectivity Market Size (US$ Bn) Forecast, by Country and Sub-region, 2018 - 2031
14.3.1. Saudi Arabia
14.3.2. UAE
14.3.3. South Africa
14.3.4. Rest of Middle East & Africa
15. South America On-board Connectivity Market Analysis and Forecast
15.1. Regional Outlook
15.2. On-board Connectivity Market Size (US$ Bn) Analysis and Forecast, 2018 - 2031
15.2.1. By Component
15.2.2. By Technology
15.2.3. By Application
15.2.4. By End-user
15.3. On-board Connectivity Market Size (US$ Bn) Forecast, by Country and Sub-region, 2018 - 2031
15.3.1. Brazil
15.3.2. Argentina
15.3.3. Rest of South America
16. Competition Landscape
16.1. Market Competition Matrix, by Leading Players
16.2. Market Revenue Share Analysis (%), by Leading Players (2021)
16.3. Competitive Scenario
16.3.1. List of Emerging, Prominent and Leading Players
16.3.2. Major Mergers & Acquisitions, Expansions, Partnership, Contacts, Deals, etc.
17. Company Profiles
17.1. Alcatel-Lucent S.A.
17.1.1. Business Overview
17.1.2. Company Revenue
17.1.3. Product Portfolio
17.1.4. Geographic Footprint
17.1.5. Strategic Partnership, Merger & Acquisition, Business Expansion, New Product Launch, Innovation etc.
17.2. AT&T Inc.
17.2.1. Business Overview
17.2.2. Company Revenue
17.2.3. Product Portfolio
17.2.4. Geographic Footprint
17.2.5. Strategic Partnership, Merger & Acquisition, Business Expansion, New Product Launch, Innovation etc.
17.3. Bombardier Inc.
17.3.1. Business Overview
17.3.2. Company Revenue
17.3.3. Product Portfolio
17.3.4. Geographic Footprint
17.3.5. Strategic Partnership, Merger & Acquisition, Business Expansion, New Product Launch, Innovation etc.
17.4. Thales Group
17.4.1. Business Overview
17.4.2. Company Revenue
17.4.3. Product Portfolio
17.4.4. Geographic Footprint
17.4.5. Strategic Partnership, Merger & Acquisition, Business Expansion, New Product Launch, Innovation etc.
17.5. Teleste Corporation
17.5.1. Business Overview
17.5.2. Company Revenue
17.5.3. Product Portfolio
17.5.4. Geographic Footprint
17.5.5. Strategic Partnership, Merger & Acquisition, Business Expansion, New Product Launch, Innovation etc.
17.6. Panasonic Corporation
17.6.1. Business Overview
17.6.2. Company Revenue
17.6.3. Product Portfolio
17.6.4. Geographic Footprint
17.6.5. Strategic Partnership, Merger & Acquisition, Business Expansion, New Product Launch, Innovation etc.
17.7. Honeywell International Inc.
17.7.1. Business Overview
17.7.2. Company Revenue
17.7.3. Product Portfolio
17.7.4. Geographic Footprint
17.7.5. Strategic Partnership, Merger & Acquisition, Business Expansion, New Product Launch, Innovation etc.
17.8. ZTE Corporation
17.8.1. Business Overview
17.8.2. Company Revenue
17.8.3. Product Portfolio
17.8.4. Geographic Footprint
17.8.5. Strategic Partnership, Merger & Acquisition, Business Expansion, New Product Launch, Innovation etc.
17.9. Nomad Digital
17.9.1. Business Overview
17.9.2. Company Revenue
17.9.3. Product Portfolio
17.9.4. Geographic Footprint
17.9.5. Strategic Partnership, Merger & Acquisition, Business Expansion, New Product Launch, Innovation etc.
17.10. Rockwell Collins
17.10.1. Business Overview
17.10.2. Company Revenue
17.10.3. Product Portfolio
17.10.4. Geographic Footprint
17.10.5. Strategic Partnership, Merger & Acquisition, Business Expansion, New Product Launch, Innovation etc.
17.11. Qualcomm Inc.
17.11.1. Business Overview
17.11.2. Company Revenue
17.11.3. Product Portfolio
17.11.4. Geographic Footprint
17.11.5. Strategic Partnership, Merger & Acquisition, Business Expansion, New Product Launch, Innovation etc.
17.12. Intelsat US LLC
17.12.1. Business Overview
17.12.2. Company Revenue
17.12.3. Product Portfolio
17.12.4. Geographic Footprint
17.12.5. Strategic Partnership, Merger & Acquisition, Business Expansion, New Product Launch, Innovation etc.
17.13. Others
18. Key Takeaways
List of Tables
Table 1: Acronyms Used in the On-board Connectivity Market
Table 2: North America On-board Connectivity Market Revenue Analysis, by Country, 2022 - 2031 (US$ Bn)
Table 3: Europe On-board Connectivity Market Revenue Analysis, by Country, 2022 - 2031 (US$ Bn)
Table 4: Asia Pacific On-board Connectivity Market Revenue Analysis, by Country, 2022 - 2031 (US$ Bn)
Table 5: Middle East & Africa On-board Connectivity Market Revenue Analysis, by Country, 2021 and 2031 (US$ Bn)
Table 6: South America On-board Connectivity Market Revenue Analysis, by Country, 2022 - 2031 (US$ Bn)
Table 7: Impact Analysis of Drivers & Restraints
Table 8: Global On-board Connectivity Market Value (US$ Bn) Forecast, by Component, 2018 – 2031
Table 9: Global On-board Connectivity Market Value (US$ Bn) Forecast, by Technology, 2018 – 2031
Table 10: Global On-board Connectivity Market Value (US$ Bn) Forecast, by Application, 2018 – 2031
Table 11: Global On-board Connectivity Market Volume (US$ Bn) Forecast, by End-user, 2018 – 2031
Table 12: Global On-board Connectivity Market Volume (US$ Bn) Forecast, by Region, 2018 – 2031
Table 13: North America On-board Connectivity Market Value (US$ Bn) Forecast, by Component, 2018 – 2031
Table 14: North America On-board Connectivity Market Value (US$ Bn) Forecast, by Technology, 2018 – 2031
Table 15: North America On-board Connectivity Market Value (US$ Bn) Forecast, by Application, 2018 – 2031
Table 16: North America On-board Connectivity Market Value (US$ Bn) Forecast, by End-user, 2018 – 2031
Table 17: North America On-board Connectivity Market Value (US$ Bn) Forecast, by Country, 2018 - 2031
Table 18: U.S. On-board Connectivity Market Revenue CAGR Breakdown (%), by Growth Term
Table 19: Canada On-board Connectivity Market Revenue CAGR Breakdown (%), by Growth Term
Table 20: Mexico On-board Connectivity Market Revenue CAGR Breakdown (%), by Growth Term
Table 21: Europe On-board Connectivity Market Value (US$ Bn) Forecast, by Component, 2018 – 2031
Table 22: Europe On-board Connectivity Market Value (US$ Bn) Forecast, by Technology, 2018 – 2031
Table 23: Europe On-board Connectivity Market Value (US$ Bn) Forecast, by Application, 2018 – 2031
Table 24: Europe On-board Connectivity Market Value (US$ Bn) Forecast, by End-user, 2018 – 2031
Table 25: Europe On-board Connectivity Market Value (US$ Bn) Forecast, by Country and Sub-region, 2018 - 2031
Table 26: Germany On-board Connectivity Market Revenue CAGR Breakdown (%), by Growth Term
Table 27: U.K. On-board Connectivity Market Revenue CAGR Breakdown (%), by Growth Term
Table 28: France On-board Connectivity Market Revenue CAGR Breakdown (%), by Growth Term
Table 29: Spain On-board Connectivity Market Revenue CAGR Breakdown (%), by Growth Term
Table 30: Italy On-board Connectivity Market Revenue CAGR Breakdown (%), by Growth Term
Table 31: Asia Pacific On-board Connectivity Market Value (US$ Bn) Forecast, by Component, 2018 – 2031
Table 32: Asia Pacific On-board Connectivity Market Value (US$ Bn) Forecast, by Technology, 2018 – 2031
Table 33: Asia Pacific On-board Connectivity Market Value (US$ Bn) Forecast, by Application, 2018 – 2031
Table 34: Asia Pacific On-board Connectivity Market Value (US$ Bn) Forecast, by End-user, 2018 – 2031
Table 35: Asia Pacific On-board Connectivity Market Value (US$ Bn) Forecast, by Country and Sub-region, 2018 - 2031
Table 36: China On-board Connectivity Market Revenue CAGR Breakdown (%), by Growth Term
Table 37: India On-board Connectivity Market Revenue CAGR Breakdown (%), by Growth Term
Table 38: Japan On-board Connectivity Market Revenue CAGR Breakdown (%), by Growth Term
Table 39: ASEAN On-board Connectivity Market Revenue CAGR Breakdown (%), by Growth Term
Table 40: Middle East & Africa On-board Connectivity Market Value (US$ Bn) Forecast, by Component, 2018 – 2031
Table 41: Middle East & Africa On-board Connectivity Market Value (US$ Bn) Forecast, by Technology, 2018 – 2031
Table 42: Middle East & Africa On-board Connectivity Market Value (US$ Bn) Forecast, by Application, 2018 – 2031
Table 43: Middle East & Africa On-board Connectivity Market Value (US$ Bn) Forecast, by End-user, 2018 – 2031
Table 44: Middle East & Africa On-board Connectivity Market Value (US$ Bn) Forecast, by Country and Sub-region, 2018 - 2031
Table 45: Saudi Arabia On-board Connectivity Market Revenue CAGR Breakdown (%), by Growth Term
Table 46: U.A.E. On-board Connectivity Market Revenue CAGR Breakdown (%), by Growth Term
Table 47: South Africa On-board Connectivity Market Revenue CAGR Breakdown (%), by Growth Term
Table 48: South America On-board Connectivity Market Value (US$ Bn) Forecast, by Component, 2018 – 2031
Table 49: South America On-board Connectivity Market Value (US$ Bn) Forecast, by Technology, 2018 – 2031
Table 50: South America On-board Connectivity Market Value (US$ Bn) Forecast, by Application, 2018 – 2031
Table 51: South America On-board Connectivity Market Value (US$ Bn) Forecast, by End-user, 2018 – 2031
Table 52: South America On-board Connectivity Market Value (US$ Bn) Forecast, by Country and Sub-region, 2018 - 2031
Table 53: Brazil On-board Connectivity Market Revenue CAGR Breakdown (%), by Growth Term
Table 54: Argentina On-board Connectivity Market Revenue CAGR Breakdown (%), by Growth Term
Table 55: Mergers & Acquisitions, Expansions (1/2)
Table 56: Mergers & Acquisitions, Expansions (2/2)
List of Figures
Figure 1: Global On-board Connectivity Market Size (US$ Bn) Forecast, 2018–2031
Figure 2: Global On-board Connectivity Market Revenue (US$ Bn) Opportunity Assessment, by Region, 2021E
Figure 3: Top Segment Analysis of On-board Connectivity Market
Figure 4: Global On-board Connectivity Market Revenue (US$ Bn) Opportunity Assessment, by Region, 2031F
Figure 5: Global On-board Connectivity Market Attractiveness Assessment, by Component
Figure 6: Global On-board Connectivity Market Attractiveness Assessment, by Technology
Figure 7: Global On-board Connectivity Market Attractiveness Assessment, by Application
Figure 8: Global On-board Connectivity Market Attractiveness Assessment, by End-user
Figure 9: Global On-board Connectivity Market Attractiveness Assessment, by Region
Figure 10: Global On-board Connectivity Market Revenue (US$ Bn) Historic Trends, 2016 - 2020
Figure 11: Global On-board Connectivity Market Revenue Opportunity (US$ Bn) Historic Trends, 2016 - 2020
Figure 12: Global On-board Connectivity Market Value Share Analysis, by Component, 2021
Figure 13: Global On-board Connectivity Market Value Share Analysis, by Component, 2031
Figure 14: Global On-board Connectivity Market Absolute Opportunity (US$ Bn), by Solutions, 2022 – 2031
Figure 15: Global On-board Connectivity Market Absolute Opportunity (US$ Bn), by Services, 2022 – 2031
Figure 16: Global On-board Connectivity Market Value Share Analysis, by Technology, 2021
Figure 17: Global On-board Connectivity Market Value Share Analysis, by Technology, 2031
Figure 18: Global On-board Connectivity Market Absolute Opportunity (US$ Bn), by Satellite, 2022 – 2031
Figure 19: Global On-board Connectivity Market Absolute Opportunity (US$ Bn), by Ground-to-Air, 2022 – 2031
Figure 20: Global On-board Connectivity Market Value Share Analysis, by Application, 2021
Figure 21: Global On-board Connectivity Market Value Share Analysis, by Application, 2031
Figure 22: Global On-board Connectivity Market Absolute Opportunity (US$ Bn), by Entertainment, 2022 – 2031
Figure 23: Global On-board Connectivity Market Absolute Opportunity (US$ Bn), by Communication, 2022 – 2031
Figure 24: Global On-board Connectivity Market Absolute Opportunity (US$ Bn), by Monitoring, 2022 – 2031
Figure 25: Global On-board Connectivity Market Value Share Analysis, by End-user, 2021
Figure 26: Global On-board Connectivity Market Value Share Analysis, by End-user, 2031
Figure 27: Global On-board Connectivity Market Absolute Opportunity (US$ Bn), by Maritime, 2022 – 2031
Figure 28: Global On-board Connectivity Market Absolute Opportunity (US$ Bn), by Railway, 2022 – 2031
Figure 29: Global On-board Connectivity Market Absolute Opportunity (US$ Bn), by Aviation, 2022 – 2031
Figure 30: Global On-board Connectivity Market Value Share Analysis, by Region, 2031
Figure 31: North America On-board Connectivity Market Absolute Opportunity (US$ Bn), 2022 – 2031
Figure 32: Europe On-board Connectivity Market Absolute Opportunity (US$ Bn), 2022 – 2031
Figure 33: Asia Pacific On-board Connectivity Market Absolute Opportunity (US$ Bn), 2022 – 2031
Figure 34: Middle East & Africa On-board Connectivity Market Absolute Opportunity (US$ Bn), 2022 – 2031
Figure 35: South America On-board Connectivity Market Absolute Opportunity (US$ Bn), 2022 – 2031
Figure 36: North America On-board Connectivity Revenue Opportunity Share, by Component
Figure 37: North America On-board Connectivity Revenue Opportunity Share, by Technology
Figure 38: North America On-board Connectivity Revenue Opportunity Share, by Application
Figure 39: North America On-board Connectivity Revenue Opportunity Share, by End-user
Figure 40: North America l On-board Connectivity Market Value Share Analysis, by Component, 2021
Figure 41: North America On-board Connectivity Market Value Share Analysis, by Component, 2031
Figure 42: North America On-board Connectivity Market Absolute Opportunity (US$ Bn), by Solutions, 2022 – 2031
Figure 43: North America On-board Connectivity Market Absolute Opportunity (US$ Bn), by Services, 2022 – 2031
Figure 44: North America On-board Connectivity Market Value Share Analysis, by Technology, 2021
Figure 45: North America On-board Connectivity Market Value Share Analysis, by Technology, 2031
Figure 46: North America On-board Connectivity Market Absolute Opportunity (US$ Bn), by Satellite, 2022 – 2031
Figure 47: North America On-board Connectivity Market Absolute Opportunity (US$ Bn), by Ground-to-Air, 2022 – 2031
Figure 48: North America On-board Connectivity Market Value Share Analysis, by Application, 2021
Figure 49: North America On-board Connectivity Market Value Share Analysis, by Application, 2031
Figure 50: North America On-board Connectivity Market Absolute Opportunity (US$ Bn), by Entertainment, 2022 – 2031
Figure 51: North America On-board Connectivity Market Absolute Opportunity (US$ Bn), by Communication, 2022 – 2031
Figure 52: North America On-board Connectivity Market Absolute Opportunity (US$ Bn), by Monitoring, 2022 – 2031
Figure 53: North America On-board Connectivity Market Value Share Analysis, by End-user, 2021
Figure 54: North America On-board Connectivity Market Value Share Analysis, by End-user, 2031
Figure 55: North America On-board Connectivity Market Absolute Opportunity (US$ Bn), by Maritime, 2022 – 2031
Figure 56: North America On-board Connectivity Market Absolute Opportunity (US$ Bn), by Railway, 2022 – 2031
Figure 57: North America On-board Connectivity Market Absolute Opportunity (US$ Bn), by Aviation, 2022 – 2031
Figure 58: North America On-board Connectivity Market Absolute Opportunity (US$ Bn), by Country, 2022 – 2031
Figure 59: North America On-board Connectivity Market Absolute Opportunity (US$ Bn), by Country, 2022 – 2031
Figure 60: Mexico On-board Connectivity Market Opportunity Growth Analysis (US$ Bn) Forecast, 2022 – 2031
Figure 61: Europe On-board Connectivity Revenue Opportunity Share, by Component
Figure 62: Europe On-board Connectivity Revenue Opportunity Share, by Technology
Figure 63: Europe On-board Connectivity Revenue Opportunity Share, by Application
Figure 64: Europe On-board Connectivity Market Value Share Analysis, by Component, 2021
Figure 65: Europe On-board Connectivity Market Value Share Analysis, by Component, 2031
Figure 66: Europe On-board Connectivity Market Absolute Opportunity (US$ Bn), by Solutions , 2022 – 2031
Figure 67: Europe On-board Connectivity Market Absolute Opportunity (US$ Bn), by Services, 2022 – 2031
Figure 68: Europe On-board Connectivity Market Value Share Analysis, by Technology, 2021
Figure 69: Europe On-board Connectivity Market Value Share Analysis, by Technology, 2031
Figure 70: Europe On-board Connectivity Market Absolute Opportunity (US$ Bn), by Satellite, 2022 – 2031
Figure 71: Europe On-board Connectivity Market Absolute Opportunity (US$ Bn), by Ground-to-Air, 2022 – 2031
Figure 72: Europe On-board Connectivity Market Value Share Analysis, by Application, 2021
Figure 73: Europe On-board Connectivity Market Value Share Analysis, by Application, 2031
Figure 74: Europe On-board Connectivity Market Absolute Opportunity (US$ Bn), by Entertainment, 2022 – 2031
Figure 75: Europe On-board Connectivity Market Absolute Opportunity (US$ Bn), by Communication, 2022 – 2031
Figure 76: Europe On-board Connectivity Market Absolute Opportunity (US$ Bn), by Monitoring, 2022 – 2031
Figure 77: Europe On-board Connectivity Market Value Share Analysis, by End-user, 2021
Figure 78: Europe On-board Connectivity Market Value Share Analysis, by End-user, 2031
Figure 79: Europe On-board Connectivity Market Absolute Opportunity (US$ Bn), by Maritime, 2022 – 2031
Figure 80: Europe On-board Connectivity Market Absolute Opportunity (US$ Bn), by Railway, 2022 – 2031
Figure 81: Europe On-board Connectivity Market Absolute Opportunity (US$ Bn), by Aviation, 2022 – 2031
Figure 82: Europe On-board Connectivity Market Value Share Analysis, by Country and Sub-region, 2021
Figure 83: Europe On-board Connectivity Market Value Share Analysis, by Country and Sub-region, 2031
Figure 84: Germany On-board Connectivity Market Opportunity Growth Analysis (US$ Bn) Forecast, 2022 – 2031
Figure 85: U.K. On-board Connectivity Market Opportunity Growth Analysis (US$ Bn) Forecast, 2022 – 2031
Figure 86: France On-board Connectivity Market Opportunity Growth Analysis (US$ Bn) Forecast, 2022 – 2031
Figure 87: Italy On-board Connectivity Market Opportunity Growth Analysis (US$ Bn) Forecast, 2022 – 2031
Figure 88: Spain On-board Connectivity Market Opportunity Growth Analysis (US$ Bn) Forecast, 2022 – 2031
Figure 89: Asia Pacific On-board Connectivity Revenue Opportunity Share, by Component
Figure 90: Asia Pacific On-board Connectivity Revenue Opportunity Share, by Technology
Figure 91: Asia Pacific On-board Connectivity Revenue Opportunity Share, by Application
Figure 92: Asia Pacific l On-board Connectivity Market Value Share Analysis, by Component, 2021
Figure 93: Asia Pacific On-board Connectivity Market Value Share Analysis, by Component, 2031
Figure 94: Asia Pacific On-board Connectivity Market Absolute Opportunity (US$ Bn), by Solutions , 2022 – 2031
Figure 95: Asia Pacific On-board Connectivity Market Absolute Opportunity (US$ Bn), by Services, 2022 – 2031
Figure 96: Asia Pacific On-board Connectivity Market Value Share Analysis, by Technology, 2021
Figure 97: Asia Pacific On-board Connectivity Market Value Share Analysis, by Technology, 2031
Figure 98: Asia Pacific On-board Connectivity Market Absolute Opportunity (US$ Bn), by Satellite, 2022 – 2031
Figure 99: Asia Pacific On-board Connectivity Market Absolute Opportunity (US$ Bn), by Ground-to-Air, 2022 – 2031
Figure 100: Asia Pacific On-board Connectivity Market Value Share Analysis, by Application, 2021
Figure 101: Asia Pacific On-board Connectivity Market Value Share Analysis, by Application, 2031
Figure 102: Asia Pacific On-board Connectivity Market Absolute Opportunity (US$ Bn), by Entertainment, 2022 – 2031
Figure 103: Asia Pacific On-board Connectivity Market Absolute Opportunity (US$ Bn), by Communication, 2022 – 2031
Figure 104: Asia Pacific On-board Connectivity Market Absolute Opportunity (US$ Bn), by Monitoring, 2022 – 2031
Figure 105: Asia Pacific On-board Connectivity Market Value Share Analysis, by End-user, 2021
Figure 106: Asia Pacific On-board Connectivity Market Value Share Analysis, by End-user, 2031
Figure 107: Asia Pacific On-board Connectivity Market Absolute Opportunity (US$ Bn), by Maritime, 2022 – 2031
Figure 108: Asia Pacific On-board Connectivity Market Absolute Opportunity (US$ Bn), by Aviation, 2022 – 2031
Figure 109: Asia Pacific On-board Connectivity Market Value Share Analysis, by Country and Sub-region, 2021
Figure 110: Asia Pacific On-board Connectivity Market Value Share Analysis, by Country and Sub-region, 2031
Figure 111: China On-board Connectivity Market Opportunity Growth Analysis (US$ Bn) Forecast, 2022 – 2031
Figure 112: India On-board Connectivity Market Opportunity Growth Analysis (US$ Bn) Forecast, 2022 – 2031
Figure 113: Japan On-board Connectivity Market Opportunity Growth Analysis (US$ Bn) Forecast, 2022 – 2031
Figure 114: ASEAN On-board Connectivity Market Opportunity Growth Analysis (US$ Bn) Forecast, 2022 – 2031
Figure 115: Middle East & Africa On-board Connectivity Revenue Opportunity Share, by Component
Figure 116: Middle East & Africa On-board Connectivity Revenue Opportunity Share, by Technology
Figure 117: Middle East & Africa On-board Connectivity Revenue Opportunity Share, by Application
Figure 118: Middle East & Africa l On-board Connectivity Market Value Share Analysis, by Component, 2021
Figure 119: Middle East & Africa On-board Connectivity Market Value Share Analysis, by Component, 2031
Figure 120: Middle East & Africa On-board Connectivity Market Absolute Opportunity (US$ Bn), by Solutions (SIP) Trunking, 2022 – 2031
Figure 121: Middle East & Africa On-board Connectivity Market Absolute Opportunity (US$ Bn), by Services, 2022 – 2031
Figure 122: Middle East & Africa On-board Connectivity Market Value Share Analysis, by Technology, 2021
Figure 123: Middle East & Africa On-board Connectivity Market Value Share Analysis, by Technology, 2031
Figure 124: Middle East & Africa On-board Connectivity Market Absolute Opportunity (US$ Bn), by Satellite, 2022 – 2031
Figure 125: Middle East & Africa On-board Connectivity Market Absolute Opportunity (US$ Bn), by Ground-to-Air, 2022 – 2031
Figure 126: Middle East & Africa On-board Connectivity Market Value Share Analysis, by Application, 2021
Figure 127: Middle East & Africa On-board Connectivity Market Value Share Analysis, by Application, 2031
Figure 128: Middle East & Africa On-board Connectivity Market Absolute Opportunity (US$ Bn), by Entertainment, 2022 – 2031
Figure 129: Middle East & Africa On-board Connectivity Market Absolute Opportunity (US$ Bn), by Communication, 2022 – 2031
Figure 130: Middle East & Africa On-board Connectivity Market Absolute Opportunity (US$ Bn), by Monitoring, 2022 – 2031
Figure 131: Middle East & Africa On-board Connectivity Market Value Share Analysis, by End-user, 2021
Figure 132: Middle East & Africa On-board Connectivity Market Value Share Analysis, by End-user, 2031
Figure 133: Middle East & Africa On-board Connectivity Market Absolute Opportunity (US$ Bn), by Maritime, 2022 – 2031
Figure 134: Middle East & Africa On-board Connectivity Market Absolute Opportunity (US$ Bn), by Railway, 2022 – 2031
Figure 135: Middle East & Africa On-board Connectivity Market Absolute Opportunity (US$ Bn), by Aviation, 2022 – 2031
Figure 136: Middle East & Africa On-board Connectivity Market Value Share Analysis, by Country and Sub-region, 2021
Figure 137: Middle East & Africa On-board Connectivity Market Value Share Analysis, by Country and Sub-region, 2031
Figure 138: Saudi Arabia On-board Connectivity Market Opportunity Growth Analysis (US$ Bn) Forecast, 2022 – 2031
Figure 139: U.A.E. On-board Connectivity Market Opportunity Growth Analysis (US$ Bn) Forecast, 2022 – 2031
Figure 140: South Africa On-board Connectivity Market Opportunity Growth Analysis (US$ Bn) Forecast, 2022 – 2031
Figure 141: South America On-board Connectivity Revenue Opportunity Share, by Component
Figure 142: South America On-board Connectivity Revenue Opportunity Share, by Technology
Figure 143: South America On-board Connectivity Revenue Opportunity Share, by Application
Figure 144: South America On-board Connectivity Market Value Share Analysis, by Component, 2021
Figure 145: South America On-board Connectivity Market Value Share Analysis, by Component, 2031
Figure 146: South America On-board Connectivity Market Absolute Opportunity (US$ Bn), by Solutions, 2022 – 2031
Figure 147: South America On-board Connectivity Market Absolute Opportunity (US$ Bn), by Services, 2022 – 2031
Figure 148: South America On-board Connectivity Market Value Share Analysis, by Technology, 2021
Figure 149: South America On-board Connectivity Market Value Share Analysis, by Technology, 2031
Figure 150: South America On-board Connectivity Market Absolute Opportunity (US$ Bn), by Satellite, 2022 – 2031
Figure 151: South America On-board Connectivity Market Absolute Opportunity (US$ Bn), by Ground-to-Air, 2022 – 2031
Figure 152: South America On-board Connectivity Market Value Share Analysis, by Application, 2021
Figure 153: South America On-board Connectivity Market Value Share Analysis, by Application, 2031
Figure 154: South America On-board Connectivity Market Absolute Opportunity (US$ Bn), by Entertainment, 2022 – 2031
Figure 155: South America On-board Connectivity Market Absolute Opportunity (US$ Bn), by Communication, 2022 – 2031
Figure 156: South America On-board Connectivity Market Absolute Opportunity (US$ Bn), by Monitoring, 2022 – 2031
Figure 157: South America On-board Connectivity Market Value Share Analysis, by End-user, 2021
Figure 158: South America On-board Connectivity Market Value Share Analysis, by End-user, 2031
Figure 159: South America On-board Connectivity Market Absolute Opportunity (US$ Bn), by Maritime, 2022 – 2031
Figure 160: South America On-board Connectivity Market Absolute Opportunity (US$ Bn), by Railway, 2022 – 2031
Figure 161: South America On-board Connectivity Market Absolute Opportunity (US$ Bn), by Aviation, 2022 – 2031
Figure 162: South America On-board Connectivity Market Value Share Analysis, by Country and Sub-region, 2021
Figure 163: South America On-board Connectivity Market Value Share Analysis, by Country and Sub-region, 2031
Figure 164: Brazil On-board Connectivity Market Opportunity Growth Analysis (US$ Bn) Forecast, 2022 – 2031
Figure 165: Argentina On-board Connectivity Market Opportunity Growth Analysis (US$ Bn) Forecast, 2022 – 2031
Copyright © Transparency Market Research, Inc. All Rights reserved
Trust Online

On-board Connectivity Market