
Reports
Reports
North America Facilities Management Market: Snapshot
The North America facilities management market is benefitting from increasing business practices of engaging third-party for support services. Business are increasingly outsourcing facility management pursuits to focus on core business functions and save valuable time of employees from being used for non-core business functions. Thus, outsourcing helps businesses gain in the long run.
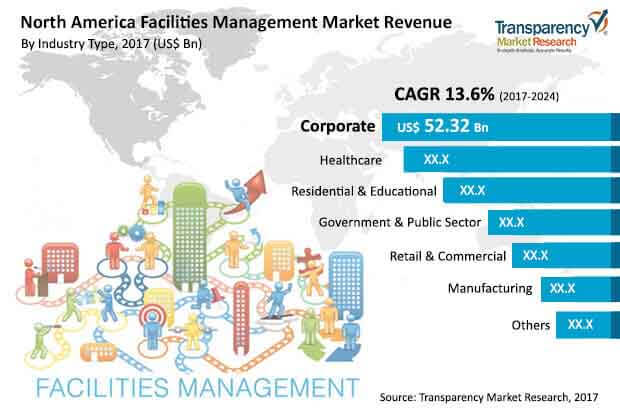
On the flip side, however, nonexistence of standard parameters at global level in order to gauge the performance and quality of services is slowing the growth of facilities management market. Factors such as surging labor costs during the tenure of long-term contracts is leading companies to make short-term or single contracts. This is having a negative influence on the growth of North America facilities management market. Owing to a myriad favorable factors, North America facilities management market is poised to clock a healthy 13.6% CAGR over the forecast period between 2017 and 2024.
Retail and Commercial Industry Segment to Rise at Leading CAGR through 2024
The North America facilities management market is segmented in terms of service type, industry, and country. In terms of service type, the demand for soft services surpasses that of hard services. Of the various soft service segments, cleaning and pest control holds prominence in North America facilities management market. Within cleaning and pest control segment, sterilization sub-segment is most lucrative and is anticipated to account for 4.5% market share by 2024.
The hard service type segment, on the other hand, is predicted to rise at a higher growth rate between 2017 and 2024. The increasing adoption of outsourcing of hard services across industry verticals to enhance the performance of core business activities are accelerating the growth of hard services segment. Within hard services, the mechanical and electrical sub-segment is likely to account for significant revenue contribution to the overall market.
Depending upon industry, corporate, healthcare, government and public sector, manufacturing, residential and educational, retail and commercial, and others are the segments into which the North America facilities management market is divided. Out of these, corporate sector currently holds the leading share in the North America facilities management market; the segment is anticipated to remain attractive through 2024. Retail and commercial industry segment, on the other hand, is anticipated to rise at the leading CAGR through 2024. This is mainly because of increasing outsourcing of non-core business activities such as cleaning, security, repair, and maintenance.
Adoption across Various Industry Verticals Boosts U.S. Market
The key countries into which the North America facilities management market is bifurcated are the U.S, Canada, and Mexico. Among them, the U.S. accounts for leading revenue to the North America facilities management market; the segment is anticipated to be worth US$339.89 bn by the end of 2024. The monumental demand for outsourced services that helps increase productivity in the corporate, manufacturing, retail, and commercial sectors are boosting the adoption of facility management services in the U.S.
Canada is the second-leading domestic market for facilities management in North America. The estimated revenue of Canada facilities management market is likely to be worth US$222.12 bn by 2024-end. The growth of this domestic market is mainly because of increasing adoption of technical maintenance and cleaning services predominantly in business sector.
Some companies in the North America facilities management market are Bilfinger HSG GmbH, ISS World Services A/S, Sodexo Inc., Compass Group plc, Cofely GDF SUEZ, Cresa, GDI Integrated Facility Services, Ecolab USA Inc., G4S plc, and Mitie Group plc.
1. Preface
1.1. Market Definition and Scope
1.2. Market Segmentation
1.3. Key Research Objectives
1.4. Research Highlights
2. Assumptions and Research Methodology
3. Executive Summary: North America Facilities Management Market
4. Market Overview
4.1. Introduction
4.1.1. Product Definition
4.1.2. Industry Evolution / Developments
4.2. Key Market Indicators
4.2.1. Key Deals/ Agreements
4.2.2. Outsourced and In-house Services Analysis
4.2.3. Integrated and Singular Services Analysis
4.3. Market Dynamics
4.3.1. Drivers
4.3.2. Restraints
4.3.3. Opportunity
4.4. North America Facilities Management Market Analysis
4.4.1. Market Revenue Projections (US$ Bn), 2014 – 2024
4.5. Porter’s Five Force Analysis
4.6. Market Outlook
5. North America Facilities Management Market Analysis and Forecasts, by Service
5.1. Introduction & Definition
5.2. Key Findings / Developments
5.3. Key Trends
5.4. Market Size (US$ Bn) Forecast by Service
5.4.1. Hard Service, 2014 – 2024 (US$ Bn)
5.4.1.1. Plumbing, Air Conditioning Maintenance
5.4.1.2. Fire Protection Systems
5.4.1.3. Mechanical and Electrical Maintenance
5.4.1.4. Others (Fabric Maintenance, etc.)
5.4.2. Soft Services, 2014 – 2024 (US$ Bn)
5.4.2.1. Cleaning and Pest Control
5.4.2.1.1. Sterilization
5.4.2.2. Laundry
5.4.2.3. Catering
5.4.2.4. Waste Management
5.4.2.5. Security
5.4.2.6. Others (Administrative Services, etc.)
5.5. Service Comparison Matrix
5.6. Market Attractiveness by Service
6. North America Facilities Management Market Analysis and Forecasts, by Industry
6.1. Introduction & Definition
6.2. Key Findings / Developments
6.3. Key Trends
6.4. Market Size (US$ Bn) Forecast by Industry
6.4.1. Corporate, 2014 – 2024 (US$ Bn)
6.4.2. Government and Public Sector, 2014 – 2024 (US$ Bn)
6.4.4. Healthcare, 2014 – 2024 (US$ Bn)
6.4.5. Manufacturing, 2014 – 2024 (US$ Bn)
6.4.6. Residential and Educational Institutes, 2014 – 2024 (US$ Bn)
6.4.7. Retail and Commercial, 2014 – 2024 (US$ Bn)
6.4.8. Others (Sports, Food etc.), 2014 – 2024 (US$ Bn)
6.5. Industry Comparison Matrix
6.6. Market Attractiveness by Industry
7. North America Facilities Management Market Analysis and Forecasts, by Region
7.1. Key Findings
7.2. Market Size (US$ Bn) Forecast by Country
7.2.1. The U.S.
7.2.2. Canada
7.2.3. Mexico
7.3. Market Attractiveness by Country
8. The U.S. Facilities Management Market Analysis and Forecasts, by Service
8.1. Introduction & Definition
8.2. Key Findings / Developments
8.3. Key Trends
8.4. Market Size (US$ Bn) Forecast by Service
8.4.1. Hard Service, 2014 – 2024 (US$ Bn)
8.4.1.1. Plumbing, Air Conditioning Maintenance
8.4.1.2. Fire Protection Systems
8.4.1.3. Mechanical and Electrical Maintenance
8.4.1.4. Others (Fabric Maintenance, etc.)
8.4.2. Soft Services, 2014 – 2024 (US$ Bn)
8.4.2.1. Cleaning and Pest Control
8.4.2.1.1. Sterilization
8.4.2.2. Laundry
8.4.2.3. Catering
8.4.2.4. Waste Management
8.4.2.5. Security
8.4.2.6. Others (Administrative Services, etc.)
8.5. Market Size (US$ Bn) Forecast by Industry
8.5.1. Corporate, 2014 – 2024 (US$ Bn)
8.5.2. Government and Public Sector, 2014 – 2024 (US$ Bn)
8.5.4. Healthcare, 2014 – 2024 (US$ Bn)
8.5.5. Manufacturing, 2014 – 2024 (US$ Bn)
8.5.6. Residential and Educational Institutes, 2014 – 2024 (US$ Bn)
8.5.7. Retail and Commercial, 2014 – 2024 (US$ Bn)
8.5.8. Others (Sports, Food etc.), 2014 – 2024 (US$ Bn)
8.6. Market Attractiveness
8.6.1. By Industry
8.6.2. By Services
9. Canada Facilities Management Market Analysis and Forecasts
9.1. Introduction & Definition
9.2. Key Findings / Developments
9.3. Key Trends
9.4. Market Size (US$ Bn) Forecast by Service
9.4.1. Hard Service, 2014 – 2024 (US$ Bn)
9.4.1.1. Plumbing, Air Conditioning Maintenance
9.4.1.2. Fire Protection Systems
9.4.1.3. Mechanical and Electrical Maintenance
9.4.1.4. Others (Fabric Maintenance, etc.)
9.4.2. Soft Services, 2014 – 2024 (US$ Bn)
9.4.2.1. Cleaning and Pest Control
9.4.2.1.1. Sterilization
9.4.2.2. Laundry
9.4.2.3. Catering
9.4.2.4. Waste Management
9.4.2.5. Security
9.4.2.6. Others (Administrative Services, etc.)
9.5. Market Size (US$ Bn) Forecast by Industry
9.5.1. Corporate, 2014 – 2024 (US$ Bn)
9.5.2. Government and Public Sector, 2014 – 2024 (US$ Bn)
9.5.4. Healthcare, 2014 – 2024 (US$ Bn)
9.5.5. Manufacturing, 2014 – 2024 (US$ Bn)
9.5.6. Residential and Educational Institutes, 2014 – 2024 (US$ Bn)
9.5.7. Retail and Commercial, 2014 – 2024 (US$ Bn)
9.5.8. Others (Sports, Food etc.), 2014 – 2024 (US$ Bn)
9.6. Market Attractiveness
9.6.1. By Industry
9.6.2. By Services
10. Mexico Facilities Management Market Analysis and Forecasts
10.1. Introduction & Definition
10.2. Key Findings / Developments
10.3. Key Trends
10.4. Market Size (US$ Bn) Forecast by Service
10.4.1. Hard Service, 2014 – 2024 (US$ Bn)
10.4.1.1. Plumbing, Air Conditioning Maintenance
10.4.1.2. Fire Protection Systems
10.4.1.3. Mechanical and Electrical Maintenance
10.4.1.4. Others (Fabric Maintenance, etc.)
10.4.2. Soft Services, 2014 – 2024 (US$ Bn)
10.4.2.1. Cleaning and Pest Control
10.4.2.1.1. Sterilization
10.4.2.2. Laundry
10.4.2.3. Catering
10.4.2.4. Waste Management
10.4.2.5. Security
10.4.2.6. Others (Administrative Services, etc.)
10.5. Market Size (US$ Bn) Forecast by Industry
10.5.1. Corporate, 2014 – 2024 (US$ Bn)
10.5.2. Government and Public Sector, 2014 – 2024 (US$ Bn)
10.5.4. Healthcare, 2014 – 2024 (US$ Bn)
10.5.5. Manufacturing, 2014 – 2024 (US$ Bn)
10.5.6. Residential and Educational Institutes, 2014 – 2024 (US$ Bn)
10.5.7. Retail and Commercial, 2014 – 2024 (US$ Bn)
10.5.8. Others (Sports, Food etc.), 2014 – 2024 (US$ Bn)
10.6. Market Attractiveness
10.6.1. By Industry
10.6.2. By Services
11. Competition Landscape
11.1. Market Player – Competition Matrix (By Tier and Size of companies)
11.2. Market Share Analysis by Company -2015
11.3. Company Profiles
11.3.1. Bilfinger HSG Facility Management GmbH
11.3.1.1 Company Details (HQ, Foundation Year, Employee Strength)
11.3.1.2. Market Presence, By Segment
11.3.1.3 Business Strategy
11.3.1.4. Revenue and Operating Profits
11.3.1.5. SWOT Analysis
11.3.2. Cofely
11.3.2.1 Company Details (HQ, Foundation Year, Employee Strength)
11.3.2.2. Market Presence, By Segment
11.3.2.3 Business Strategy
11.3.2.4. Revenue and Operating Profits
11.3.2.5. SWOT Analysis
11.3.3. Compass Group PLC
11.3.3.1 Company Details (HQ, Foundation Year, Employee Strength)
11.3.3.2. Market Presence, By Segment
11.3.3.3 Business Strategy
11.3.3.4. Revenue and Operating Profits
11.3.3.5. SWOT Analysis
11.3.4. Cresa, LLC
11.3.4.1 Company Details (HQ, Foundation Year, Employee Strength)
11.3.4.2. Market Presence, By Segment
11.3.4.3 Business Strategy
11.3.4.4. Revenue and Operating Profits
11.3.4.5. SWOT Analysis
11.3.5. Ecolab USA Inc.
11.3.5.1 Company Details (HQ, Foundation Year, Employee Strength)
11.3.5.2. Market Presence, By Segment
11.3.5.3 Business Strategy
11.3.5.4. Revenue and Operating Profits
11.3.5.5. SWOT Analysis
11.3.6. GDI Integrated Facility Services
11.3.6.1. Company Details (HQ, Foundation Year, Employee Strength)
11.3.6.2. Market Presence, By Segment
11.3.6.3 Business Strategy
11.3.6.4. Revenue and Operating Profits
11.3.6.5. SWOT Analysis
11.3.7. G4S plc.
11.3.7.1 Company Details (HQ, Foundation Year, Employee Strength)
11.3.7.2. Market Presence, By Segment
11.3.7.3 Business Strategy
11.3.7.4. Revenue and Operating Profits
11.3.7.5. SWOT Analysis
11.3.8. ISS World Services A/S
11.3.8.1 Company Details (HQ, Foundation Year, Employee Strength)
11.3.8.2. Market Presence, By Segment
11.3.8.3 Business Strategy
11.3.8.4. Revenue and Operating Profits
11.3.8.5. SWOT Analysis
11.3.9. Mitie Group PLC
11.3.9.1 Company Details (HQ, Foundation Year, Employee Strength)
11.3.9.2. Market Presence, By Segment
11.3.9.3 Business Strategy
11.3.9.4. Revenue and Operating Profits
11.3.9.5. SWOT Analysis
11.3.10. Sodexo, Inc.
11.3.10.1 Company Details (HQ, Foundation Year, Employee Strength)
11.3.10.2. Market Presence, By Segment
11.3.10.3 Business Strategy Strategy
11.3.10.4. Revenue and Operating Profits
11.3.10.5. SWOT Analysis
12. Key Takeaways
List of Tables
Table 1: North America Facilities Management Market Size (US$ Bn) Forecast, by Hard Services, 2014–2024
Table 2: North America Facilities Management Market Size (US$ Bn) Forecast, by Soft Services, 2014–2024
Table 3: North America Facilities Management Market Size (US$ Bn) Forecast, by Industry, 2014 – 2024
Table 4: North America Facilities Management Market Size (US$ Bn) Forecast, by Country, 2014 – 2024
Table 5: The U.S. Facilities Management Market Size (US$ Bn) Forecast, by Services, Hard Services 2014 – 2024
Table 6: The U.S. Facilities Management Market Size (US$ Bn) Forecast, by Services, Soft Services 2014 – 2024
Table 7: The U.S. Facilities Management Market Size (US$ Bn) Forecast, by Industry, 2014–2024
Table 8: Canada Facilities Management Market Size (US$ Bn) Forecast, by Services – Hard Services 2014 – 2024
Table 9: Canada Facilities Management Market Size (US$ Bn) Forecast, by Services, Soft Services 2014 – 2024
Table 10: Canada Facilities Management Market Size (US$ Bn) Forecast, by Industry, 2014 – 2024
Table 11: Mexico Facilities Management Market Size (US$ Bn) Forecast, by Services – Hard Services, 2014 – 2024
Table 12: Mexico Facilities Management Market Size (US$ Bn) Forecast, by Services, Soft Services 2014 – 2024
Table 13: Mexico Facilities Management Market Size (US$ Bn) Forecast, by Industry, 2014 – 2024
List of Figures
Figure 1: North America Facilities Management Market Size (US$ Bn) Forecast, 2014 – 2024
Figure 2: North America Facilities Management Market Y-o-Y Growth (Value %) Forecast, 2014 – 2024
Figure 4: Market Value Share, by Services (%), 2016
Figure 3: Market Value Share, by Industry (%), 2016
Figure 5: North America Opportunity Growth Analysis (US$ Bn), 2014 - 2024
Figure 6: North America Facilities Management Market Value Share Analysis by Services – hard Services, 2016 and 2024 (%)
Figure 7: North America Facilities Management Market Value Share Analysis by Services – Soft Services, 2016 and 2024 (%)
Figure 8: North America Facilities Management Market Revenue and Y-o-Y Growth, by Services – Hard Services, 2014 – 2024, (US$ Bn and Value %)
Figure 9: North America Facilities Management Market Revenue and Y-o-Y Growth, by Services – Soft Services, 2014 – 2024, (US$ Bn and Value %)
Figure 10: North America Market Attractiveness Analysis, by Services, Hard Services
Figure 11: North America Market Attractiveness Analysis, by Services, Soft Services
Figure 12: North America Facilities Management Market Value Share Analysis by Industry, 2016 and 2024
Figure 13: North America Facilities Management Market Size (US$ Bn) Forecast, by Industry - Corporate, 2014 – 2024
Figure 14: North America Facilities Management Market Size (US$ Bn) Forecast, by Industry - Government and Public, 2014 – 2024
Figure 15: North America Facilities Management Market Size (US$ Bn) Forecast, by Industry - Healthcare, 2014 – 2024
Figure 16: North America Facilities Management Market Size (US$ Bn) Forecast, by Industry - Manufacturing, 2014 – 2024
Figure 17: North America Facilities Management Market Size (US$ Bn) Forecast, by Industry - Residential and Educational, 2014 – 2024
Figure 18: North America Facilities Management Market Size (US$ Bn) Forecast, by Industry - Retail and Commercial, 2014 – 2024
Figure 19: North America Facilities Management Market Size (US$ Bn) Forecast, by Industry - Others, 2014 – 2024
Figure 20: North America Facilities Management Market Attractiveness Analysis by Industry
Figure 21: North America Facilities Management Market Value Share Analysis by Country, 2016 and 2024
Figure 22: Market Attractiveness, by Country
Figure 23: The U.S. Facilities Management Market Size (US$ Bn) Forecast, 2014 – 2024
Figure 24: The U.S. Facilities Management Market Y-o-Y Growth (Value %), 2014 – 2024
Figure 25: The U.S. Facilities Management Market Value Share Analysis By Services – Hard Services, 2016 and 2024 (%)
Figure 26: The U.S. Facilities Management Market Value Share Analysis by Services Type – Soft Services, 2016 and 2024 (%)
Figure 27: The U.S. Facilities Management Market Value Share Analysis by Industry, 2016 and 2024
Figure 28: The U.S. Market Attractiveness Analysis, by Services
Figure 29: The U.S. Market Attractiveness Analysis, by Industry
Figure 30: Canada Facilities Management Market Size (US$ Bn) Forecast, 2014 – 2024
Figure 31: Canada Facilities Management Market Y-o-Y Growth (Value %), 2014 – 2024
Figure 32: Canada Facilities Management Market Value Share Analysis by Services – Hard Services, 2016 and 2024 (%)
Figure 33: Canada Facilities Management Market Value Share Analysis by Services – Soft Services, 2016 and 2024 (%)
Figure 34: Canada Facilities Management Market Value Share Analysis by Industry, 2016 and 2024
Figure 35: Canada Market Attractiveness Analysis, by Services
Figure 36: Canada Market Attractiveness Analysis, by Industry
Figure 37: Mexico Facilities Management Market Size (US$ Bn) Forecast, 2014 – 2024
Figure 38: Mexico Facilities Management Market Y-o-Y Growth (Value %), 2014 – 2024
Figure 39: Mexico Facilities Management Market Value Share Analysis by Services – Hard Services, 2016 and 2024 (%)
Figure 40: Mexico Facilities Management Market Value Share Analysis by Services – Soft Services, 2016 and 2024 (%)
Figure 41: Mexico Facilities Management Market Value Share Analysis by Industry, 2016 and 2024
Figure 42: Mexico Market Attractiveness Analysis, by Services
Figure 43: Mexico Market Attractiveness Analysis, by Industry
Figure 44: Facilities Management Market Share Analysis – Global, by Company (2015)
Copyright © Transparency Market Research, Inc. All Rights reserved
Trust Online

North America Facilities Management Market