
Reports
Reports
Global non-destructive testing equipment market was valued at USD 3.21 billion in 2014, growing at a CAGR of 5.8% from 2015 to 2021. Non-destructive testing equipment are used to evaluate or inspect the materials, assemblies or components for discontinuities in characteristics without tearing down the serviceability of the part or system. These tests are often used to determine the physical properties of materials such as ductility, ultimate tensile strength, impact resistance, fatigue strength and fracture toughness. The non-destructive testing is used to ensure product reliability and integrity to control manufacturing processes. In addition, non-destructive testing equipment also lower the cost of production and sustains a uniform quality level. Stringent government safety regulations for quality control, ensure safety and reliable performance of the machines, and increasing demand to improve quality and longevity of the machines are the major factors responsible for growth of global non-destructive testing equipment market globally.
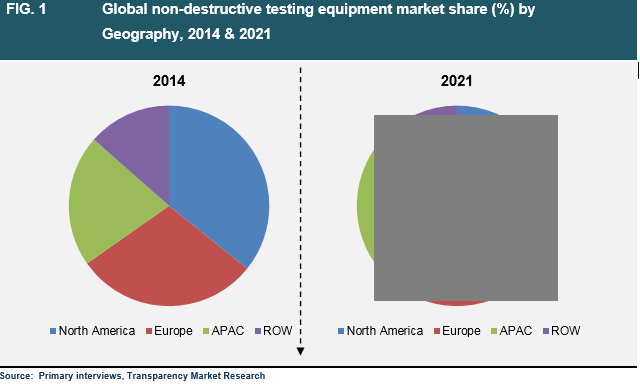
The global non-destructive testing equipment market is segmented by region into North America, Europe, Asia-Pacific (APAC) and Rest of the World (RoW). North America led the global non-destructive testing equipment market in 2014 and is also expected to maintain its dominance in 2021 as well in this market. The growth in North America is primarily attributed due to huge investments in energy verticals such as oil and gas. Europe held the second largest share of the global non-destructive testing equipment market in 2014 followed by Asia Pacific and RoW respectively. Asia Pacific is expected to be the fastest growing regional market for non-destructive testing equipment.
The global non-destructive testing equipment market is segmented on the basis of technology into ultrasonic testing, radiography testing, electromagnetic testing, visual testing and others (including magnetic particle testing and liquid penetrant testing). Ultrasonic testing is holding the maximum market revenue share in 2014. The wide usage of ultrasonic testing in several industries such as steel and aluminum construction, manufacturing, aerospace and defense and automotive sectors are spurring the demand for this segment.
The global non-destructive testing equipment market is further segmented by end use industry into power generation industry, oil & gas industry, aerospace and defense industry, automotive industry and others (including plastic and polymer, and medical). The global non-destructive testing equipment market is majorly dominated by power generation industry due to increasing number of nuclear power plants and the subsequent increasing demand for machines used in power plants. Automotive is expected to be the fastest growing end use industry in non-destructive testing equipment market followed by oil and gas industry.
1. Preface
1.1. Report description
1.2. Research scope
1.3. Research methodology
2. Executive Summary
3. Market Overview
3.1. Introduction
3.2. Key Trend Analysis
3.3. Market Dynamics
3.3.1. Market drivers
3.3.1.1. Stringent government safety regulations for quality control
3.3.1.2. Ensure safety and reliable performance of the machines
3.3.1.3. Increasing demand to improve quality and longevity of the machines
3.3.2. Market Restraints
3.3.2.1. Lack of skilled technicians
3.3.3. Market opportunities
3.3.3.1. Increasing demand for advanced NDT technologies
3.4. Global non-destructive testing equipment market: Market attractiveness analysis
3.5. Global non-destructive testing equipment market: Company market share analysis
4. Global Non-Destructive Testing Equipment Market Analysis, by Technology
4.1. Introduction
4.2. Ultrasonic Testing (UT)
4.2.1. Global ultrasonic testing market size and forecast, 2014-2021 (USD billion)
4.3. Radiography Testing (RT)
4.3.1. Global radiography testing market size and forecast, 2014-2021 (USD billion)
4.4. Electromagnetic Testing (ET)
4.4.1. Global electromagnetic testing market size and forecast, 2014-2021 (USD billion)
4.5. Visual Testing (VT)
4.5.1. Global visual testing market size and forecast, 2014-2021 (USD billion)
4.6. Others
4.6.1. Global others testing market size and forecast, 2014-2021 (USD billion)
5. Global Non-Destructive Testing Equipment Market, by End Use Industry
5.1. Introduction
5.2. Power Generation
5.2.1. Global power generation market size and forecast, 2014-2021 (USD billion)
5.3. Oil and Gas
5.3.1. Global oil and gas market size and forecast, 2014-2021 (USD billion)
5.4. Aerospace and Defense
5.4.1. Global aerospace and defense market size and forecast, 2014-2021 (USD billion)
5.5. Automotive
5.5.1. Global automotive market size and forecast, 2014-2021 (USD billion)
5.6. Others
5.6.1. Global others market size and forecast, 2014-2021 (USD billion)
6. Global Non-Destructive Testing Equipment Market Analysis, by Geography
6.1. Introduction
6.2. North America
6.2.1. North America non-destructive testing equipment market size and forecast, 2014-2021 (USD billion)
6.2.2. North America non-destructive testing equipment market revenue and forecast, by country, 2014-2021 (USD billion)
6.2.3. North America non-destructive testing equipment market size and forecast, by technology, 2014-2021 (USD billion)
6.2.4. North America non-destructive testing equipment market size and forecast, by end use industry, 2014-2021 (USD billion)
6.3. Europe
6.3.1. Europe non-destructive testing equipment market size and forecast, 2014-2021 (USD billion)
6.3.2. Europe non-destructive testing equipment market revenue and forecast, by country, 2014-2021 (USD billion)
6.3.3. Europe non-destructive testing equipment market size and forecast, by technology, 2014-2021 (USD billion)
6.3.4. Europe non-destructive testing equipment market size and forecast, by end use industry, 2014-2021 (USD billion)
6.4. Asia Pacific
6.4.1. Asia Pacific non-destructive testing equipment market size and forecast, 2014-2021 (USD billion)
6.4.2. Asia Pacific non-destructive testing equipment market revenue and forecast, by country, 2014-2021 (USD billion)
6.4.3. Asia Pacific non-destructive testing equipment market size and forecast, by technology, 2014-2021 (USD billion)
6.4.4. Asia Pacific non-destructive testing equipment market size and forecast, by end use industry, 2014-2021 (USD billion)
6.5. Rest of the World (RoW)
6.5.1. RoW non-destructive testing equipment market size and forecast, 2014-2021 (USD billion)
6.5.2. RoW non-destructive testing equipment market revenue and forecast, by country, 2014-2021 (USD billion)
6.5.3. RoW non-destructive testing equipment market size and forecast, by technology, 2014-2021 (USD billion)
6.5.4. RoW non-destructive testing equipment market size and forecast, by end use industry, 2014-2021 (USD billion)
7. Company Profiles
7.1. Olympus Corporation
7.2. Magnaflux Corporation
7.3. YXLON International GmbH
7.4. Nikon Metrology NV
7.5. Mistras Group Inc.
7.6. Zetec Inc.
7.7. Eddyfi NDT Inc.
7.8. GE Measurement & Control Solutions
7.9. Sonatest Ltd.
List of Tables
TABLE 1: Global non-destructive testing equipment market – Snapshot (2014 & 2021)
TABLE 2: Drivers: Impact analysis
TABLE 3: Restraints: Impact analysis
TABLE 4: North America non-destructive testing equipment market revenue and forecast, by country, 2014-2021 (USD billion)
TABLE 5: North America non-destructive testing equipment market size and forecast, by technology, 2014-2021 (USD billion)
TABLE 6: North America non-destructive testing equipment market size and forecast, by end use industry, 2014-2021 (USD billion)
TABLE 7: Europe non-destructive testing equipment market revenue and forecast, by country, 2014-2021 (USD billion)
TABLE 8: Europe non-destructive testing equipment market size and forecast, by technology, 2014-2021 (USD billion)
TABLE 9: Europe non-destructive testing equipment market size and forecast, by end use industry, 2014-2021 (USD billion)
TABLE 10: Asia Pacific non-destructive testing equipment market revenue and forecast, by country, 2014-2021 (USD billion)
TABLE 11: Asia Pacific non-destructive testing equipment market size and forecast, by technology, 2014-2021 (USD billion)
TABLE 12: Asia Pacific non-destructive testing equipment market size and forecast, by end use industry, 2014-2021 (USD billion)
TABLE 13: RoW non-destructive testing equipment market revenue and forecast, by country, 2014-2021 (USD billion)
TABLE 14: RoW non-destructive testing equipment market size and forecast, by technology, 2014-2021 (USD billion)
TABLE 15: RoW non-destructive testing equipment market size and forecast, by end use industry, 2014-2021 (USD billion)
List of Figures
FIG. 1: Market segmentation: Global non-destructive testing equipment market
FIG. 2: Market attractiveness analysis, by end use industry, 2014
FIG. 3: Market share by key non-destructive testing equipment vendors, 2014 (Value %)
FIG. 4: Global non-destructive testing equipment market share (%), by technology, 2014 Vs. 2021
FIG. 5: Global ultrasonic testing market size and forecast, 2014-2021 (USD billion)
FIG. 6: Global radiography testing market size and forecast, 2014-2021 (USD billion)
FIG. 7: Global electromagnetic testing market size and forecast, 2014-2021 (USD billion)
FIG. 8: Global visual testing market size and forecast, 2014-2021 (USD billion)
FIG. 9: Global others testing market size and forecast, 2014-2021 (USD billion)
FIG. 10: Global non-destructive testing equipment market share (%), by end use industry, 2014 Vs. 2021
FIG. 11: Global power generation market size and forecast, 2014-2021 (USD billion)
FIG. 12: Global oil and gas market size and forecast, 2014-2021 (USD billion)
FIG. 13: Global aerospace and defense market size and forecast, 2014-2021 (USD billion)
FIG. 14: Global automotive market size and forecast, 2014-2021 (USD billion)
FIG. 15: Global others market size and forecast, 2014-2021 (USD billion)
FIG. 16: Global non-destructive testing equipment market share (%) by geography, 2014 Vs. 2021
FIG. 17: North America non-destructive testing equipment market size and forecast, 2014-2021 (USD billion)
FIG. 18: Europe non-destructive testing equipment market size and forecast, 2014-2021 (USD billion)
FIG. 19: Asia Pacific non-destructive testing equipment market size and forecast, 2014-2021 (USD billion)
FIG. 20: RoW non-destructive testing equipment market size and forecast, 2014-2021 (USD billion)
Copyright © Transparency Market Research, Inc. All Rights reserved
Trust Online

Non-Destructive Testing Equipment Market