
Reports
Reports
Mobile Money Market: A Snapshot
The mobile money market is a vast fragmented landscape with several regional, and international players playing a key role in shaping its growth. The rising advancements in technology, and lack of uniform standards in the industry continues to drive growth for new players in payment modes, and provides a wide array of opportunities in a wide range of payment options. Despite its fragmented nature, some key players in the mobile money market including: Bango.net Limited, Boku, Inc., Dwolla, Inc., Fortumo OÜ, Judo Payments, Paypal, Inc. (PayPal Holdings, Inc.), Square, Inc., Stripe, and WePay, Inc. continue to engage in innovation and acquisitions to drive growth. The rising opportunities in established sectors like hospitality and tourism, BFSI, Telecommunication, and media and entertainment presents lucrative opportunities for growth for new entrants. Barriers to entry, and potential risks to disruptions remain really high in the market.
According to TMR experts, the mobile money market will register significant growth during 2016-2024, rising at 22% CAGR. The market reached a valuation of US$17.25 bn in 2016, and its growth remains one of the most promising for new entrants.
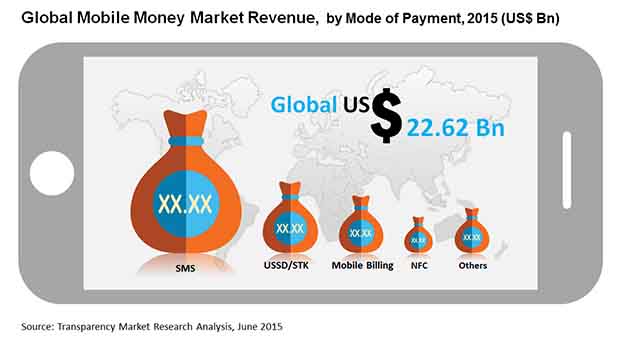
SMS Payment Remains Most Promising Segment in Growth
The global money market report will feature various segments including SMS payment, NFC, mobile billing, USSD, among others. Among these, the SMS segment is expected to witness largest expansion due to growing preference of millenials to prefer non-human interaction over direct human ones. The trend is apparent in various other industries including customer service, where non-human help modules like IVR, online troubleshooting forms, and chatbots continue to replace human interactions. The SMS service is also expected to make major headways as it remains most cost-effective, and reliable over availing third-party platforms for businesses. The growth of SMS segments will drive incredible growth for mobile money market in near future.
Payment and Money Transfer to Remain in Dominant Position
Payments and money transfer made serious gateway in the market as online transfers provided a convenient option for people to interconnect, and reduce dependence on physical means of banking. The segment remains promising, however airtime transfers, and top-ups are expected to top the charts during the forecast period as growth for these is witnessing growth at the highest CAGR. Among end-sectors, the healthcare sector is expected to lead growth, however, hospitality, and BFSI, and energy also show promising prospects in near future. Increasing initiatives by governments around the world to digitalize energy consumption to drive energy efficiency, and increased use of sustainable energy promises new opportunities for growth for players in the mobile money market. Recently, UK ordered digitalization of all existing meters in the country, which is expected to up digital linking with mobile wallets in near future.
Asia Pacific and North America to Dominate Growth in Mobile Money Market
Segments like SMS payments are already witnessing a major growth in regions like Asia Pacific. The trend is extremely popular, and continues to make huge headways for enterprises. Additionally, the segment is also expected to witness major growth in North America region. The larges-scale commercial operation in the US, and promising penetration of platforms like PayPal prohibits growth of the growth new channels in North America. However, thanks to large demand in banking, telecommunication, and especially healthcare, the market will witness dominant emergence of North America region during the forecast period.
Table of Contents
1. Preface
1.1. Research Scope
1.2. Market Segmentation
1.3. Research Methodology
2. Executive Summary
2.1. Global Mobile Money Market Snapshot
2.2. Global Mobile Money Market Revenue, 2014-2024 (US$ Bn) and Year-on-Year Growth (%)
3. Global Mobile Money Market Analysis, 2014-2024 (US$ Bn)
3.1. Overview
3.2. Market Dynamics
3.2.1. Drivers
3.2.2. Restraints
3.2.3. Opportunities
3.3. Key Trend Analysis
3.4. Global Mobile Money Market Analysis, By Mode of Payment, 2014-2024 (US$ Bn)
3.4.1. NFC
3.4.2. Mobile Billing
3.4.3. SMS
3.4.4. USSD/STK
3.4.5. Others
3.5. Global Mobile Money Market Analysis, By Types of Purchase, 2014-2024 (US$ Bn)
3.5.1. Airtime Transfers & Top-ups
3.5.2. Money Transfers & Payments
3.5.3. Merchandise and Coupons
3.5.4. Travel and Ticketing
3.5.5. Others
3.6. Global Mobile Money Market Analysis, By Industry Vertical, 2014-2024 (US$ Bn)
3.6.1. Banking, Financial Services and Insurance (BFSI) Sector
3.6.2. Energy & Utilities Sector
3.6.3. Retail Sector
3.6.4. Health Care Sector
3.6.5. Hospitality & Tourism Sector
3.6.6. Media and Entertainment Sector
3.6.7. Supply Chain Management (SCM) & Logistics Sector
3.6.8. Telecommunication & IT Sector
3.6.9. Others
3.7. Competitive Landscape
3.7.1. Market Positioning of Key Players, 2015
3.7.2. Competitive Strategies Adopted by Leading Players
4. North America Mobile Money Market Analysis, 2014-2024 (US$ Bn)
4.1. Overview
4.2. North America Mobile Money Market Revenue, 2014-2024 (US$ Bn) and Y-o-Y Growth (%)
4.3. North America Mobile Money Market Analysis, By Mode of Payment, 2014-2024 (US$ Bn)
4.3.1. NFC
4.3.2. Mobile Billing
4.3.3. SMS
4.3.4. USSD/STK
4.3.5. Others
4.4. North America Mobile Money Market Analysis, By Types of Purchase, 2014-2024 (US$ Bn)
4.4.1. Airtime Transfers & Top-ups
4.4.2. Money Transfers & Payments
4.4.3. Merchandise and Coupons
4.4.4. Travel and Ticketing
4.4.5. Others
4.5. North America Mobile Money Market Analysis, By Industry Vertical, 2014-2024 (US$ Bn)
4.5.1. Banking, Financial Services and Insurance (BFSI) Sector
4.5.2. Energy & Utilities Sector
4.5.3. Retail Sector
4.5.4. Health Care Sector
4.5.5. Hospitality & Tourism Sector
4.5.6. Media and Entertainment Sector
4.5.7. Supply Chain Management (SCM) & Logistics Sector
4.5.8. Telecommunication & IT Sector
4.5.9. Others
5. Europe Mobile Money Market Analysis, 2014-2024 (US$ Bn)
5.1. Overview
5.2. Europe Mobile Money Market Revenue, 2014-2024 (US$ Bn) and Y-o-Y Growth (%)
5.3. Europe Mobile Money Market Analysis, By Mode of Payment, 2014-2024 (US$ Bn)
5.3.1. NFC
5.3.2. Mobile Billing
5.3.3. SMS
5.3.4. USSD/STK
5.3.5. Others
5.4. Europe Mobile Money Market Analysis, By Types of Purchase, 2014-2024 (US$ Bn)
5.4.1. Airtime Transfers & Top-ups
5.4.2. Money Transfers & Payments
5.4.3. Merchandise and Coupons
5.4.4. Travel and Ticketing
5.4.5. Others
5.5. Europe Mobile Money Market Analysis, By Industry Vertical, 2014-2024 (US$ Bn)
5.5.1. Banking, Financial Services and Insurance (BFSI) Sector
5.5.2. Energy & Utilities Sector
5.5.3. Retail Sector
5.5.4. Health Care Sector
5.5.5. Hospitality & Tourism Sector
5.5.6. Media and Entertainment Sector
5.5.7. Supply Chain Management (SCM) & Logistics Sector
5.5.8. Telecommunication & IT Sector
5.5.9. Others
6. Asia Pacific (APAC) Mobile Money Market Analysis, 2014-2024 (US$ Bn)
6.1. Overview
6.2. Asia Pacific Mobile Money Market Revenue, 2014-2024 (US$ Bn) and Y-o-Y Growth (%)
6.3. APAC Mobile Money Market Analysis, By Mode of Payment, 2014-2024 (US$ Bn)
6.3.1. NFC
6.3.2. Mobile Billing
6.3.3. SMS
6.3.4. USSD/STK
6.3.5. Others
6.4. APAC Mobile Money Market Analysis, By Types of Purchase, 2014-2024 (US$ Bn)
6.4.1. Airtime Transfers & Top-ups
6.4.2. Money Transfers & Payments
6.4.3. Merchandise and Coupons
6.4.4. Travel and Ticketing
6.4.5. Others
6.5. APAC Mobile Money Market Analysis, By Industry Vertical, 2014-2024 (US$ Bn)
6.5.1. Banking, Financial Services and Insurance (BFSI) Sector
6.5.2. Energy & Utilities Sector
6.5.3. Retail Sector
6.5.4. Health Care Sector
6.5.5. Hospitality & Tourism Sector
6.5.6. Media and Entertainment Sector
6.5.7. Supply Chain Management (SCM) & Logistics Sector
6.5.8. Telecommunication & IT Sector
6.5.9. Others
7. Middle East and Africa (MEA) Mobile Money Market Analysis, 2014-2024 (US$ Bn)
7.1. Overview
7.2. MEA Mobile Money Market Revenue, 2014-2024 (US$ Bn) and Y-o-Y Growth (%)
7.3. MEA Mobile Money Market Analysis, By Mode of Payment, 2014-2024 (US$ Bn)
7.3.1. NFC
7.3.2. Mobile Billing
7.3.3. SMS
7.3.4. USSD/STK
7.3.5. Others
7.4. MEA Mobile Money Market Analysis, By Types of Purchase, 2014-2024 (US$ Bn)
7.4.1. Airtime Transfers & Top-ups
7.4.2. Money Transfers & Payments
7.4.3. Merchandise and Coupons
7.4.4. Travel and Ticketing
7.4.5. Others
7.5. MEA Mobile Money Market Analysis, By Industry Vertical, 2014-2024 (US$ Bn)
7.5.1. Banking, Financial Services and Insurance (BFSI) Sector
7.5.2. Energy & Utilities Sector
7.5.3. Retail Sector
7.5.4. Health Care Sector
7.5.5. Hospitality & Tourism Sector
7.5.6. Media and Entertainment Sector
7.5.7. Supply Chain Management (SCM) & Logistics Sector
7.5.8. Telecommunication & IT Sector
7.5.9. Others
8. Latin America Mobile Money Market Analysis, 2014-2024 (US$ Bn)
8.1. Overview
8.2. Latin America Mobile Money Market Revenue, 2014-2024 (US$ Bn) and Y-o-Y Growth (%)
8.3. Latin America Mobile Money Market Analysis, By Mode of Payment, 2014-2024 (US$ Bn)
8.3.1. NFC
8.3.2. Mobile Billing
8.3.3. SMS
8.3.4. USSD/STK
8.3.5. Others
8.4. Latin America Mobile Money Market Analysis, By Types of Purchase, 2014-2024 (US$ Bn)
8.4.1. Airtime Transfers & Top-ups
8.4.2. Money Transfers & Payments
8.4.3. Merchandise and Coupons
8.4.4. Travel and Ticketing
8.4.5. Others
8.5. Latin America Mobile Money Market Analysis, By Industry Vertical, 2014-2024 (US$ Bn)
8.5.1. Banking, Financial Services and Insurance (BFSI) Sector
8.5.2. Energy & Utilities Sector
8.5.3. Retail Sector
8.5.4. Health Care Sector
8.5.5. Hospitality & Tourism Sector
8.5.6. Media and Entertainment Sector
8.5.7. Supply Chain Management (SCM) & Logistics Sector
8.5.8. Telecommunication & IT Sector
8.5.9. Others
9. Global Mobile Money Market Analysis, Country Snippets (US$ Bn)
9.1. The U.S.
9.2. Canada
9.3. The U.K.
9.4. Germany
9.5. France
9.6. Australia
9.7. China
9.8. Japan
9.9. India
9.10. Indonesia
9.11. UAE
9.12. Saudi Arabia
9.13. South Africa
9.14. Brazil
10. Company Profiles
10.1. Bango.net Limited
10.1.1. Company Details (HQ, Foundation Year, Employee Strength)
10.1.2. Market Presence, By Segment and Geography
10.1.3. Key Developments
10.1.4. Strategy and Historical Roadmap
10.1.5. Revenue and Volume and Operating Profits
10.2. Boku, Inc.
10.2.1. Company Details (HQ, Foundation Year, Employee Strength)
10.2.2. Market Presence, By Segment and Geography
10.2.3. Key Developments
10.2.4. Strategy and Historical Roadmap
10.2.5. Revenue and Volume and Operating Profits
10.3. Dwolla, Inc.
10.3.1. Company Details (HQ, Foundation Year, Employee Strength)
10.3.2. Market Presence, By Segment and Geography
10.3.3. Key Developments
10.3.4. Strategy and Historical Roadmap
10.3.5. Revenue and Volume and Operating Profits
10.4. Fortumo OÜ
10.4.1. Company Details (HQ, Foundation Year, Employee Strength)
10.4.2. Market Presence, By Segment and Geography
10.4.3. Key Developments
10.4.4. Strategy and Historical Roadmap
10.4.5. Revenue and Volume and Operating Profits
10.5. Judo Payments
10.5.1. Company Details (HQ, Foundation Year, Employee Strength)
10.5.2. Market Presence, By Segment and Geography
10.5.3. Key Developments
10.5.4. Strategy and Historical Roadmap
10.5.5. Revenue and Volume and Operating Profits
10.6. Paypal, Inc. (PayPal Holdings, Inc.)
10.6.1. Company Details (HQ, Foundation Year, Employee Strength)
10.6.2. Market Presence, By Segment and Geography
10.6.3. Key Developments
10.6.4. Strategy and Historical Roadmap
10.6.5. Revenue and Volume and Operating Profits
10.7. Square, Inc.
10.7.1. Company Details (HQ, Foundation Year, Employee Strength)
10.7.2. Market Presence, By Segment and Geography
10.7.3. Key Developments
10.7.4. Strategy and Historical Roadmap
10.7.5. Revenue and Volume and Operating Profits
10.8. Stripe
10.8.1. Company Details (HQ, Foundation Year, Employee Strength)
10.8.2. Market Presence, By Segment and Geography
10.8.3. Key Developments
10.8.4. Strategy and Historical Roadmap
10.8.5. Revenue and Volume and Operating Profits
10.9. WePay, Inc.
10.9.1. Company Details (HQ, Foundation Year, Employee Strength)
10.9.2. Market Presence, By Segment and Geography
10.9.3. Key Developments
10.9.4. Strategy and Historical Roadmap
10.9.5. Revenue and Volume and Operating Profits
List of Tables
Table 1: Global Mobile Money Market Snapshot
Table 2: Global Mobile Money Market Size and Forecast, By Mode of Payment, 2014-2024 (US$ Bn)
Table 3: Global Mobile Money Market Size and Forecast, By Types of Purchase, 2014-2024 (US$ Bn)
Table 4: Global Mobile Money Market Size and Forecast, By Industry Vertical, 2014-2024 (US$ Bn)
Table 5: North America Mobile Money Market Size and Forecast, By Mode of Payment, 2014-2024 (US$ Bn)
Table 6: North America Mobile Money Market Size and Forecast, By Types of Purchase, 2014-2024 (US$ Bn)
Table 7: North America Mobile Money Market Size and Forecast, By Industry Vertical, 2014-2024 (US$ Bn)
Table 8: Europe Mobile Money Market Size and Forecast, By Mode of Payment, 2014-2024 (US$ Bn)
Table 9: Europe Mobile Money Market Size and Forecast, By Types of Purchase, 2014-2024 (US$ Bn)
Table 10: Europe Mobile Money Market Size and Forecast, By Industry Vertical, 2014-2024 (US$ Bn)
Table 11: APAC Mobile Money Market Size and Forecast, By Mode of Payment, 2014-2024 (US$ Bn)
Table 12: APAC Mobile Money Market Size and Forecast, By Types of Purchase, 2014-2024 (US$ Bn)
Table 13: APAC Mobile Money Market Size and Forecast, By Industry Vertical, 2014-2024 (US$ Bn)
Table 14: MEA Mobile Money Market Size and Forecast, By Mode of Payment, 2014-2024 (US$ Bn)
Table 15: MEA Mobile Money Market Size and Forecast, By Types of Purchase, 2014-2024 (US$ Bn)
Table 16: MEA Mobile Money Market Size and Forecast, By Industry Vertical, 2014-2024 (US$ Bn)
Table 17: Latin America Mobile Money Market Size and Forecast, By Mode of Payment, 2014-2024 (US$ Bn)
Table 18: Latin America Mobile Money Market Size and Forecast, By Types of Purchase, 2014-2024 (US$ Bn)
Table 19: Latin America Mobile Money Market Size and Forecast, By Industry Vertical, 2014-2024 (US$ Bn)
Table 20: Country Snippets Mobile Money Market, 2014-2024 (US$ Bn)
List of Figures
Figure 1: Global Mobile Money Market Revenue, 2014-2024 (US$ Bn) and Year-on-Year Growth (%)
Figure 2: Automate Decision Making Processes (Channel & Performance)
Figure 3: Regulatory Agencies and Industry Bodies
Figure 4: Global Mobile Money Market, By Mode of Payment, 2015 and 2024 (%)
Figure 5: Global Mobile Money Market, By Types of Purchase, 2015 and 2024 (%)
Figure 6: Global Mobile Money Market, By Industry Vertical, 2015 and 2024 (%)
Figure 7: Market positioning of key players, 2015
Figure 8: Market Share, 2015
Figure 9: North America Mobile Money Market Revenue, 2014-2024 (US$ Bn) and Y-o-Y Growth (%)
Figure 10: North America Mobile Money Market, By Mode of Payment, 2015 and 2024 (%)
Figure 11: North America Mobile Money Market, By Types of Purchase, 2015 and 2024 (%)
Figure 12: North America Mobile Money Market, By Industry Vertical, 2015 and 2024 (%)
Figure 13: Europe Mobile Money Market Revenue, 2014-2024 (US$ Bn) and Y-o-Y Growth (%)
Figure 14: Europe Mobile Money Market, By Mode of Payment, 2015 and 2024 (%)
Figure 15: Europe Mobile Money Market, By Types of Purchase, 2015 and 2024 (%)
Figure 16: Europe Mobile Money Market, By Industry Vertical, 2015 and 2024 (%)
Figure 17: APAC Mobile Money Market Revenue, 2014-2024 (US$ Bn) and Y-o-Y Growth (%)
Figure 18: APAC Mobile Money Market, By Mode of Payment, 2015 and 2024 (%)
Figure 19: APAC Mobile Money Market, By Types of Purchase, 2015 and 2024 (%)
Figure 20: APAC Mobile Money Market, By Industry Vertical, 2015 and 2024 (%)
Figure 21: MEA Mobile Money Market Revenue, 2014-2024 (US$ Bn) and Y-o-Y Growth (%)
Figure 22: MEA Mobile Money Market, By Mode of Payment, 2015 and 2024 (%)
Figure 23: MEA Mobile Money Market, By Types of Purchase, 2015 and 2024 (%)
Figure 24: MEA Mobile Money Market, By Industry Vertical, 2015 and 2024 (%)
Figure 25: Latin America Mobile Money Market Revenue, 2014-2024 (US$ Bn) and Y-o-Y Growth (%)
Figure 26: Latin America Mobile Money Market, By Mode of Payment, 2015 and 2024 (%)
Figure 27: Latin America Mobile Money Market, By Types of Purchase, 2015 and 2024 (%)
Figure 28: Latin America Mobile Money Market, By Industry Vertical, 2015 and 2024 (%)
Copyright © Transparency Market Research, Inc. All Rights reserved
Trust Online

Mobile Money Market Share, Insights 2024