
Reports
Reports
The drive for next-gen networks in various end-use industries underscores the growing market potential of compute and resources that can transform real-time enterprises. The mobile edge computing (MEC) market encompasses a framework of IT service environment and advanced cloud computing capabilities wherein data is processed closer to the end user. The demand for networks with low latency, localized data, and advanced IoT is driving the market prospects for mobile edge computing. MEC has been instrumental in improving the quality of experience (QoE), especially in the entertainment, manufacturing, and transportation industries.
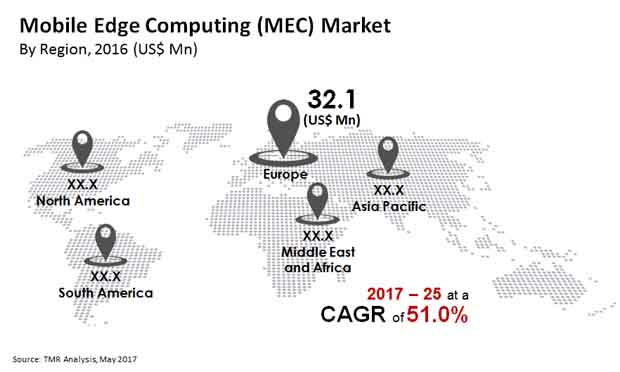
The mobile edge computing (MEC) market is projected to advance at a substantial CAGR of 51.0% during the forecast period from 2017 to 2025. The revenue is projected to expand from its valuation of US$73.8 mn in 2016 to reach US$ 4228.3 mn by 2025.
Broadly, the report segments the mobile edge computing (MEC) market based on component, technology, and industry vertical. Based on software, the segments are video analytics, location services, IoT, data caching, and connected vehicles. The key industry verticals for assessing the opportunities in the global market are media & entertainment, retail, healthcare, IT & telecom, and the BFSI.
Mobile edge computing hardware mainly comprises servers, processors, and switches & routers. The requirements of MEC hardware are varied in different end-use industries, and hence determines the hardware that will fit best in different end-use cases. Overall, the demand for hardware is massive. The hardware segment held the major global share of 80.0% in 2016, and is projected to contribute sizable opportunities in the mobile edge computing (MEC) market.
Players in recent years are actively developing mobile edge computing architecture that can be integrated with the coming 5G infrastructure. The players in the mobile edge computing market are expected to garner revenue gains from the widespread demand in autonomous driving systems and data centers.
In particular, the rise in application of computational storage drives and high-capacity computational storage devices (CSDs) in mobile edge computing is projected to spur sales in MEC hardware. Some of the key players engaged in innovation in hardware are Intel, HP, NGD Systems, and Dell EMC.
Rapidly penetration of cloud computing in industrial and enterprise applications has made a massive bearing on the avenues in the mobile edge computing (MEC) market. Over the years, mobile cloud gaming has gathered steam among gamers and have created a new business opportunity for players in the mobile edge computing (MEC) industry. Service providers are partnering with cloud providers to capture sizable revenue streams in the next-gen of edge-cloud ecosystem. The ecosystem is stridently supported by players ramping up their investments in 5G infrastructure.
The mobile edge computing (MEC) market is projected to witness incredible avenues in the continuously expanding IoT potential to support the use cases of cloud. Key end-use industries that will generate revenues are defense, aerospace, oil and gas, cybersecurity, and manufacturing.
Of the various key regions in the market, Europe held the major share amounting to 43.5% in 2016. The rapid uptake of IoT technologies in various industrial and enterprise applications has propelled abundant revenue potential for players in the region. During the forecast period, the Europe mobile edge computing (MEC) market is projected to garner CAGR of 42.8% during the forecast period.
Proliferating number of mobile subscribers and the rapid penetration of IoT use cases in various industries are expected to accelerate growth prospects for the Asia Pacific mobile edge computing (MEC) market. South America, and the Middle East and Africa (MEA) are expected to be promising regional markets in the near future. Emerging economies are expected to be hotbed of opportunities in these regions. A key trend is the growing adoption of distributed cloud infrastructure.
Some of the key players in the mobile edge computing (MEC) market are SpiderCloud Wireless, Inc., ZTE Corporation, Vasona Networks, Inc., Saguna Networks Ltd., ADLINK Technology Inc., Juniper Networks, Inc., Intel Corporation, PeerApp Ltd., Nokia Corporation, Integrated Device Technology, Inc., Huawei Technologies Co., Ltd., and IBM.
1.Preface
2.Assumptions and Research Methodology
3.Executive Summary : Mobile Edge Computing Market
4.Market Overview
4.1.Introduction
4.1.1.Product Definition
4.1.2.Industry Evolution / Developments
4.2.Market Dynamics
4.2.1.Drivers
4.2.2.Restraints
4.2.3.Opportunity
4.3.Key Trends
4.4.Porter's Five Forces Analysis – Mobile Edge Computing Market
4.5.Value Chain Analysis
4.6.Market Overview
4.7.Market Outlook
5.Global Mobile Edge Computing Market Analysis and Forecast, By Component Type
5.1.Introduction
5.2.Key findings
5.3.Market Size Forecast, By Component Type, 2015-2025 (US$ Mn)
5.3.1.Hardware
5.3.2.Software
5.3.2.1.Video Analytics
5.3.2.2.Location Services
5.3.2.3.Internet of Things (IoT)
5.3.2.4.Data Caching
5.3.2.5.Connected Vehicles
5.3.2.6.Others
5.3.3.Service
5.3.3.1.Consulting
5.3.3.2.System Integration
5.3.3.3.Maintenance
5.4.Component Type Comparison Matrix
5.5.Market Attractiveness By Component Type
6.Global Mobile Edge Computing Market Analysis and Forecast, By Industry Vertical
6.1.Introduction
6.2.Key findings
6.3.Market Size Forecast, By Industry vertical, 2015-2025 (US$ Mn)
6.3.1.Media & Entertainment
6.3.2.Retail
6.3.3.IT & Telecom
6.3.4.Healthcare
6.3.5.BFSI
6.3.6.Others (Manufacturing & Education)
6.4.Industry vertical Comparison Matrix
6.5.Market Attractiveness By Industry vertical
7.Global Mobile Edge Computing Market Analysis and Forecast, By Technology
7.1.Introduction
7.2.Key findings
7.3.Market Size Forecast, By Technology, 2015-2025 (US$ Mn)
7.3.1.4G
7.3.2.5G
7.3.3.Wi-Max
7.4.Technology Comparison Matrix
7.5.Market Attractiveness By Technology
8.Global Mobile Edge Computing Market Analysis and Forecast, By Region
8.1.Introduction
8.2.Key findings
8.3.Market Size Forecast, By Region, 2015-2025 (US$ Mn)
8.3.1.North America
8.3.2.Europe
8.3.3.Asia Pacific
8.3.4.Middle East & Africa (MEA)
8.3.5.South America
8.4.Market Attractiveness By Region
9.North America Mobile Edge Computing Market Analysis and Forecast
9.1.Key Findings
9.2.Market Size Forecast, By Component Type, 2015-2025 (US$ Mn)
9.2.1.Hardware
9.2.2.Software
9.2.2.1.Video Analytics
9.2.2.2.Location Services
9.2.2.3.Internet of Things (IoT)
9.2.2.4.Data Caching
9.2.2.5.Connected Vehicles
9.2.2.6.Others
9.2.3.Service
9.2.3.1.Consulting
9.2.3.2.System Integration
9.2.3.3.Maintenance
9.3.Market Size Forecast, By Industry vertical, 2015-2025 (US$ Mn)
9.3.1.Media & Entertainment
9.3.2.Retail
9.3.3.IT & Telecom
9.3.4.Healthcare
9.3.5.BFSI
9.3.6.Others (Manufacturing & Education)
9.4.Market Size Forecast, By Technology, 2015-2025 (US$ Mn)
9.4.1.4G
9.4.2.5G
9.4.3.Wi-Max
9.5.Market Size Forecast, By Country, 2015-2025 (US$ Mn)
9.5.1.The US
9.5.2.Canada
9.5.3.Rest of North America
9.6.Market Attractiveness Analysis
9.6.1.By Component
9.6.2.By Industry Vertical
9.6.3.By Technology
9.6.4.By Country
10.Europe Mobile Edge Computing Market Analysis and Forecast
10.1.Key Findings
10.2.Market Size Forecast, By Component Type, 2015-2025 (US$ Mn)
10.2.1.Hardware
10.2.2.Software
10.2.2.1.Video Analytics
10.2.2.2.Location Services
10.2.2.3.Internet of Things (IoT)
10.2.2.4.Data Caching
10.2.2.5.Connected Vehicles
10.2.2.6.Others
10.2.3.Service
10.2.3.1.Consulting
10.2.3.2.System Integration
10.2.3.3.Maintenance
10.3.Market Size Forecast, By Industry vertical, 2015-2025 (US$ Mn)
10.3.1.Media & Entertainment
10.3.2.Retail
10.3.3.IT & Telecom
10.3.4.Healthcare
10.3.5.BFSI
10.3.6.Others (Manufacturing & Education)
10.4.Market Size Forecast, By Technology, 2015-2025 (US$ Mn)
10.4.1.4G
10.4.2.5G
10.4.3.Wi-Max
10.5.Market Size Forecast, By Country, 2015-2025 (US$ Mn)
10.5.1.The UK
10.5.2.Germany
10.5.3.France
10.5.4.Rest of Europe
10.6.Market Attractiveness Analysis
10.6.1.By Component
10.6.2.By Industry Vertical
10.6.3.By Technology
10.6.4.By Country
11.Asia Pacific Mobile Edge Computing Market Analysis and Forecast
11.1.Key Findings
11.2.Market Size Forecast, By Component Type, 2015-2025 (US$ Mn)
11.2.1.Hardware
11.2.2.Software
11.2.2.1.Video Analytics
11.2.2.2.Location Services
11.2.2.3.Internet of Things (IoT)
11.2.2.4.Data Caching
11.2.2.5.Connected Vehicles
11.2.2.6.Others
11.2.3.Service
11.2.3.1.Consulting
11.2.3.2.System Integration
11.2.3.3.Maintenance
11.3.Market Size Forecast, By Industry vertical, 2015-2025 (US$ Mn)
11.3.1.Media & Entertainment
11.3.2.Retail
11.3.3.IT & Telecom
11.3.4.Healthcare
11.3.5.BFSI
11.3.6.Others (Manufacturing & Education)
11.4.Market Size Forecast, By Technology, 2015-2025 (US$ Mn)
11.4.1.4G
11.4.2.5G
11.4.3.Wi-Max
11.5.Market Size Forecast, By Country, 2015-2025 (US$ Mn)
11.5.1.China
11.5.2.Japan
11.5.3.South Korea
11.5.4.Rest of Asia Pacific
11.6.Market Attractiveness Analysis
11.6.1.By Component
11.6.2.By Industry Vertical
11.6.3.By Technology
11.6.4.By Country
12.MEA Mobile Edge Computing Market Analysis and Forecast
12.1.Key Findings
12.2.Market Size Forecast, By Component Type, 2015-2025 (US$ Mn)
12.2.1.Hardware
12.2.2.Software
12.2.2.1.Video Analytics
12.2.2.2.Location Services
12.2.2.3.Internet of Things (IoT)
12.2.2.4.Data Caching
12.2.2.5.Connected Vehicles
12.2.2.6.Others
12.2.3.Service
12.2.3.1.Consulting
12.2.3.2.System Integration
12.2.3.3.Maintenance
12.3.Market Size Forecast, By Industry vertical, 2015-2025 (US$ Mn)
12.3.1.Media & Entertainment
12.3.2.Retail
12.3.3.IT & Telecom
12.3.4.Healthcare
12.3.5.BFSI
12.3.6.Others (Manufacturing & Education)
12.4.Market Size Forecast, By Technology, 2015-2025 (US$ Mn)
12.4.1.4G
12.4.2.5G
12.4.3.Wi-Max
12.5.Market Size Forecast, By Country, 2015-2025 (US$ Mn)
12.5.1.GCC
12.5.2.South Africa
12.5.3.Rest of Middle East & Africa
12.6.Market Attractiveness Analysis
12.6.1.By Component
12.6.2.By Industry Vertical
12.6.3.By Technology
12.6.4.By Country
13.South America Mobile Edge Computing Market Analysis and Forecast
13.1.Key Findings
13.2.Market Size Forecast, By Component Type, 2015-2025 (US$ Mn)
13.2.1.Hardware
13.2.2.Software
13.2.2.1.Video Analytics
13.2.2.2.Location Services
13.2.2.3.Internet of Things (IoT)
13.2.2.4.Data Caching
13.2.2.5.Connected Vehicles
13.2.2.6.Others
13.2.3.Service
13.2.3.1.Consulting
13.2.3.2.System Integration
13.2.3.3.Maintenance
13.3.Market Size Forecast, By Industry vertical, 2015-2025 (US$ Mn)
13.3.1.Media & Entertainment
13.3.2.Retail
13.3.3.IT & Telecom
13.3.4.Healthcare
13.3.5.BFSI
13.3.6.Others (Manufacturing & Education)
13.4.Market Size Forecast, By Technology, 2015-2025 (US$ Mn)
13.4.1.4G
13.4.2.5G
13.4.3.Wi-Max
13.5.Market Size Forecast, By Country, 2015-2025 (US$ Mn)
13.5.1.Brazil
13.5.2.Rest of South America
13.6.Market Attractiveness Analysis
13.6.1.By Component
13.6.2.By Industry Vertical
13.6.3.By Technology
13.6.4.By Country
14.Competition Landscape
14.1.Market Player – Competition Matrix (By Tier and Size of companies)
14.2.Global Market Positioning Analysis, by Company (2016)
14.3.Company Profiles (Details – Overview, Financials, Recent Developments, Strategy)
14.3.1.ADLINK Technology, Inc.
14.3.1.1.Company Overview
14.3.1.2.Company Description
14.3.1.3.Financial Overview
14.3.1.4.SWOT Analysis
14.3.1.5.Strategy Overview
14.3.2.Huawei Technologies Co., Ltd.
14.3.2.1.Company Overview
14.3.2.2.Company Description
14.3.2.3.Financial Overview
14.3.2.4.SWOT Analysis
14.3.2.5.Strategy Overview
14.3.3.IBM Corporation
14.3.3.1.Company Overview
14.3.3.2.Company Description
14.3.3.3.Financial Overview
14.3.3.4.SWOT Analysis
14.3.3.5.Strategy Overview
14.3.4.Integrated Device Technology, Inc.
14.3.4.1.Company Overview
14.3.4.2.Company Description
14.3.4.3.Financial Overview
14.3.4.4.SWOT Analysis
14.3.4.5.Strategy Overview
14.3.5.Intel Corporation
14.3.5.1.Company Overview
14.3.5.2.Company Description
14.3.5.3.Financial Overview
14.3.5.4.SWOT Analysis
14.3.5.5.Strategy Overview
14.3.6.Juniper Networks, Inc.
14.3.6.1.Company Overview
14.3.6.2.Company Description
14.3.6.3.Financial Overview
14.3.6.4.SWOT Analysis
14.3.6.5.Strategy Overview
14.3.7.Nokia Corporation
14.3.7.1.Company Overview
14.3.7.2.Company Description
14.3.7.3.Financial Overview
14.3.7.4.SWOT Analysis
14.3.7.5.Strategy Overview
14.3.8.PeerApp, Inc.
14.3.8.1.Company Overview
14.3.8.2.Company Description
14.3.8.3.Financial Overview
14.3.8.4.SWOT Analysis
14.3.8.5.Strategy Overview
14.3.9.Saguna Networks Ltd.
14.3.9.1.Company Overview
14.3.9.2.Company Description
14.3.9.3.Financial Overview
14.3.9.4.SWOT Analysis
14.3.9.5.Strategy Overview
14.3.10.SpiderCloud Wireless, Inc.
14.3.10.1.Company Overview
14.3.10.2.Company Description
14.3.10.3.Financial Overview
14.3.10.4.SWOT Analysis
14.3.10.5.Strategy Overview
14.3.11.Vasona Networks
14.3.11.1.Company Overview
14.3.11.2.Company Description
14.3.11.3.Financial Overview
14.3.11.4.SWOT Analysis
14.3.11.5.Strategy Overview
14.3.12.ZTE Corporation
14.3.12.1.Company Overview
14.3.12.2.Company Description
14.3.12.3.Financial Overview
14.3.12.4.SWOT Analysis
14.3.12.5.Strategy Overview
15.Key Take Away
List of Table
Table 1 : Global Mobile Edge Computing Market Size (US$ Mn) Forecast, By Component, 2015 – 2025
Table 2 : Global Mobile Edge Computing Market Size (US$ Mn) Forecast, By Software Component, 2015 – 2025
Table 3 : Global Mobile Edge Computing Market Size (US$ Mn) Forecast, By Service Component, 2015 – 2025
Table 4 : Global Mobile Edge Computing Market Size (US$ Mn) Forecast, By Industry Vertical, 2015 – 2025
Table 5 : Global Mobile Edge Computing Market Size (US$ Mn) Forecast, By Technology, 2015 – 2025
Table 6 : Global Mobile Edge Computing Market Size (US$ Mn) Forecast, By Region, 2015 – 2025
Table 7 : North America Mobile Edge Computing Market Size (US$ Mn) Forecast, By Component, 2015 – 2025
Table 8 : North America Mobile Edge Computing Market Size (US$ Mn) Forecast, By Software Component, 2015 – 2025
Table 9 : North America Mobile Edge Computing Market Size (US$ Mn) Forecast, By Service Component, 2015 – 2025
Table 10 : North America Mobile Edge Computing Market Size (US$ Mn) Forecast, By Industry Vertical, 2015 – 2025
Table 11 : North America Mobile Edge Computing Market Size (US$ Mn) Forecast, By Technology, 2015 – 2025
Table 12 : North America Mobile Edge Computing Market Size (US$ Mn) Forecast, By Country, 2015 – 2025
Table 13 : Europe Mobile Edge Computing Market Size (US$ Mn) Forecast, By Component, 2015 – 2025
Table 14 : Europe Mobile Edge Computing Market Size (US$ Mn) Forecast, By Software Component, 2015 – 2025
Table 15 : Europe Mobile Edge Computing Market Size (US$ Mn) Forecast, By Service Component, 2015 – 2025
Table 16 : Europe Mobile Edge Computing Market Size (US$ Mn) Forecast, By Industry Vertical, 2015 – 2025
Table 17 : Europe Mobile Edge Computing Market Size (US$ Mn) Forecast, By Technology, 2015 – 2025
Table 18 : Europe Mobile Edge Computing Market Size (US$ Mn) Forecast, By Country, 2015 – 2025
Table 19 : Asia Pacific Mobile Edge Computing Market Size (US$ Mn) Forecast, By Component, 2015 – 2025
Table 20 : Asia Pacific Mobile Edge Computing Market Size (US$ Mn) Forecast, By Software Component, 2015 – 2025
Table 21 : Asia Pacific Mobile Edge Computing Market Size (US$ Mn) Forecast, By Service Component, 2015 – 2025
Table 22 : Asia Pacific Mobile Edge Computing Market Size (US$ Mn) Forecast, By Industry Vertical, 2015 – 2025
Table 23 : Asia Pacific Mobile Edge Computing Market Size (US$ Mn) Forecast, By Technology, 2015 – 2025
Table 24 : Asia Pacific Mobile Edge Computing Market Size (US$ Mn) Forecast, By Country, 2015 – 2025
Table 25 : MEA Mobile Edge Computing Market Size (US$ Mn) Forecast, By Component, 2015 – 2025
Table 26 : MEA Mobile Edge Computing Market Size (US$ Mn) Forecast, By Software Component, 2015 – 2025
Table 27 : MEA Mobile Edge Computing Market Size (US$ Mn) Forecast, By Service Component, 2015 – 2025
Table 28 : MEA Mobile Edge Computing Market Size (US$ Mn) Forecast, By Industry Vertical, 2015 – 2025
Table 29 : MEA Mobile Edge Computing Market Size (US$ Mn) Forecast, By Technology, 2015 – 2025
Table 30 : MEA Mobile Edge Computing Market Size (US$ Mn) Forecast, By Country, 2015 – 2025
Table 31 : South America Mobile Edge Computing Market Size (US$ Mn) Forecast, By Component, 2015 – 2025
Table 32 : South America Mobile Edge Computing Market Size (US$ Mn) Forecast, By Software Component, 2015 – 2025
Table 33 : South America Mobile Edge Computing Market Size (US$ Mn) Forecast, By Service Component, 2015 – 2025
Table 34 : South America Mobile Edge Computing Market Size (US$ Mn) Forecast, By Industry Vertical, 2015 – 2025
Table 35 : South America Mobile Edge Computing Market Size (US$ Mn) Forecast, By Technology, 2015 – 2025
Table 36 : South America Mobile Edge Computing Market Size (US$ Mn) Forecast, By Country, 2015 – 2025
List of Figures
Figure 1 : Porter Five Forces Analysis
Figure 2 : Value Chain Analysis
Figure 3 : Global Mobile Edge Computing Market Revenue (US$ Mn) and Y-o-Y Forecast, 2017 – 2025
Figure 4: Market Value Share (Revenue) By Component (2016)
Figure 5: Market Value Share (Revenue) By Software (2016)
Figure 6: Market Value Share (Revenue) By End-use Application (2016)
Figure 7: Market Value (Revenue) Share By Technology (2016)
Figure 8 : Global Mobile Edge Computing Market Value Share Analysis, By Component, 2017 and 2025
Figure 9 : Mobile Edge Computing Market, By Component, Hardware
Figure 10 : Mobile Edge Computing Market, By Component, Software
Figure 11 : Mobile Edge Computing Market, By Component, Service
Figure 12 : Global Mobile Edge Computing Market Value Share Analysis, By Software Component, 2017 and 2025
Figure 13 : Global Mobile Edge Computing Market Value Share Analysis, By Service Component, 2017 and 2025
Figure 14 : Mobile Edge Computing Market Comparison Matrix, By Component
Figure 15 : Mobile Edge Computing Market Attractiveness Analysis, By Component
Figure 16 : Global Mobile Edge Computing Market Value Share Analysis, By Industry Vertical, 2017 and 2025
Figure 17 : Mobile Edge Computing Market, By Industry Vertical, Media & Entertainment
Figure 18 : Mobile Edge Computing Market, By Industry Vertical, Retail
Figure 19 : Mobile Edge Computing Market, By Industry Vertical, IT & Telecom
Figure 20 : Mobile Edge Computing Market, By Industry Vertical, Healthcare
Figure 21 : Mobile Edge Computing Market, By Industry Vertical, BFSI
Figure 22 : Mobile Edge Computing Market, By Industry Vertical, Others (Manufacturing and Education)
Figure 23 : Mobile Edge Computing Market Comparison Matrix, By Industry Vertical
Figure 24 : Mobile Edge Computing Market Attractiveness Analysis, By Industry Vertical
Figure 25 : Global Mobile Edge Computing Market Value Share Analysis, By Technology, 2017 and 2025
Figure 26 : Mobile Edge Computing Market, By Technology, 4G
Figure 27 : Mobile Edge Computing Market, By Technology, 5G
Figure 28 : Mobile Edge Computing Market, By Technology, Wi-Max
Figure 29 : Mobile Edge Computing Market Comparison Matrix, By Technology
Figure 30 : Mobile Edge Computing Market Attractiveness Analysis, By Technology
Figure 31 : Mobile Edge Computing Market Analysis, By Region, North America
Figure 32 : Mobile Edge Computing Market Analysis, By Region, Europe
Figure 33 : Mobile Edge Computing Market Analysis, By Region, Asia Pacific
Figure 34 : Mobile Edge Computing Market Analysis, By Region, Middle East and Africa
Figure 35 : Mobile Edge Computing Market Analysis, By Region, South America
Figure 36 : Mobile Edge Computing Market Attractiveness Analysis, By Region
Figure 37 : North America Mobile Edge Computing Market Revenue (US$ Mn) and Y-o-Y Forecast, 2017 – 2025
Figure 38 : North America Mobile Edge Computing Market Value Share Analysis, By Component, 2017 and 2025
Figure 39 : North America Mobile Edge Computing Market Value Share Analysis, By Software Component, 2017 and 2025
Figure 40 : North America Mobile Edge Computing Market Value Share Analysis, By Service Component, 2017 and 2025
Figure 41 : North America Mobile Edge Computing Market Value Share Analysis, By Industry Vertical, 2017 and 2025
Figure 42 : North America Mobile Edge Computing Market Value Share Analysis, By Technology, 2017 and 2025
Figure 43 : North America Mobile Edge Computing Market Value Share Analysis, By Country, 2017 and 2025
Figure 44 : North America Mobile Edge Computing Market Attractiveness Analysis, By Component
Figure 45 : North America Mobile Edge Computing Market Attractiveness Analysis, By Industry Vertical
Figure 46 : North America Mobile Edge Computing Market Attractiveness Analysis, By Country
Figure 47 : North America Mobile Edge Computing Market Attractiveness Analysis, By Technology
Figure 48 : Europe Mobile Edge Computing Market Revenue (US$ Mn) and Y-o-Y Forecast, 2017 – 2025
Figure 49 : Europe Mobile Edge Computing Market Value Share Analysis, By Component, 2017 and 2025
Figure 50 : Europe Mobile Edge Computing Market Value Share Analysis, By Software Component, 2017 and 2025
Figure 51 : Europe Mobile Edge Computing Market Value Share Analysis, By Service Component, 2017 and 2025
Figure 52 : Europe Mobile Edge Computing Market Value Share Analysis, By Industry Vertical, 2017 and 2025
Figure 53 : Europe Mobile Edge Computing Market Value Share Analysis, By Technology, 2017 and 2025
Figure 54 : Europe Mobile Edge Computing Market Value Share Analysis, By Country, 2017 and 2025
Figure 55 : Europe Mobile Edge Computing Market Attractiveness Analysis, By Component
Figure 56 : Europe Mobile Edge Computing Market Attractiveness Analysis, By Industry Vertical
Figure 57 : Europe Mobile Edge Computing Market Attractiveness Analysis, By Country
Figure 58 : Europe Mobile Edge Computing Market Attractiveness Analysis, By Technology
Figure 59 : Asia Pacific Mobile Edge Computing Market Revenue (US$ Mn) and Y-o-Y Forecast, 2017 – 2025
Figure 60 : Asia Pacific Mobile Edge Computing Market Value Share Analysis, By Component, 2017 and 2025
Figure 61 : Asia Pacific Mobile Edge Computing Market Value Share Analysis, By Software Component, 2017 and 2025
Figure 62 : Asia Pacific Mobile Edge Computing Market Value Share Analysis, By Service Component, 2017 and 2025
Figure 63 : Asia Pacific Mobile Edge Computing Market Value Share Analysis, By Industry Vertical, 2017 and 2025
Figure 64 : Asia Pacific Mobile Edge Computing Market Value Share Analysis, By Technology, 2017 and 2025
Figure 65 : Asia Pacific Mobile Edge Computing Market Value Share Analysis, By Country, 2017 and 2025
Figure 66 : Asia Pacific Mobile Edge Computing Market Attractiveness Analysis, By Component
Figure 67 : Asia Pacific Mobile Edge Computing Market Attractiveness Analysis, By Industry Vertical
Figure 68 : Asia Pacific Mobile Edge Computing Market Attractiveness Analysis, By Country
Figure 69 : Asia Pacific Mobile Edge Computing Market Attractiveness Analysis, By Technology
Figure 70 : MEA Mobile Edge Computing Market Revenue (US$ Mn) and Y-o-Y Forecast, 2017 – 2025
Figure 71 : MEA Mobile Edge Computing Market Value Share Analysis, By Component, 2018 and 2025
Figure 72 : MEA Mobile Edge Computing Market Value Share Analysis, By Software Component, 2018 and 2025
Figure 73 : MEA Mobile Edge Computing Market Value Share Analysis, By Service Component, 2018 and 2025
Figure 74 : MEA Mobile Edge Computing Market Value Share Analysis, By Industry Vertical, 2018 and 2025
Figure 75 : MEA Mobile Edge Computing Market Value Share Analysis, By Technology, 2018 and 2025
Figure 76 : MEA Mobile Edge Computing Market Value Share Analysis, By Country, 2018 and 2025
Figure 77 : MEA Mobile Edge Computing Market Attractiveness Analysis, By Component
Figure 78 : MEA Mobile Edge Computing Market Attractiveness Analysis, By Industry Vertical
Figure 79 : MEA Mobile Edge Computing Market Attractiveness Analysis, By Country
Figure 80 : MEA Mobile Edge Computing Market Attractiveness Analysis, By Technology
Figure 81 : South America Mobile Edge Computing Market Revenue (US$ Mn) and Y-o-Y Forecast, 2017 – 2025
Figure 82 : South America Mobile Edge Computing Market Value Share Analysis, By Component, 2019 and 2025
Figure 83 : South America Mobile Edge Computing Market Value Share Analysis, By Software Component, 2019 and 2025
Figure 84 : South America Mobile Edge Computing Market Value Share Analysis, By Service Component, 2019 and 2025
Figure 85 : South America Mobile Edge Computing Market Value Share Analysis, By Industry Vertical, 2019 and 2025
Figure 86 : South America Mobile Edge Computing Market Value Share Analysis, By Technology, 2019 and 2025
Figure 87 : South America Mobile Edge Computing Market Value Share Analysis, By Country, 2019 and 2025
Figure 88 : South America Mobile Edge Computing Market Attractiveness Analysis, By Component
Figure 89 : South America Mobile Edge Computing Market Attractiveness Analysis, By Industry Vertical
Figure 90 : South America Mobile Edge Computing Market Attractiveness Analysis, By Country
Figure 91 : South America Mobile Edge Computing Market Attractiveness Analysis, By Technology
Figure 92 : Market Positioning Analysis
Copyright © Transparency Market Research, Inc. All Rights reserved
Trust Online

Mobile Edge Computing (MEC) Market