
Reports
Reports
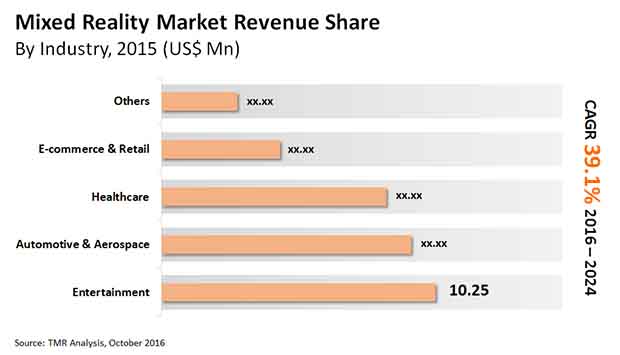
Mixed reality is a blend of the virtual and real world. Further, it provides an innovative atmosphere and visualizations where the digital and physical worlds are in sync with each other. Mixed reality is adopted in sectors such as automotive and aerospace, healthcare, entertainment, e-commerce, and reality. The application of mixed reality in various industrial sectors has propelled the growth of the mixed reality market. TMR study projects the mixed reality market to record a CAGR of 39.1% market during the forecast period of 2016-2024.
Transparency Market Research has conducted exhaustive research on various factors associated with the growth of the mixed reality market. The researchers at Transparency Market Research have analyzed the mixed reality market through expert-guided approaches and techniques. Recent developments in the mixed reality market, regional aspects, competitive insights, and restraints have been monitored closely by researchers. The outcomes have been systematically included in the report for the stakeholders to understand the present situation of the mixed reality market. The COVID-19 pandemic has changed the growth equations of many industries and sectors in different ways. The growth projections of the mixed reality market have also been affected due to the pandemic. Hence, to enlighten the stakeholder about the changes, the COVID-19 impact on the mixed reality market has been covered in the report.
Tech giants such as Meta, Microsoft, Apple, and Google have recently launched novel software services coupled with new hardware products. The “metaverse” hardware and software have unique features which allow the users to integrate the real and virtual world in real-time. Additionally, it is user-friendly and can be accessed through a smartphone. The tech giants are investing in mixed reality technologies due to the projected growth aspects of the mixed reality market during the forecast period of 2016-2024. Venture capitalists are investing a huge amount in virtual world startups owing to the rapid growth trajectory of the mixed reality market. Big Giants like Meta are flogging the new technologies developed in mixed reality through major advertising campaigns. Further, the company has announced the release of another reality headset that will be integrated with hardware that supports mixed reality technologies. Additionally, Meta has launched a virtual social platform named Horizon Worlds on Facebook. All these recent developments have proved to be growth boosters for the mixed reality market.
Mixed reality technology is combined with augmented and virtual reality to provide an ultimate virtual atmosphere to the users. This technology is gaining popularity in end-use industries namely, e-commerce, entertainment, navigation, architecture, education, automobile, travel, and healthcare. Various automotive companies across the globe are adopting mixed reality technology for their advertising campaign to increase their sales. In addition, mixed reality technology is used in interior designing and architecture sectors for improving the efficiency of the process. Thus, the mixed reality market has registered a substantial growth trajectory.
The growing trend among the consumers to experience and feel the products for an enhanced shopping experience has led to the use of mixed reality in the e-commerce industry. Thus, the retailers are adopting the use of mixed reality to advertise and market their products. The rising use of mixed reality technology in the entertainment sector for video games sports and gaming has projected growth for the mixed reality market. Also, healthcare and other sectors have experienced substantial growth in the mixed reality market.
Based on regions, the global mixed reality market is segmented into Asia Pacific, Europe, North America, and the rest of the world. North America is projected to maintain its market position and record a CAGR of 41.9% during the forecast period of 2016-2024. The factors that have contributed toward the growth of the mixed reality market in North America are the rising graphic companies and the presence of a huge entertainment industry. Furthermore, the inclination towards the production of 3D movies in the region has expected the growth of the mixed reality market in the forthcoming years.
The market players are indulging in mergers, acquisitions, joint ventures, and partnerships. These activities assist in increasing the influence of the players in the mixed reality market. All these factors ultimately contribute to the growth of the mixed reality market.
Some of the well-established players operating in the mixed reality market are HTC Corporation, Microsoft Corporation, Meta Company, Magic Leap, Daqri LLC., and others.
1. Preface
1.1. Market Definition and Scope
1.2. Market Segmentation
1.3. Key Research Objectives
1.4. Research Highlights
2. Assumptions and Research Methodology
3. Executive Summary : Global Mixed Reality Market
4. Market Overview
4.1. Introduction
4.1.1. Product Definition
4.1.2. Industry Evolution / Developments
4.2. Market Overview
4.3. Key Market Indicators
4.3.1. Entertainment and Multimedia Market
4.4. Market Dynamics
4.4.1. Drivers
4.4.2. Restraints
4.4.3. Opportunity
4.5. Global Mixed Reality Market Analysis and Forecasts, 2014 – 2024
4.5.1. Market Revenue Projections (US$ Mn)
4.6. Market Outlook: Product Lifecycle
5. Global Mixed Reality Market Analysis and Forecasts, By Component
5.1. Introduction & Definition
5.2. Key Findings
5.3. Key Trends
5.4. Market Size (US$ Mn) Forecast By Component, 2014 – 2024
5.4.1. Software
5.4.2. Hardware
5.5. Market Attractiveness By Component
6. Global Mixed Reality Market Analysis and Forecasts, By Application
6.1. Introduction & Definition
6.2. Key Findings
6.3. Key Trends
6.4. Market Size (US$ Mn) Forecast By Application, 2014 – 2024
6.4.1. Automotive & Aerospace
6.4.2. Healthcare
6.4.3. Entertainment
6.4.4. E-commerce & Retail
6.4.5. Others
6.5. Market Attractiveness By Application
7. Global Mixed Reality Market Analysis and Forecasts, By Region
7.1. Key Findings
7.2. Market Size (US$ Mn) Forecast By Region, 2014 – 2024
7.2.1. North America
7.2.2. Europe
7.2.3. Asia Pacific
7.2.4. Middle East and Africa
7.2.5. South America
7.3. Market Attractiveness By Country/Region
8. North America Mixed Reality Market Analysis and Forecast
8.1. Key Findings
8.2. Key Trends
8.3. Market Size (US$ Mn) Forecast By Component, 2014 – 2024
8.3.1. Software
8.3.2. Hardware
8.4. Market Size (US$ Mn) Forecast By Application, 2014 – 2024
8.4.1. Automotive & Aerospace
8.4.2. Healthcare
8.4.3. Entertainment
8.4.4. E-commerce & Retail
8.4.5. Others
8.5. Market Size (US$ Mn) Forecast By Country, 2014 – 2024
8.5.1. United States
8.5.2. Canada
8.5.3. Rest of North America
8.6. Market Attractiveness Analysis
8.6.1. By Component
8.6.2. By Application
8.6.3. By Country
9. Europe Mixed Reality Market Analysis and Forecast
9.1. Key Findings
9.2. Key Trends
9.3. Market Size (US$ Mn) Forecast By Component, 2014 – 2024
9.3.1. Software
9.3.2. Hardware
9.4. Market Size (US$ Mn) Forecast By Application, 2014 – 2024
9.4.1. Automotive & Aerospace
9.4.2. Healthcare
9.4.3. Entertainment
9.4.4. E-commerce & Retail
9.4.5. Others
9.5. Market Size (US$ Mn) Forecast By Country, 2014 – 2024
9.5.1. France
9.5.2. United Kingdom
9.5.3. Russia
9.5.4. Rest of Europe
9.6. Market Attractiveness Analysis
9.6.1. By Component
9.6.2. By Application
9.6.3. By Country
10. Asia Pacific Mixed Reality Market Analysis and Forecast
10.1. Key Findings
10.2. Key Trends
10.3. Market Size (US$ Mn) Forecast By Component, 2014 – 2024
10.3.1. Software
10.3.2. Hardware
10.4. Market Size (US$ Mn) Forecast By Application, 2014 – 2024
10.4.1. Automotive & Aerospace
10.4.2. Healthcare
10.4.3. Entertainment
10.4.4. E-commerce & Retail
10.4.5. Others
10.5. Market Size (US$ Mn) Forecast By Country, 2014 – 2024
10.5.1. China
10.5.2. Japan
10.5.3. India
10.5.4. Australia
10.5.5. Rest of APAC
10.6. Market Attractiveness Analysis
10.6.1. By Component
10.6.2. By Application
10.6.3. By Country
11. Middle East And Africa Mixed Reality Market Analysis and Forecast
11.1. Key Findings
11.2. Key Trends
11.3. Market Size (US$ Mn) Forecast By Component, 2014 – 2024
11.3.1. Software
11.3.2. Hardware
11.4. Market Size (US$ Mn) Forecast By Application, 2014 – 2024
11.4.1. Automotive & Aerospace
11.4.2. Healthcare
11.4.3. Entertainment
11.4.4. E-commerce & Retail
11.4.5. Others
11.5. Market Size (US$ Mn) Forecast By Country, 2014 – 2024
11.5.1. UAE
11.5.2. Saudi Arabia
11.5.3. Rest of Middle East and Africa
11.6. Market Attractiveness Analysis
11.6.1. By Component
11.6.2. By Application
11.6.3. By Country
12. South America Mixed Reality Market Analysis and Forecast
12.1. Key Findings
12.2. Key Trends
12.3. Market Size (US$ Mn) Forecast By Component, 2014 – 2024
12.3.1. Software
12.3.2. Hardware
12.4. Market Size (US$ Mn) Forecast By Application, 2014 – 2024
12.4.1. Automotive & Aerospace
12.4.2. Healthcare
12.4.3. Entertainment
12.4.4. E-commerce & Retail
12.4.5. Others
12.5. Market Size (US$ Mn) Forecast By Country, 2014 – 2024
12.5.1. Brazil
12.5.2. Argentina
12.5.3. Rest of South America
12.6. Market Attractiveness Analysis
12.6.1. By Component
12.6.2. By Application
12.6.3. By Country
13. Competition Landscape
13.1. Market Player – Competition Matrix (By Tier and Size of companies)
13.2. Market Share Analysis By Company (2015)
13.3. Company Profiles
13.3.1 Facebook Inc.
13.3.1.1 Company Details (HQ, Foundation Year, Employee Strength)
13.3.1.2 Market Presence, By Segment
13.3.1.3 Strategy
13.3.1.4 Revenue and Operating Profits
13.3.1.5 SWOT Analysis
13.3.2 Samsung Electronics Co, Ltd.
13.3.2.1 Company Details (HQ, Foundation Year, Employee Strength)
13.3.2.2 Market Presence, By Segment
13.3.2.3 Strategy
13.3.2.4 Revenue and Operating Profits
13.3.2.5 SWOT Analysis
13.3.3 HTC Corporation
13.3.3.1 Company Details (HQ, Foundation Year, Employee Strength)
13.3.3.2 Market Presence, By Segment
13.3.3.3 Strategy
13.3.3.4 Revenue and Operating Profits
13.3.3.5 SWOT Analysis
13.3.4 Seiko Epson Corporation.
13.3.4.1 Company Details (HQ, Foundation Year, Employee Strength)
13.3.4.2 Market Presence, By Segment
13.3.4.3 Strategy
13.3.4.4 Revenue and Operating Profits
13.3.4.5 SWOT Analysis
13.3.5 Recon Instruments, Inc.
13.3.5.1 Company Details (HQ, Foundation Year, Employee Strength)
13.3.5.2 Market Presence, By Segment
13.3.5.3 Strategy
13.3.5.4 Revenue and Operating Profits
13.3.5.5 SWOT Analysis
13.3.6 Microsoft Corporation
13.3.6.1 Company Details (HQ, Foundation Year, Employee Strength)
13.3.6.2 Market Presence, By Segment
13.3.6.3 Strategy
13.3.6.4 Revenue and Operating Profits
13.3.6.5 SWOT Analysis
13.3.7 Daqri LLC.
13.3.7.1 Company Details (HQ, Foundation Year, Employee Strength)
13.3.7.2 Market Presence, By Segment
13.3.7.3 Strategy
13.3.7.4 Revenue and Operating Profits
13.3.7.5 SWOT Analysis
13.3.8 Canon Inc.
13.3.8.1 Company Details (HQ, Foundation Year, Employee Strength)
13.3.8.2 Market Presence, By Segment
13.3.8.3 Strategy
13.3.8.4 Revenue and Operating Profits
13.3.8.5 SWOT Analysis
13.3.9 Magic Leap, Inc.
13.3.9.1 Company Details (HQ, Foundation Year, Employee Strength)
13.3.9.2 Market Presence, By Segment
13.3.9.3 Strategy
13.3.9.4 Revenue and Operating Profits
13.3.9.5 SWOT Analysis
13.3.10 Meta Company
13.3.10.1 Company Details (HQ, Foundation Year, Employee Strength)
13.3.10.2 Market Presence, By Segment
13.3.10.3 Strategy
13.3.10.4 Revenue and Operating Profits
13.3.10.5 SWOT Analysis
13.3.11 Osterhout Design Group
13.3.11.1 Company Details (HQ, Foundation Year, Employee Strength)
13.3.11.2 Market Presence, By Segment
13.3.11.3 Strategy
13.3.11.4 Revenue and Operating Profits
13.3.11.5 SWOT Analysis
13.3.12 Infinity Augmented Reality, Inc.
13.3.12.1 Company Details (HQ, Foundation Year, Employee Strength)
13.3.12.2 Market Presence, By Segment
13.3.12.3 Strategy
13.3.12.4 Revenue and Operating Profits
13.3.12.5 SWOT Analysis
14. Key Takeaways
List of Tables
Table 1: Global Mixed Reality Market Size (US$ Mn) Forecast, by Component, 2015–2024
Table 2: Global Mixed Reality Market Size (US$ Mn) Forecast, by Application, 2015–2024
Table 3: Global Mixed Reality Market Size (US$ Mn) Forecast, by Country, 2015 – 2024
Table 4: North America Mixed Reality Market Size (US$ Mn) Forecast, by Component, 2015–2024
Table 5: North America Mixed Reality Market Size (US$ Mn) Forecast, by Application, 2015–2024
Table 6: North America Mixed Reality Market Size (US$ Mn) Forecast, by Country, 2015 – 2024
Table 7: Europe Mixed Reality Market Size (US$ Mn) Forecast, by Component, 2015–2024
Table 8: Europe Mixed Reality Market Size (US$ Mn) Forecast, by Application, 2015–2024
Table 9: Europe Mixed Reality Market Size (US$ Mn) Forecast, by Country, 2015 – 2024
Table 10: Asia Pacific Mixed Reality Market Size (US$ Mn) Forecast, by Component, 2015–2024
Table 11: Asia Pacific Mixed Reality Market Size (US$ Mn) Forecast, by Application, 2015–2024
Table 12: Asia Pacific Mixed Reality Market Size (US$ Mn) Forecast, by Country, 2015 – 2024
Table 13: MEA Mixed Reality Market Size (US$ Mn) Forecast, by Component, 2015–2024
Table 14: MEA Mixed Reality Market Size (US$ Mn) Forecast, by Application, 2015–2024
Table 15: MEA Mixed Reality Market Size (US$ Mn) Forecast, by Country, 2015 – 2024
Table 16: South America Mixed Reality Market Size (US$ Mn) Forecast, by Component, 2015–2024
Table 17: South America Mixed Reality Market Size (US$ Mn) Forecast, by Application, 201–2024
Table 18: South America Mixed Reality Market Size (US$ Mn) Forecast, by Country, 2015 – 2024
List of Figures
Figure 1: Global Mixed Reality Market Size (US$ Mn) Forecast, 2015–2024
Figure 2: Global Mixed Reality Market Y-o-Y Growth (Value %) Forecast, 2016–2024
Figure 3: Global Mixed Reality Market Value Share Analysis by Component, 2016 and 2024
Figure 4: Global Mixed Reality Market Revenue and Y-o-Y Growth, by Component – Hardware, 2016 - 2024, (US$ Mn and Value %)
Figure 5: Global Mixed Reality Market Revenue and Y-o-Y Growth, by Component – software, 2016 - 2024, (US$ Mn and Value %)
Figure 6: Mixed Reality Market Attractiveness Analysis by Component
Figure 7: Global Mixed Reality Market Value Share Analysis by Application, 2016 and 2024
Figure 8: Global Mixed Reality Market Revenue and Y-o-Y Growth, by Application – Automotive & Aerospace, 2015 - 2024, (US$ Mn and Value %)
Figure 9: Global Mixed Reality Market Revenue and Y-o-Y Growth, by Application – Healthcare, 2016 - 2024, (US$ Mn and Value %)
Figure 10: Global Mixed Reality Market Revenue and Y-o-Y Growth, by Application – Entertainment, 2016 - 2024, (US$ Mn and Value %)
Figure 11: Global Mixed Reality Market Revenue and Y-o-Y Growth, by Application – E-commerce, 2016 - 2024, (US$ Mn and Value %)
Figure 12: Global Mixed Reality Market Revenue and Y-o-Y Growth, by Application – Others, 2016 - 2024, (US$ Mn and Value %)
Figure 13: Mixed Reality Market Attractiveness Analysis by Application
Figure 14: Global Mixed Reality Market Value Share Analysis by Region, 2016 and 2024
Figure 15: Europe: Mixed Reality Market Attractiveness Analysis, by Region
Figure 16: North America Mixed Reality Market Size (US$ Mn) Forecast, 2015–2024
Figure 17: North America Mixed Reality Market Y-o-Y Growth (Value %), 2016–2024
Figure 18: North America Mixed Reality Market Value Share Analysis, by Component, 2016 and 2024
Figure 19: North America Mixed Reality Market Value Share Analysis by Application, 2016 and 2024
Figure 20: North America Mixed Reality Market Value Share Analysis, by Country, 2016 and 2024
Figure 23: By Application (2016)
Figure 21: By Component (2016)
Figure 22: By Country (2016)
Figure 24: Europe Mixed Reality Market Size (US$ Mn) Forecast, 2015–2024
Figure 25: Europe Mixed Reality Market Y-o-Y Growth (Value %), 2016–2024
Figure 26: Europe Mixed Reality Market Value Share Analysis, by Component, 2016 and 2024
Figure 27: Europe Mixed Reality Market Value Share Analysis by Application, 2016 and 2024
Figure 28: Europe Mixed Reality Market Value Share Analysis by Country, 2016 and 2024
Figure 31: By Application (2016)
Figure 29: By Component (2016)
Figure 30: By Country (2016)
Figure 32: Asia Pacific Mixed Reality Market Size (US$ Mn) Forecast, 2015–2024
Figure 33: Asia Pacific Mixed Reality Market Y-o-Y Growth (Value %), 2016–2024
Figure 34: Asia Pacific Mixed Reality Market Value Share Analysis, by Component, 2016 and 2024
Figure 35: Asia Pacific Mixed Reality Market Value Share Analysis by Application, 2016 and 2024
Figure 36: Asia Pacific Mixed Reality Market Value Share Analysis, by Country, 2016 & 2024
Figure 39: By Application (2016)
Figure 37: By Component (2016)
Figure 38: By Country (2016)
Figure 40: MEA Mixed Reality Market Size (US$ Mn) Forecast, 2015–2024
Figure 41: MEA Mixed Reality Market Y-o-Y Growth (Value %), 2016–2024
Figure 42: MEA Mixed Reality Market Value Share Analysis, by Component, 2016 and 2024
Figure 43: MEA Mixed Reality Market Value Share Analysis by Application, 2016 and 2024
Figure 44: MEA Mixed Reality Market Value Share Analysis by Country, 2016 and 2024
Figure 47: By Application (2016)
Figure 45: By Component (2016)
Figure 46: By Country (2016)
Figure 48: South America Mixed Reality Market Size (US$ Mn) Forecast, 2015–2024
Figure 49: South America Mixed Reality Market Y-o-Y Growth (Value %), 2016–2024
Figure 50: South America Mixed Reality Market Value Share Analysis, by Component, 2016 and 2024
Figure 51: South America Mixed Reality Market Value Share Analysis by Application, 2016 and 2024
Figure 52: South America Mixed Reality Market Value Share Analysis, by Country, 2016 and 2024
Figure 55: By Application (2016)
Figure 53: By Component (2016)
Figure 54: By Country (2016)
Figure 56: Global Mixed Reality Market Share Analysis by Company (2015)
Copyright © Transparency Market Research, Inc. All Rights reserved
Trust Online

Mixed Reality Market