
Reports
Reports
The growing demand for microspheres can be attributed to advancements in chemical and biological testing. With a large portfolio offerings pertaining to the microspheres market, it is difficult to peg a single industry as the driver of sales within the market. From pharmaceuticals to aerospace, majority of the high-end industries consumer microspheres in some capacity. To exemplify, assays used in drug development and biology can be measures with the help of microspheres. The chemical industry has been at the helm of market growth and maturity. The unprecedented requirement for improved research lines, especially the ones that involve microspheres, has aided market growth. Henceforth, the global microspheres market is set to attract formidable demand in the times to follow.
Manufacturing of polymers and glass also involves the use of microspheres that help in reducing the material density. Buoyancy applications of microspheres also play a defining role in driving demand within the global market. Manufacturing of ceramics and other related materials necessitates filtering of particles. Moreover, these ceramics can be used to manufacture concrete and building materials. Use of microspheres in the domain of ceramic manufacturing has ushered an era of growth and advancement within the market. In addition to this, particle image velocimetry is also an important process that involves the use specialised microspheres.
In this report preview, Transparency Market Research decodes the key segments pertaining to the global microspheres market. The preview focuses on defining the role of each of these segments in driving market demand. The global microspheres is estimated to grow at a remarkable CAGR of 12% over the period between 2015 and 2023. Furthermore, the total value of this market is expected to reach US$ 7.77 bn by the end of the forecast period. The cost dynamics associated with the use of microspheres in various industries shall also play a defining role in market growth.
Cosmetic Manufacturing to Cause Demand-Uptick within Microspheres Market
On the basis of application, the use of microspheres spans into leading industries such as life sciences, cosmetics, pharmaceuticals, paints and composites, aerospace, automotive, and oil and gas. Manufacturing of anti-aging cosmetic products that can hide wrinkles necessitates the use of microspheres that can soften and rejuvenate the skin. In addition to this, microspheres are also used in the pharmaceutical and medical industries. The need for drug delivery has led researchers to develop microscopic technologies that can accomplish the process.
Several market experts believe that the growth of the oil and gas industry would pave way for the inflow of voluminous revenues into the global microspheres market. The need for pinpoint control within this industry shall create increased demand for microspheres in the oil industry. Furthermore, electronic paper and insulation technologies are amongst other key end-use areas for microspheres. Advancements in chemical engineering shall unravel new opportunities for growth within this market.
North America Microspheres to Lead Market Growth
On the basis of geography, the global microspheres market can be segmented into South America, Europe, Asia Pacific, the Middle East and Africa, and North America. The growing relevance of personal care products, especially in the US, has played an integral role in driving sales across the North America market. The oil and gas industry of the Middle East and Africa has matured at a much faster pace as against industries of other regions. This trend has given a thrust to the growth of the Middle East microspheres market.
Some of the key players operating in the global microspheres market are Akzo Nobel N.V, Nanjing Jianzun Glass Microsphere Plant Co., Ltd., Matsumoto Yushi-Seiyaku Co.,Ltd, Dennert Poraver GmbH, Potters Industries LLC, and Momentive Performance Materials Inc.
1. Preface
1.1. Research Description
1.2. Research Scope
1.3. Assumptions
1.4. Market Segmentation
1.5. Research Methodology
2. Executive Summary
2.1. Global Microspheres Market, 2014-2023 (Tons) (US$ Mn)
2.2. Global Microspheres Market: Market Snapshot
3. Microspheres Market - Industry Analysis
3.1. Introduction
3.2. Value Chain Analysis
3.3. Market Dynamics
3.3.1. Market Drivers
3.3.1.1. Advancement and development in medical technology and life science & biotechnology is expected to boost demand for microspheres
3.3.1.2. Superior structural and other enhanced properties over conventional fillers are likely to drive demand for microspheres globally
3.3.1.3. Rising demand for high-performance micro materials in the construction industry in emerging markets
3.3.2. Restraints:
3.3.2.1. Volatility in prices of raw materials is likely to restrict growth of microspheres market
3.3.2.2. Approval from certifying bodies like FDA for usage of microspheres in medical applications
3.3.3. Opportunitites:
3.3.3.1. With the growing demand for cancer treatment drugs and therapies, demand for microspheres is anticipated to rise significantly
3.4. Porter’s Five Forces Analysis
3.4.1. Bargaining Power of Suppliers
3.4.2. Bargaining Power of Buyers
3.4.3. Threat of New Entrants
3.4.4. Threat of Substitutes
3.4.5. Degree of Competition
3.5. Market Attractiveness Analysis
3.5.1. Global Microspheres Market Attractiveness, by Application, 2014
3.5.2. Global Microspheres Market Attractiveness, by Country, 2014
4. Raw Material and Price Trend Analysis
4.1. Major Raw Material Price Trend, 2014-2023 (US$/Ton)
4.2. Microspheres Global Price Trend, 2014-2023 (US$/KG)
5. Microspheres Market – Product Analysis
5.1. Microspheres Market: Product Overview
5.1.1. Global Hollow Microspheres Market, 2014-2023 (Kilo Tons) (US$ Mn)
5.1.2. Global Solid Microspheres Market, 2014-2023 (Kilo Tons) (US$ Mn)
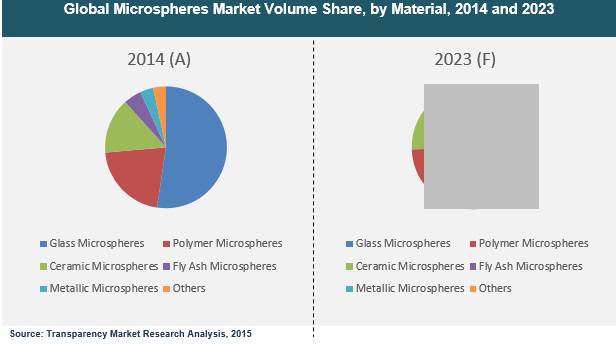
6. Microspheres Market – Material Analysis
6.1. Microspheres Market: Material Overview
6.1.1. Global Glass Microspheres Market, 2014-2023 (Kilo Tons) (US$ Mn)
6.1.2. Global Polymer Microspheres Market, 2014-2023 (Kilo Tons) (US$ Mn)
6.1.3. Global Ceramic Microspheres Market, 2014-2023 (Kilo Tons) (US$ Mn)
6.1.4. Global Fly Ash Microspheres Market, 2014-2023 (Kilo Tons) (US$ Mn)
6.1.5. Global Metallic Microspheres Market, 2014-2023 (Kilo Tons) (US$ Mn)
6.1.6. Global Other Microspheres Market, 2014-2023 (Kilo Tons) (US$ Mn)
7. Microspheres Market – Application Analysis
7.1. Microspheres Market: Application Overview
7.1.1. Global Microspheres Market for Composites, 2014-2023 (Kilo Tons) (US$ Mn)
7.1.2. Global Microspheres Market for Medical Technology, 2014-2023 (Kilo Tons) (US$ Mn)
7.1.3. Global Microspheres Market for Life Science & Biotechnology, 2014-2023 (Kilo Tons) (US$ Mn)
7.1.4. Global Microspheres Market for Paints & Coatings, 2014-2023 (Kilo Tons) (US$ Mn)
7.1.5. Global Microspheres Market for Cosmetics & Personal Care, 2014-2023 (Kilo Tons) (US$ Mn)
7.1.6. Global Microspheres Market for Oil & Gas, 2014-2023 (Kilo Tons) (US$ Mn)
7.1.7. Global Microspheres Market for Automotive, 2014-2023 (Kilo Tons) (US$ Mn)
7.1.8. Global Microspheres Market for Aerospace, 2014-2023 (Kilo Tons) (US$ Mn)
7.1.9. Global Microspheres Market for Others, 2014-2023 (Kilo Tons) (US$ Mn)
8. Global Microspheres Market - Regional Analysis
8.1. Microspheres Market: Regional Overview
8.1.1. North America Microspheres Market- By Regional Sub-segment, 2014-2023
8.1.1.1. North America Microspheres Market, By Product Segment, 2014-2023 (Tons)
8.1.1.2. North America Microspheres Market, By Product Segment, 2014-2023 (US$ Mn)
8.1.1.3. North America Microspheres Market, By Material Segment, 2014-2023 (Tons)
8.1.1.4. North America Microspheres Market, By Material Segment, 2014-2023 (US$ Mn)
8.1.1.5. North America Microspheres Market, By Application, 2014-2023 (Tons)
8.1.1.6. North America Microspheres Market, By Application, 2014-2023 (US$ Mn)
8.1.2. U.S. Microspheres Market- By Regional Sub-segment, 2014-2023
8.1.2.1. U.S. Microspheres Market, By Product Segment, 2014-2023 (Tons)
8.1.2.2. U.S. Microspheres Market, By Product, 2014-2023 (US$ Mn)
8.1.2.3. U.S. Microspheres Market, By Material, 2014-2023 (Tons)
8.1.2.4. U.S. Microspheres Market, By Material, 2014-2023 (US$ Mn)
8.1.2.5. U.S. Microspheres Market, By Application, 2014-2023 (Tons)
8.1.2.6. U.S. Microspheres Market, By Application, 2014-2023 (US$ Mn)
8.1.3. Rest of North America Microspheres Market- By Regional Sub-segment, 2014-2023
8.1.3.1. Rest of North America Microspheres Market, By Product, 2014-2023 (Tons)
8.1.3.2. Rest of North America Microspheres Market, By Product, 2014-2023 (US$ Mn)
8.1.3.3. Rest of North America Microspheres Market, By Material, 2014-2023 (Tons)
8.1.3.4. Rest of North America Microspheres Market, By Material, 2014-2023 (US$ Mn)
8.1.3.5. Rest of North America Microspheres Market, By Application, 2014-2023 (Tons)
8.1.3.6. Rest of North America Microspheres Market, By Application, 2014-2023 (US$ Mn)
8.1.4. Europe Microspheres Market- By Regional Sub-segment, 2014-2023
8.1.4.1. Europe Microspheres Market, By Product, 2014-2023 (Tons)
8.1.4.2. Europe Microspheres Market, By Product, 2014-2023 (US$ Mn)
8.1.4.3. Europe Microspheres Market, By Material, 2014-2023 (Tons)
8.1.4.4. Europe Microspheres Market, By Material, 2014-2023 (US$ Mn)
8.1.4.5. Europe Microspheres Market, By Application, 2014-2023 (Tons)
8.1.4.6. Europe Microspheres Market, By Application, 2014-2023 (US$ Mn)
8.1.5. Germany Microspheres Market- By Regional Sub-segment, 2014-2023
8.1.5.1. Germany Microspheres Market, By Product, 2014-2023 (Tons)
8.1.5.2. Germany Microspheres Market, By Product, 2014-2023 (US$ Mn)
8.1.5.3. Germany Microspheres Market, By Material, 2014-2023 (Tons)
8.1.5.4. Germany Microspheres Market, By Material, 2014-2023 (US$ Mn)
8.1.5.5. Germany Microspheres Market, By Application, 2014-2023 (Tons)
8.1.5.6. Germany Microspheres Market, By Application, 2014-2023 (US$ Mn)
8.1.6. U.K. Microspheres Market- By Regional Sub-segment, 2014-2023
8.1.6.1. U.K. Microspheres Market, By Product, 2014-2023 (Tons)
8.1.6.2. U.K. Microspheres Market, By Product, 2014-2023 (US$ Mn)
8.1.6.3. U.K. Microspheres Market, By Material, 2014-2023 (Tons)
8.1.6.4. U.K. Microspheres Market, By Material, 2014-2023 (US$ Mn)
8.1.6.5. U.K. Microspheres Market, By Application, 2014-2023 (Tons)
8.1.6.6. U.K. Microspheres Market, By Application, 2014-2023 (US$ Mn)
8.1.7. France Microspheres Market- By Regional Sub-segment, 2014-2023
8.1.7.1. France Microspheres Market, By Product, 2014-2023 (Tons)
8.1.7.2. France Microspheres Market, By Product, 2014-2023 (US$ Mn)
8.1.7.3. France Microspheres Market, By Material, 2014-2023 (Tons)
8.1.7.4. France Microspheres Market, By Material, 2014-2023 (US$ Mn)
8.1.7.5. France Microspheres Market, By Application, 2014-2023 (Tons)
8.1.7.6. France Microspheres Market, By Application, 2014-2023 (US$ Mn)
8.1.8. Spain Microspheres Market- By Regional Sub-segment, 2014-2023
8.1.8.1. Spain Microspheres Market, By Product, 2014-2023 (Tons)
8.1.8.2. Spain Microspheres Market, By Product, 2014-2023 (US$ Mn)
8.1.8.3. Spain Microspheres Market, By Material, 2014-2023 (Tons)
8.1.8.4. Spain Microspheres Market, By Material, 2014-2023 (US$ Mn)
8.1.8.5. Spain Microspheres Market, By Application, 2014-2023 (Tons)
8.1.8.6. Spain Microspheres Market, By Application, 2014-2023 (US$ Mn)
8.1.9. Italy Microspheres Market- By Regional Sub-segment, 2014-2023
8.1.9.1. Italy Microspheres Market, By Product, 2014-2023 (Tons)
8.1.9.2. Italy Microspheres Market, By Product, 2014-2023 (US$ Mn)
8.1.9.3. Italy Microspheres Market, By Material, 2014-2023 (Tons)
8.1.9.4. Italy Microspheres Market, By Material, 2014-2023 (US$ Mn)
8.1.9.5. Italy Microspheres Market, By Application, 2014-2023 (Tons)
8.1.9.6. Italy Microspheres Market, By Application, 2014-2023 (US$ Mn)
8.1.10. Rest of Europe Microspheres Market- By Regional Sub-segment, 2014-2023
8.1.10.1. Rest of Europe Microspheres Market, By Product, 2014-2023 (Tons)
8.1.10.2. Rest of Europe Microspheres Market, By Product, 2014-2023 (US$ Mn)
8.1.10.3. Rest of Europe Microspheres Market, By Material, 2014-2023 (Tons)
8.1.10.4. Rest of Europe Microspheres Market, By Material, 2014-2023 (US$ Mn)
8.1.10.5. Rest of Europe Microspheres Market, By Application, 2014-2023 (Tons)
8.1.10.6. Rest of Europe Microspheres Market, By Application, 2014-2023 (US$ Mn)
8.1.11. Asia Pacific Microspheres Market- By Regional Sub-segment, 2014-2023
8.1.11.1. Asia Pacific Microspheres Market, By Product, 2014-2023 (Tons)
8.1.11.2. Asia Pacific Microspheres Market, By Product, 2014-2023 (US$ Mn)
8.1.11.3. Asia Pacific Microspheres Market, By Material, 2014-2023 (Tons)
8.1.11.4. Asia Pacific Microspheres Market, By Material, 2014-2023 (US$ Mn)
8.1.11.5. Asia Pacific Microspheres Market, By Application, 2014-2023 (Tons)
8.1.11.6. Asia Pacific Microspheres Market, By Application, 2014-2023 (US$ Mn)
8.1.12. China Microspheres Market- By Regional Sub-segment, 2014-2023
8.1.12.1. China Microspheres Market, By Product, 2014-2023 (Tons)
8.1.12.2. China Microspheres Market, By Product, 2014-2023 (US$ Mn)
8.1.12.3. China Microspheres Market, By Material, 2014-2023 (Tons)
8.1.12.4. China Microspheres Market, By Material, 2014-2023 (US$ Mn)
8.1.12.5. China Microspheres Market, By Application, 2014-2023 (Tons)
8.1.12.6. China Microspheres Market, By Application, 2014-2023 (US$ Mn)
8.1.13. Japan Microspheres Market- By Regional Sub-segment, 2014-2023
8.1.13.1. Japan Microspheres Market, By Product, 2014-2023 (Tons)
8.1.13.2. Japan Microspheres Market, By Product, 2014-2023 (US$ Mn)
8.1.13.3. Japan Microspheres Market, By Material, 2014-2023 (Tons)
8.1.13.4. Japan Microspheres Market, By Material, 2014-2023 (US$ Mn)
8.1.13.5. Japan Microspheres Market, By Application, 2014-2023 (Tons)
8.1.13.6. Japan Microspheres Market, By Application, 2014-2023 (US$ Mn)
8.1.14. ASEAN Microspheres Market- By Regional Sub-segment, 2014-2023
8.1.14.1. ASEAN Microspheres Market, By Product, 2014-2023 (Tons)
8.1.14.2. ASEAN Microspheres Market, By Product, 2014-2023 (US$ Mn)
8.1.14.3. ASEAN Microspheres Market, By Material, 2014-2023 (Tons)
8.1.14.4. ASEAN Microspheres Market, By Material, 2014-2023 (US$ Mn)
8.1.14.5. ASEAN Microspheres Market, By Application, 2014-2023 (Tons)
8.1.14.6. ASEAN Microspheres Market, By Application, 2014-2023 (US$ Mn)
8.1.15. Rest of Asia Pacific Microspheres Market- By Regional Sub-segment, 2014-2023
8.1.15.1. Rest of Asia Pacific Microspheres Market, By Product, 2014-2023 (Tons)
8.1.15.2. Rest of Asia Pacific Microspheres Market, By Product, 2014-2023 (US$ Mn)
8.1.15.3. Rest of Asia Pacific Microspheres Market, By Material, 2014-2023 (Tons)
8.1.15.4. Rest of Asia Pacific Microspheres Market, By Material, 2014-2023 (US$ Mn)
8.1.15.5. Rest of Asia Pacific Microspheres Market, By Application, 2014-2023 (Tons)
8.1.15.6. Rest of Asia Pacific Microspheres Market, By Application, 2014-2023 (US$ Mn)
8.1.16. Latin America Microspheres Market- By Regional Sub-segment, 2014-2023
8.1.16.1. Latin America Microspheres Market, By Product, 2014-2023 (Tons)
8.1.16.2. Latin America Microspheres Market, By Product, 2014-2023 (US$ Mn)
8.1.16.3. Latin America Microspheres Market, By Material, 2014-2023 (Tons)
8.1.16.4. Latin America Microspheres Market, By Material, 2014-2023 (US$ Mn)
8.1.16.5. Latin America Microspheres Market, By Application, 2014-2023 (Tons)
8.1.16.6. Latin America Microspheres Market, By Application, 2014-2023 (US$ Mn)
8.1.17. Brazil Microspheres Market- By Regional Sub-segment, 2014-2023
8.1.17.1. Brazil Microspheres Market, By Product, 2014-2023 (Tons)
8.1.17.2. Brazil Microspheres Market, By Product, 2014-2023 (US$ Mn)
8.1.18. Brazil Microspheres Market, By Material, 2014-2023 (Tons)
8.1.19. Brazil Microspheres Market, By Material, 2014-2023 (US$ Mn)
8.1.20. Brazil Microspheres Market, By Application, 2014-2023 (Tons)
8.1.21. Brazil Microspheres Market, By Application, 2014-2023 (US$ Mn)
8.1.22. Rest of Latin America Microspheres Market- By Regional Sub-segment, 2014-2023
8.1.23. Rest of Latin America Microspheres Market, By Product, 2014-2023 (Tons)
8.1.24. Rest of Latin America Microspheres Market, By Product, 2014-2023 (US$ Mn)
8.1.25. Rest of Latin America Microspheres Market, By Material, 2014-2023 (Tons)
8.1.26. Rest of Latin America Microspheres Market, By Material, 2014-2023 (US$ Mn)
8.1.27. Rest of Latin America Microspheres Market, By Application, 2014-2023 (Tons)
8.1.28. Rest of Latin America Microspheres Market, By Application, 2014-2023 (US$ Mn)
8.1.29. Middle East & Africa Microspheres Market- By Regional Sub-segment, 2014-2023
8.1.29.1. Middle East & Africa Microspheres Market, By Product, 2014-2023 (Tons)
8.1.29.2. Middle East & Africa Microspheres Market, By Product, 2014-2023 (US$ Mn)
8.1.29.3. Middle East & Africa Microspheres Market, By Material, 2014-2023 (Tons)
8.1.29.4. Middle East & Africa Microspheres Market, By Material, 2014-2023 (US$ Mn)
8.1.29.5. Middle East & Africa Microspheres Market, By Application, 2014-2023 (Tons)
8.1.29.6. Middle East & Africa Microspheres Market, By Application, 2014-2023 (US$ Mn)
8.1.30. GCC Microspheres Market- By Regional Sub-segment, 2014-2023
8.1.30.1. GCC Microspheres Market, By Product, 2014-2023 (Tons)
8.1.30.2. GCC Microspheres Market, By Product, 2014-2023 (US$ Mn)
8.1.30.3. GCC Microspheres Market, By Material, 2014-2023 (Tons)
8.1.30.4. GCC Microspheres Market, By Material, 2014-2023 (US$ Mn)
8.1.30.5. GCC Microspheres Market, By Application, 2014-2023 (Tons)
8.1.30.6. GCC Microspheres Market, By Application, 2014-2023 (US$ Mn)
8.1.31. South Africa Microspheres Market- By Regional Sub-segment, 2014-2023
8.1.31.1. South Africa Microspheres Market, By Product, 2014-2023 (Tons)
8.1.31.2. South Africa Microspheres Market, By Product, 2014-2023 (US$ Mn)
8.1.31.3. South Africa Microspheres Market, By Material, 2014-2023 (Tons)
8.1.31.4. South Africa Microspheres Market, By Material, 2014-2023 (US$ Mn)
8.1.31.5. South Africa Microspheres Market, By Application, 2014-2023 (Tons)
8.1.31.6. South Africa Microspheres Market, By Application, 2014-2023 (US$ Mn)
8.1.32. Rest of Middle East & Africa Microspheres Market- By Regional Sub-segment, 2014-2023
8.1.32.1. Rest of Middle East & Africa Microspheres Market, By Product, 2014-2023 (Tons)
8.1.32.2. Rest of Middle East & Africa Microspheres Market, By Product, 2014-2023 (US$ Mn)
8.1.32.3. Rest of Middle East & Africa Microspheres Market, By Material, 2014-2023 (Tons)
8.1.32.4. Rest of Middle East & Africa Microspheres Market, By Material, 2014-2023 (US$ Mn)
8.1.32.5. Rest of Middle East & Africa Microspheres Market, By Application, 2014-2023 (Tons)
8.1.32.6. Rest of Middle East & Africa Microspheres Market, By Application, 2014-2023 (US$ Mn)
9. Company Profiles
9.1. 3M
9.2. Akzo Nobel N.V.
9.3. Chase Corporation
9.4. Matsumoto Yushi-Seiyaku Co., Ltd
9.5. Trelleborg AB
9.6. Luminex Corporation
9.7. Sigmund Lindner GmbH
9.8. MO-SCI
9.9. Cospheric LLC
9.10. Nanjing Jianzun Glass Microsphere Plant Co., Ltd.
9.11. Swarco AG
9.12. Dennert Poraver GmbH
9.13. Momentive Performance Materials Inc.
9.14. Potters Industries LLC
10. Primary Findings
11. List of Customers
Copyright © Transparency Market Research, Inc. All Rights reserved
Trust Online

Microspheres (Hollow Microspheres and Solid Microspheres) Market