
Reports
Reports
Global Microbiome Sequencing Services Market: Snapshot
The global microbiome sequencing services market has experienced rapid growth in the last few years due to the growing support for research into genomics. The market has benefited from the growing investment being driven into the life sciences sector and particularly genetic and genomic research. Government healthcare agencies have been the prime contributor to the growth of the life sciences research sector, while private pharmaceutical and biotech companies have risen to the fore in recent year as a major contributor due to the growing economic potential of the sector. The microbiome sequencing services market is likely to benefit from the rising awareness about the utility of microbiome sequencing in understanding human health and how microbial presence affects it in various ways.
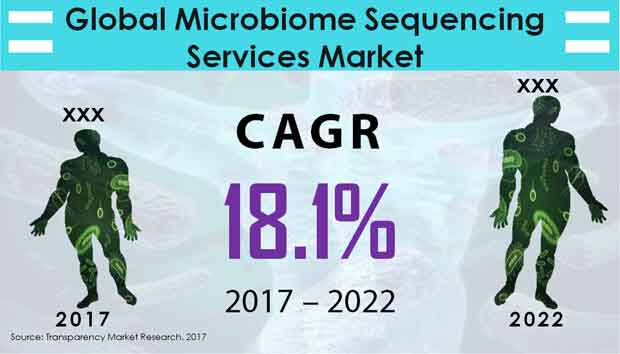
According to Transparency Market Research, the global microbiome sequencing services market is likely to rise to a valuation of US$1,570.4 mn by 2022. The microbiome sequencing services market was valued at US$684.1 mn in 2017 and is expected to exhibit a strong 18.1% CAGR between 2017 and 2022.
Sequencing by Synthesis Likely to Remain Favored Technique in Microbiome Sequencing
The global microbiome sequencing services market is segmented by technique into sequencing by synthesis, sequencing by ligation, pyrosequencing, Sanger sequencing, and others. Of these, sequencing by synthesis dominated the global microbiome sequencing services market in 2017, accounting for 47.8% of the global market with a valuation of US$326.7 mn. The segment is expected to exhibit an 18.6% CAGR in the 2017-2022 forecast period to rise to a valuation of US$765.6 mn by 2022. The promising growth prospects of the sequencing by synthesis segment are illustrated by the fact that its share in the global microbiome sequencing services market is likely to rise to 48.8% over the 2017-2022 forecast period.
North America to Dominate Global Microbiome Sequencing Services Market
Geographically, the global microbiome sequencing services market is dominated by North America, which held a valuation of US$261.4 mn in 2017 and is likely to rise to US$619.1 mn by 2022 thanks to an excellent 18.8% CAGR. The North America microbiome sequencing services market is helped by the presence of several leading players in the global pharmaceutical and biotech sector in the region, which has enabled a smooth growth in demand for microbiome sequencing services. The widespread awareness among consumers in North America about the utility of microbiome sequencing is also conducive to growth of the microbiome sequencing services market in the region.
Europe is also likely to remain a leading contributor to the global microbiome sequencing services market in the coming years, with the market expected to rise to a valuation of US$439.5 mn by 2022. Europe is one of the regions where genomics research has continued largely unhindered, which has helped enable steady growth of the microbiome sequencing services market in the region. The Europe microbiome sequencing services market is likely to exhibit a strong 17% CAGR over the 2017-2022 forecast period.
Asia Pacific except Japan to Exhibit Robust 19.1% CAGR
Despite North America’s dominance in the global microbiome sequencing services market, Asia Pacific except Japan is likely to emerge as a major regional player in the global market in the coming years due to steady growth of the pharmaceuticals and biotech sector in the region. The APEJ market for microbiome sequencing services is likely to exhibit a 19.1% CAGR over the 2017-2022 forecast period to emerge at a valuation of US$245 mn by 2022.
Competitive Dynamics
The global microbiome sequencing services market is likely to remain fragmented in the coming years due to the availability of diverse opportunities in the market for players of all size. Leading players in the global microbiome sequencing services market include Metabiomics Corp., Microbiome Therapeutics LLC, Microbiome Insights Inc., Rancho Biosciences, Zymo Research Corp., Molzym GmbH & Co. KG, Ubiome Inc., Diversigen Inc., Merieux Nutrisciences Corporation, and Molecular Research LP.
Increased Demand for Genomic Research to Boost Microbiome Sequencing Services Market
The growth of the global microbiome sequencing services market is likely to be driven by huge investment in microbiome research. There has been a rise in the demand for genomic research and next generation sequencing services, which is likely to work in favor of the said market. In addition, microbiome sequencing comes with a widening scope of application. The technologies of next generation sequencing reveal paradigm shift in sequencing landscape. The application of this technological expertise has been extended to the field of biological research, which has led to remarkable and substantial understanding into the cell’s molecular biology.
In the last decade, budgets allotted to research and development activities have witnessed a steady rise. All the pharmaceutical companies want the drugs that they make to do well in the market. On the other hand, there is a huge cost involved with the development of drugs and a large amount of funding is required for the purpose of marketing these drugs. This factor is estimated to impede development of the global microbiome sequencing services market in the near future.
Demand to Ride on the Back of Increased Investment and Interest in NGS Services
Microbiomes refer to a set of microorganism staying in the body of a human being. These organisms live on the gastrointestinal tract, mouth, saliva, eyes, and skin of human body. The human microbiome comes with thousands of bacterial species/ microbes in different communities together with metabolites, proteins, and genes. Any imbalance in these microbes often results in various deadly diseases. The research on microbiome sequencing and its associated techniques pertaining to the study of microbial composition of the human gut helps in the understanding of the resulting impact on disease and health development.
Advancement in technology along with a surge in the next generation sequencing services to produce microbiome data. In addition, various techniques, such as new software tools and novel high-throughput sequencing are changing microbiome studies by offering service at high cost, speed, and are high quality.
1. Global Microbiome Sequencing Services Market - Executive Summary
2. Global Microbiome Sequencing Services Market Overview
2.1. Introduction
2.1.1. Global Microbiome Sequencing Services Market Taxonomy
2.1.2. Global Microbiome Sequencing Services Market Definition
2.2. Global Microbiome Sequencing Services Market Size (US$ Mn) and Forecast, 2012-2022
2.2.1. Global Microbiome Sequencing Services Market Y-o-Y Growth
2.3. Global Microbiome Sequencing Services Market Dynamics
2.4. Supply Chain
2.5. Cost Structure
2.6. Pricing Analysis
2.7. Raw Material Sourcing Strategy and Analysis
2.8. Service Provider List
2.9. Key Participants Market Presence (Intensity Map) By Region
3. Global Microbiome Sequencing Services Market Analysis and Forecast By Technique
3.1. Global Microbiome Sequencing Services Market Size and Forecast By Technique, 2012-2022
3.1.1. Sequencing By Synthesis Market Size and Forecast, 2012-2022
3.1.1.1. Revenue (US$ Mn) Comparison, By Region
3.1.1.2. Market Share Comparison, By Region
3.1.1.3. Y-o-Y growth Comparison, By Region
3.1.2. Sequencing By Ligation Market Size and Forecast, 2012-2022
3.1.2.1. Revenue (US$ Mn) Comparison, By Region
3.1.2.2. Market Share Comparison, By Region
3.1.2.3. Y-o-Y growth Comparison, By Region
3.1.3. Pyrosequencing Market Size and Forecast, 2012-2022
3.1.3.1. Revenue (US$ Mn) Comparison, By Region
3.1.3.2. Market Share Comparison, By Region
3.1.3.3. Y-o-Y growth Comparison, By Region
3.1.4. Sanger Sequencing Market Size and Forecast, 2012-2022
3.1.4.1. Revenue (US$ Mn) Comparison, By Region
3.1.4.2. Market Share Comparison, By Region
3.1.4.3. Y-o-Y growth Comparison, By Region
3.1.5. Other Technologies Market Size and Forecast, 2012-2022
3.1.5.1. Revenue (US$ Mn) Comparison, By Region
3.1.5.2. Market Share Comparison, By Region
3.1.5.3. Y-o-Y growth Comparison, By Region
4. Global Microbiome Sequencing Services Market Analysis and Forecast By End User
4.1. Global Microbiome Sequencing Services Market Size and Forecast By End User, 2012-2022
4.1.1. Pharmaceutical Companies Market Size and Forecast, 2012-2022
4.1.1.1. Revenue (US$ Mn) Comparison, By Region
4.1.1.2. Market Share Comparison, By Region
4.1.1.3. Y-o-Y growth Comparison, By Region
4.1.2. Academic and Research Institutes Market Size and Forecast, 2012-2022
4.1.2.1. Revenue (US$ Mn) Comparison, By Region
4.1.2.2. Market Share Comparison, By Region
4.1.2.3. Y-o-Y growth Comparison, By Region
4.1.3. Biotech Companies Market Size and Forecast, 2012-2022
4.1.3.1. Revenue (US$ Mn) Comparison, By Region
4.1.3.2. Market Share Comparison, By Region
4.1.3.3. Y-o-Y growth Comparison, By Region
5. Global Microbiome Sequencing Services Market Analysis and Forecast By Application
5.1. Global Microbiome Sequencing Services Market Size and Forecast By Application, 2012-2022
5.1.1. Shotgun Sequencing Market Size and Forecast, 2012-2022
5.1.1.1. Revenue (US$ Mn) Comparison, By Region
5.1.1.2. Market Share Comparison, By Region
5.1.1.3. Y-o-Y growth Comparison, By Region
5.1.2. Targeted Gene Sequencing Market Size and Forecast, 2012-2022
5.1.2.1. Revenue (US$ Mn) Comparison, By Region
5.1.2.2. Market Share Comparison, By Region
5.1.2.3. Y-o-Y growth Comparison, By Region
5.1.3. RNA Sequencing Market Size and Forecast, 2012-2022
5.1.3.1. Revenue (US$ Mn) Comparison, By Region
5.1.3.2. Market Share Comparison, By Region
5.1.3.3. Y-o-Y growth Comparison, By Region
5.1.4. Whole Genome Sequencing Market Size and Forecast, 2012-2022
5.1.4.1. Revenue (US$ Mn) Comparison, By Region
5.1.4.2. Market Share Comparison, By Region
5.1.4.3. Y-o-Y growth Comparison, By Region
5.1.5. Other Applications Market Size and Forecast, 2012-2022
5.1.5.1. Revenue (US$ Mn) Comparison, By Region
5.1.5.2. Market Share Comparison, By Region
5.1.5.3. Y-o-Y growth Comparison, By Region
6. Global Microbiome Sequencing Services Market Analysis and Forecast By Region
6.1. Global Microbiome Sequencing Services Market Size and Forecast, 2012-2022
6.1.1. North America Microbiome Sequencing Services Market Size and Forecast, 2012-2022
6.1.1.1. Revenue (US$ Mn) Comparison, By Technique
6.1.1.2. Revenue (US$ Mn) Comparison, By End User
6.1.1.3. Revenue (US$ Mn) Comparison, By Application
6.1.2. Latin America Microbiome Sequencing Services Market Size and Forecast, 2012-2022
6.1.2.1. Revenue (US$ Mn) Comparison, By Technique
6.1.2.2. Revenue (US$ Mn) Comparison, By End User
6.1.2.3. Revenue (US$ Mn) Comparison, By Application
6.1.3. Europe Microbiome Sequencing Services Market Size and Forecast, 2012-2022
6.1.3.1. Revenue (US$ Mn) Comparison, By Technique
6.1.3.2. Revenue (US$ Mn) Comparison, By End User
6.1.3.3. Revenue (US$ Mn) Comparison, By Application
6.1.4. Japan Microbiome Sequencing Services Market Size and Forecast, 2012-2022
6.1.4.1. Revenue (US$ Mn) Comparison, By Technique
6.1.4.2. Revenue (US$ Mn) Comparison, By End User
6.1.4.3. Revenue (US$ Mn) Comparison, By Application
6.1.5. APEJ Microbiome Sequencing Services Market Size and Forecast, 2012-2022
6.1.5.1. Revenue (US$ Mn) Comparison, By Technique
6.1.5.2. Revenue (US$ Mn) Comparison, By End User
6.1.5.3. Revenue (US$ Mn) Comparison, By Application
6.1.6. MEA Microbiome Sequencing Services Market Size and Forecast, 2012-2022
6.1.6.1. Revenue (US$ Mn) Comparison, By Technique
6.1.6.2. Revenue (US$ Mn) Comparison, By End User
6.1.6.3. Revenue (US$ Mn) Comparison, By Application
7. North America Microbiome Sequencing Services Market Analysis and Forecast, By Country, 2012-2022
7.1. US Microbiome Sequencing Services Market Size and Forecast, 2012-2022
7.1.1. Revenue (US$ Mn) Comparison, By Technique
7.1.2. Revenue (US$ Mn) Comparison, By End User
7.1.3. Revenue (US$ Mn) Comparison, By Application
7.2. Canada Microbiome Sequencing Services Market Size and Forecast, 2012-2022
7.2.1. Revenue (US$ Mn) Comparison, By Technique
7.2.2. Revenue (US$ Mn) Comparison, By End User
7.2.3. Revenue (US$ Mn) Comparison, By Application
8. Latin America Microbiome Sequencing Services Market Analysis and Forecast, By Country, 2012-2022
8.1. Brazil Microbiome Sequencing Services Market Size and Forecast, 2012-2022
8.1.1. Revenue (US$ Mn) Comparison, By Technique
8.1.2. Revenue (US$ Mn) Comparison, By End User
8.1.3. Revenue (US$ Mn) Comparison, By Application
8.2. Mexico Microbiome Sequencing Services Market Size and Forecast, 2012-2022
8.2.1. Revenue (US$ Mn) Comparison, By Technique
8.2.2. Revenue (US$ Mn) Comparison, By End User
8.2.3. Revenue (US$ Mn) Comparison, By Application
8.3. Argentina Microbiome Sequencing Services Market Size and Forecast, 2012-2022
8.3.1. Revenue (US$ Mn) Comparison, By Technique
8.3.2. Revenue (US$ Mn) Comparison, By End User
8.3.3. Revenue (US$ Mn) Comparison, By Application
9. Europe Microbiome Sequencing Services Market Analysis and Forecast, By Country, 2012-2022
9.1. Germany Microbiome Sequencing Services Market Size and Forecast, 2012-2022
9.1.1. Revenue (US$ Mn) Comparison, By Technique
9.1.2. Revenue (US$ Mn) Comparison, By End User
9.1.3. Revenue (US$ Mn) Comparison, By Application
9.2. UK Microbiome Sequencing Services Market Size and Forecast, 2012-2022
9.2.1. Revenue (US$ Mn) Comparison, By Technique
9.2.2. Revenue (US$ Mn) Comparison, By End User
9.2.3. Revenue (US$ Mn) Comparison, By Application
9.3. France Microbiome Sequencing Services Market Size and Forecast, 2012-2022
9.3.1. Revenue (US$ Mn) Comparison, By Technique
9.3.2. Revenue (US$ Mn) Comparison, By End User
9.3.3. Revenue (US$ Mn) Comparison, By Application
9.4. Spain Microbiome Sequencing Services Market Size and Forecast, 2012-2022
9.4.1. Revenue (US$ Mn) Comparison, By Technique
9.4.2. Revenue (US$ Mn) Comparison, By End User
9.4.3. Revenue (US$ Mn) Comparison, By Application
9.5. Italy Microbiome Sequencing Services Market Size and Forecast, 2012-2022
9.5.1. Revenue (US$ Mn) Comparison, By Technique
9.5.2. Revenue (US$ Mn) Comparison, By End User
9.5.3. Revenue (US$ Mn) Comparison, By Application
9.6. Nordic Microbiome Sequencing Services Market Size and Forecast, 2012-2022
9.6.1. Revenue (US$ Mn) Comparison, By Technique
9.6.2. Revenue (US$ Mn) Comparison, By End User
9.6.3. Revenue (US$ Mn) Comparison, By Application
10. Japan Microbiome Sequencing Services Market Analysis and Forecast, By Country, 2012-2022
10.1. Japan Microbiome Sequencing Services Market Size and Forecast, 2012-2022
10.1.1. Revenue (US$ Mn) Comparison, By Technique
10.1.2. Revenue (US$ Mn) Comparison, By End User
10.1.3. Revenue (US$ Mn) Comparison, By Application
11. APEJ Microbiome Sequencing Services Market Analysis and Forecast, By Country, 2012-2022
11.1. China Microbiome Sequencing Services Market Size and Forecast, 2012-2022
11.1.1. Revenue (US$ Mn) Comparison, By Technique
11.1.2. Revenue (US$ Mn) Comparison, By End User
11.1.3. Revenue (US$ Mn) Comparison, By Application
11.2. India Microbiome Sequencing Services Market Size and Forecast, 2012-2022
11.2.1. Revenue (US$ Mn) Comparison, By Technique
11.2.2. Revenue (US$ Mn) Comparison, By End User
11.2.3. Revenue (US$ Mn) Comparison, By Application
11.3. Malaysia Microbiome Sequencing Services Market Size and Forecast, 2012-2022
11.3.1. Revenue (US$ Mn) Comparison, By Technique
11.3.2. Revenue (US$ Mn) Comparison, By End User
11.3.3. Revenue (US$ Mn) Comparison, By Application
11.4. Thailand Microbiome Sequencing Services Market Size and Forecast, 2012-2022
11.4.1. Revenue (US$ Mn) Comparison, By Technique
11.4.2. Revenue (US$ Mn) Comparison, By End User
11.4.3. Revenue (US$ Mn) Comparison, By Application
11.5. Singapore Microbiome Sequencing Services Market Size and Forecast, 2012-2022
11.5.1. Revenue (US$ Mn) Comparison, By Technique
11.5.2. Revenue (US$ Mn) Comparison, By End User
11.5.3. Revenue (US$ Mn) Comparison, By Application
11.6. Australia Microbiome Sequencing Services Market Size and Forecast, 2012-2022
11.6.1. Revenue (US$ Mn) Comparison, By Technique
11.6.2. Revenue (US$ Mn) Comparison, By End User
11.6.3. Revenue (US$ Mn) Comparison, By Application
12. MEA Microbiome Sequencing Services Market Analysis and Forecast, By Country, 2012-2022
12.1. GCC Countries Microbiome Sequencing Services Market Size and Forecast, 2012-2022
12.1.1. Revenue (US$ Mn) Comparison, By Technique
12.1.2. Revenue (US$ Mn) Comparison, By End User
12.1.3. Revenue (US$ Mn) Comparison, By Application
12.2. South Africa Microbiome Sequencing Services Market Size and Forecast, 2012-2022
12.2.1. Revenue (US$ Mn) Comparison, By Technique
12.2.2. Revenue (US$ Mn) Comparison, By End User
12.2.3. Revenue (US$ Mn) Comparison, By Application
12.3. Nigeria Microbiome Sequencing Services Market Size and Forecast, 2012-2022
12.3.1. Revenue (US$ Mn) Comparison, By Technique
12.3.2. Revenue (US$ Mn) Comparison, By End User
12.3.3. Revenue (US$ Mn) Comparison, By Application
12.4. Israel Microbiome Sequencing Services Market Size and Forecast, 2012-2022
12.4.1. Revenue (US$ Mn) Comparison, By Technique
12.4.2. Revenue (US$ Mn) Comparison, By End User
12.4.3. Revenue (US$ Mn) Comparison, By Application
13. Global Microbiome Sequencing Services Market Company Share, Competition Landscape and Company Profiles
13.1. Company Share Analysis
13.2. Competition Landscape
13.3. Company Profiles
13.3.1. Metabiomics Corp.
13.3.2. Microbiome Insights Inc.
13.3.3. Microbiome Therapeutics, LLC.
13.3.4. Molzym GmbH & Co. Kg
13.3.5. Rancho Biosciences
13.3.6. Ubiome, Inc.
13.3.7. Zymo Research Corp.
13.3.8. Merieux Nutrisciences Corporation
13.3.9. Diversigen, Inc.
13.3.10. Molecular Research Lp
14. Research Methodology
15. Secondary and Primary Sources
16. Assumptions and Acronyms
17. Disclaimer
List of Tables
TABLE 1 Global Microbiome Sequencing Services Market Value (US$ Mn), 2012-2016
TABLE 2 Global Microbiome Sequencing Services Market Value (US$ Mn), 2017-2022
TABLE 3 Global Microbiome Sequencing Services Market Value (US$ Mn) and Y-o-Y, 2015-2022
TABLE 4 Global Sequencing By Synthesis Segment Value (US$ Mn), By Region 2012-2016
TABLE 5 Global Sequencing By Synthesis Segment Value (US$ Mn), By Region 2017-2022
TABLE 6 Global Sequencing By Synthesis Segment Market Share, By Region 2012-2016
TABLE 7 Global Sequencing By Synthesis Segment Market Share, By Region 2017-2022
TABLE 8 Global Sequencing By Synthesis Segment Y-o-Y, By Region 2015-2022
TABLE 9 Global Sequencing By Ligation Segment Value (US$ Mn), By Region 2012-2016
TABLE 10 Global Sequencing By Ligation Segment Value (US$ Mn), By Region 2017-2022
TABLE 11 Global Sequencing By Ligation Segment Market Share, By Region 2012-2016
TABLE 12 Global Sequencing By Ligation Segment Market Share, By Region 2017-2022
TABLE 13 Global Sequencing By Ligation Segment Y-o-Y, By Region 2015-2022
TABLE 14 Global Pyrosequencing Segment Value (US$ Mn), By Region 2012-2016
TABLE 15 Global Pyrosequencing Segment Value (US$ Mn), By Region 2017-2022
TABLE 16 Global Pyrosequencing Segment Market Share, By Region 2012-2016
TABLE 17 Global Pyrosequencing Segment Market Share, By Region 2017-2022
TABLE 18 Global Pyrosequencing Segment Y-o-Y, By Region 2015-2022
TABLE 19 Global Sanger Sequencing Segment Value (US$ Mn), By Region 2012-2016
TABLE 20 Global Sanger Sequencing Segment Value (US$ Mn), By Region 2017-2022
TABLE 21 Global Sanger Sequencing Segment Market Share, By Region 2012-2016
TABLE 22 Global Sanger Sequencing Segment Market Share, By Region 2017-2022
TABLE 23 Global Sanger Sequencing Segment Y-o-Y, By Region 2015-2022
TABLE 24 Global Other Technologies Segment Value (US$ Mn), By Region 2012-2016
TABLE 25 Global Other Technologies Segment Value (US$ Mn), By Region 2017-2022
TABLE 26 Global Other Technologies Segment Market Share, By Region 2012-2016
TABLE 27 Global Other Technologies Segment Market Share, By Region 2017-2022
TABLE 28 Global Other Technologies Segment Y-o-Y, By Region 2015-2022
TABLE 29 Global Pharmaceutical Companies Segment Value (US$ Mn), By Region 2012-2016
TABLE 30 Global Pharmaceutical Companies Segment Value (US$ Mn), By Region 2017-2022
TABLE 31 Global Pharmaceutical Companies Segment Market Share, By Region 2012-2016
TABLE 32 Global Pharmaceutical Companies Segment Market Share, By Region 2017-2022
TABLE 33 Global Pharmaceutical Companies Segment Y-o-Y, By Region 2015-2022
TABLE 34 Global Academic and Research Institutes Segment Value (US$ Mn), By Region 2012-2016
TABLE 35 Global Academic and Research Institutes Segment Value (US$ Mn), By Region 2017-2022
TABLE 36 Global Academic and Research Institutes Segment Market Share, By Region 2012-2016
TABLE 37 Global Academic and Research Institutes Segment Market Share, By Region 2017-2022
TABLE 38 Global Academic and Research Institutes Segment Y-o-Y, By Region 2015-2022
TABLE 39 Global Biotech Companies Segment Value (US$ Mn), By Region 2012-2016
TABLE 40 Global Biotech Companies Segment Value (US$ Mn), By Region 2017-2022
TABLE 41 Global Biotech Companies Segment Market Share, By Region 2012-2016
TABLE 42 Global Biotech Companies Segment Market Share, By Region 2017-2022
TABLE 43 Global Biotech Companies Segment Y-o-Y, By Region 2015-2022
TABLE 44 Global Shotgun Sequencing Segment Value (US$ Mn), By Region 2012-2016
TABLE 45 Global Shotgun Sequencing Segment Value (US$ Mn), By Region 2017-2022
TABLE 46 Global Shotgun Sequencing Segment Market Share, By Region 2012-2016
TABLE 47 Global Shotgun Sequencing Segment Market Share, By Region 2017-2022
TABLE 48 Global Shotgun Sequencing Segment Y-o-Y, By Region 2015-2022
TABLE 49 Global Targeted Gene Sequencing Segment Value (US$ Mn), By Region 2012-2016
TABLE 50 Global Targeted Gene Sequencing Segment Value (US$ Mn), By Region 2017-2022
TABLE 51 Global Targeted Gene Sequencing Segment Market Share, By Region 2012-2016
TABLE 52 Global Targeted Gene Sequencing Segment Market Share, By Region 2017-2022
TABLE 53 Global Targeted Gene Sequencing Segment Y-o-Y, By Region 2015-2022
TABLE 54 Global RNA Sequencing Segment Value (US$ Mn), By Region 2012-2016
TABLE 55 Global RNA Sequencing Segment Value (US$ Mn), By Region 2017-2022
TABLE 56 Global RNA Sequencing Segment Market Share, By Region 2012-2016
TABLE 57 Global RNA Sequencing Segment Market Share, By Region 2017-2022
TABLE 58 Global RNA Sequencing Segment Y-o-Y, By Region 2015-2022
TABLE 59 Global Whole Genome Sequencing Segment Value (US$ Mn), By Region 2012-2016
TABLE 60 Global Whole Genome Sequencing Segment Value (US$ Mn), By Region 2017-2022
TABLE 61 Global Whole Genome Sequencing Segment Market Share, By Region 2012-2016
TABLE 62 Global Whole Genome Sequencing Segment Market Share, By Region 2017-2022
TABLE 63 Global Whole Genome Sequencing Segment Y-o-Y, By Region 2015-2022
TABLE 64 Global Other Applications Segment Value (US$ Mn), By Region 2012-2016
TABLE 65 Global Other Applications Segment Value (US$ Mn), By Region 2017-2022
TABLE 66 Global Other Applications Segment Market Share, By Region 2012-2016
TABLE 67 Global Other Applications Segment Market Share, By Region 2017-2022
TABLE 68 Global Other Applications Segment Y-o-Y, By Region 2015-2022
TABLE 69 North America Microbiome Sequencing Services Market Value (US$ Mn), By Technique 2012-2016
TABLE 70 North America Microbiome Sequencing Services Market Value (US$ Mn), By Technique 2017-2022
TABLE 71 North America Microbiome Sequencing Services Market Value (US$ Mn), By End User 2012-2016
TABLE 72 North America Microbiome Sequencing Services Market Value (US$ Mn), By End User 2017-2022
TABLE 73 North America Microbiome Sequencing Services Market Value (US$ Mn), By Application 2012-2016
TABLE 74 North America Microbiome Sequencing Services Market Value (US$ Mn), By Application 2017-2022
TABLE 75 Latin America Microbiome Sequencing Services Market Value (US$ Mn), By Technique 2012-2016
TABLE 76 Latin America Microbiome Sequencing Services Market Value (US$ Mn), By Technique 2017-2022
TABLE 77 Latin America Microbiome Sequencing Services Market Value (US$ Mn), By End User 2012-2016
TABLE 78 Latin America Microbiome Sequencing Services Market Value (US$ Mn), By End User 2017-2022
TABLE 79 Latin America Microbiome Sequencing Services Market Value (US$ Mn), By Application 2012-2016
TABLE 80 Latin America Microbiome Sequencing Services Market Value (US$ Mn), By Application 2017-2022
TABLE 81 Europe Microbiome Sequencing Services Market Value (US$ Mn), By Technique 2012-2016
TABLE 82 Europe Microbiome Sequencing Services Market Value (US$ Mn), By Technique 2017-2022
TABLE 83 Europe Microbiome Sequencing Services Market Value (US$ Mn), By End User 2012-2016
TABLE 84 Europe Microbiome Sequencing Services Market Value (US$ Mn), By End User 2017-2022
TABLE 85 Europe Microbiome Sequencing Services Market Value (US$ Mn), By Application 2012-2016
TABLE 86 Europe Microbiome Sequencing Services Market Value (US$ Mn), By Application 2017-2022
TABLE 87 Japan Microbiome Sequencing Services Market Value (US$ Mn), By Technique 2012-2016
TABLE 88 Japan Microbiome Sequencing Services Market Value (US$ Mn), By Technique 2017-2022
TABLE 89 Japan Microbiome Sequencing Services Market Value (US$ Mn), By End User 2012-2016
TABLE 90 Japan Microbiome Sequencing Services Market Value (US$ Mn), By End User 2017-2022
TABLE 91 Japan Microbiome Sequencing Services Market Value (US$ Mn), By Application 2012-2016
TABLE 92 Japan Microbiome Sequencing Services Market Value (US$ Mn), By Application 2017-2022
TABLE 93 APEJ Microbiome Sequencing Services Market Value (US$ Mn), By Technique 2012-2016
TABLE 94 APEJ Microbiome Sequencing Services Market Value (US$ Mn), By Technique 2017-2022
TABLE 95 APEJ Microbiome Sequencing Services Market Value (US$ Mn), By End User 2012-2016
TABLE 96 APEJ Microbiome Sequencing Services Market Value (US$ Mn), By End User 2017-2022
TABLE 97 APEJ Microbiome Sequencing Services Market Value (US$ Mn), By Application 2012-2016
TABLE 98 APEJ Microbiome Sequencing Services Market Value (US$ Mn), By Application 2017-2022
TABLE 99 MEA Microbiome Sequencing Services Market Value (US$ Mn), By Technique 2012-2016
TABLE 100 MEA Microbiome Sequencing Services Market Value (US$ Mn), By Technique 2017-2022
TABLE 101 MEA Microbiome Sequencing Services Market Value (US$ Mn), By End User 2012-2016
TABLE 102 MEA Microbiome Sequencing Services Market Value (US$ Mn), By End User 2017-2022
TABLE 103 MEA Microbiome Sequencing Services Market Value (US$ Mn), By Application 2012-2016
TABLE 104 MEA Microbiome Sequencing Services Market Value (US$ Mn), By Application 2017-2022
TABLE 105 US Microbiome Sequencing Services Market Value (US$ Mn), By Technique 2012-2016
TABLE 106 US Microbiome Sequencing Services Market Value (US$ Mn), By Technique 2017-2022
TABLE 107 US Microbiome Sequencing Services Market Value (US$ Mn), By End User 2012-2016
TABLE 108 US Microbiome Sequencing Services Market Value (US$ Mn), By End User 2017-2022
TABLE 109 US Microbiome Sequencing Services Market Value (US$ Mn), By Application 2012-2016
TABLE 110 US Microbiome Sequencing Services Market Value (US$ Mn), By Application 2017-2022
TABLE 111 Canada Microbiome Sequencing Services Market Value (US$ Mn), By Technique 2012-2016
TABLE 112 Canada Microbiome Sequencing Services Market Value (US$ Mn), By Technique 2017-2022
TABLE 113 Canada Microbiome Sequencing Services Market Value (US$ Mn), By End User 2012-2016
TABLE 114 Canada Microbiome Sequencing Services Market Value (US$ Mn), By End User 2017-2022
TABLE 115 Canada Microbiome Sequencing Services Market Value (US$ Mn), By Application 2012-2016
TABLE 116 Canada Microbiome Sequencing Services Market Value (US$ Mn), By Application 2017-2022
TABLE 117 Brazil Microbiome Sequencing Services Market Value (US$ Mn), By Technique 2012-2016
TABLE 118 Brazil Microbiome Sequencing Services Market Value (US$ Mn), By Technique 2017-2022
TABLE 119 Brazil Microbiome Sequencing Services Market Value (US$ Mn), By End User 2012-2016
TABLE 120 Brazil Microbiome Sequencing Services Market Value (US$ Mn), By End User 2017-2022
TABLE 121 Brazil Microbiome Sequencing Services Market Value (US$ Mn), By Application 2012-2016
TABLE 122 Brazil Microbiome Sequencing Services Market Value (US$ Mn), By Application 2017-2022
TABLE 123 Mexico Microbiome Sequencing Services Market Value (US$ Mn), By Technique 2012-2016
TABLE 124 Mexico Microbiome Sequencing Services Market Value (US$ Mn), By Technique 2017-2022
TABLE 125 Mexico Microbiome Sequencing Services Market Value (US$ Mn), By End User 2012-2016
TABLE 126 Mexico Microbiome Sequencing Services Market Value (US$ Mn), By End User 2017-2022
TABLE 127 Mexico Microbiome Sequencing Services Market Value (US$ Mn), By Application 2012-2016
TABLE 128 Mexico Microbiome Sequencing Services Market Value (US$ Mn), By Application 2017-2022
TABLE 129 Argentina Microbiome Sequencing Services Market Value (US$ Mn), By Technique 2012-2016
TABLE 130 Argentina Microbiome Sequencing Services Market Value (US$ Mn), By Technique 2017-2022
TABLE 131 Argentina Microbiome Sequencing Services Market Value (US$ Mn), By End User 2012-2016
TABLE 132 Argentina Microbiome Sequencing Services Market Value (US$ Mn), By End User 2017-2022
TABLE 133 Argentina Microbiome Sequencing Services Market Value (US$ Mn), By Application 2012-2016
TABLE 134 Argentina Microbiome Sequencing Services Market Value (US$ Mn), By Application 2017-2022
TABLE 135 Germany Microbiome Sequencing Services Market Value (US$ Mn), By Technique 2012-2016
TABLE 136 Germany Microbiome Sequencing Services Market Value (US$ Mn), By Technique 2017-2022
TABLE 137 Germany Microbiome Sequencing Services Market Value (US$ Mn), By End User 2012-2016
TABLE 138 Germany Microbiome Sequencing Services Market Value (US$ Mn), By End User 2017-2022
TABLE 139 Germany Microbiome Sequencing Services Market Value (US$ Mn), By Application 2012-2016
TABLE 140 Germany Microbiome Sequencing Services Market Value (US$ Mn), By Application 2017-2022
TABLE 141 UK Microbiome Sequencing Services Market Value (US$ Mn), By Technique 2012-2016
TABLE 142 UK Microbiome Sequencing Services Market Value (US$ Mn), By Technique 2017-2022
TABLE 143 UK Microbiome Sequencing Services Market Value (US$ Mn), By End User 2012-2016
TABLE 144 UK Microbiome Sequencing Services Market Value (US$ Mn), By End User 2017-2022
TABLE 145 UK Microbiome Sequencing Services Market Value (US$ Mn), By Application 2012-2016
TABLE 146 UK Microbiome Sequencing Services Market Value (US$ Mn), By Application 2017-2022
TABLE 147 France Microbiome Sequencing Services Market Value (US$ Mn), By Technique 2012-2016
TABLE 148 France Microbiome Sequencing Services Market Value (US$ Mn), By Technique 2017-2022
TABLE 149 France Microbiome Sequencing Services Market Value (US$ Mn), By End User 2012-2016
TABLE 150 France Microbiome Sequencing Services Market Value (US$ Mn), By End User 2017-2022
TABLE 151 France Microbiome Sequencing Services Market Value (US$ Mn), By Application 2012-2016
TABLE 152 France Microbiome Sequencing Services Market Value (US$ Mn), By Application 2017-2022
TABLE 153 Spain Microbiome Sequencing Services Market Value (US$ Mn), By Technique 2012-2016
TABLE 154 Spain Microbiome Sequencing Services Market Value (US$ Mn), By Technique 2017-2022
TABLE 155 Spain Microbiome Sequencing Services Market Value (US$ Mn), By End User 2012-2016
TABLE 156 Spain Microbiome Sequencing Services Market Value (US$ Mn), By End User 2017-2022
TABLE 157 Spain Microbiome Sequencing Services Market Value (US$ Mn), By Application 2012-2016
TABLE 158 Spain Microbiome Sequencing Services Market Value (US$ Mn), By Application 2017-2022
TABLE 159 Italy Microbiome Sequencing Services Market Value (US$ Mn), By Technique 2012-2016
TABLE 160 Italy Microbiome Sequencing Services Market Value (US$ Mn), By Technique 2017-2022
TABLE 161 Italy Microbiome Sequencing Services Market Value (US$ Mn), By End User 2012-2016
TABLE 162 Italy Microbiome Sequencing Services Market Value (US$ Mn), By End User 2017-2022
TABLE 163 Italy Microbiome Sequencing Services Market Value (US$ Mn), By Application 2012-2016
TABLE 164 Italy Microbiome Sequencing Services Market Value (US$ Mn), By Application 2017-2022
TABLE 165 Nordic Microbiome Sequencing Services Market Value (US$ Mn), By Technique 2012-2016
TABLE 166 Nordic Microbiome Sequencing Services Market Value (US$ Mn), By Technique 2017-2022
TABLE 167 Nordic Microbiome Sequencing Services Market Value (US$ Mn), By End User 2012-2016
TABLE 168 Nordic Microbiome Sequencing Services Market Value (US$ Mn), By End User 2017-2022
TABLE 169 Nordic Microbiome Sequencing Services Market Value (US$ Mn), By Application 2012-2016
TABLE 170 Nordic Microbiome Sequencing Services Market Value (US$ Mn), By Application 2017-2022
TABLE 171 Japan Microbiome Sequencing Services Market Value (US$ Mn), By Technique 2012-2016
TABLE 172 Japan Microbiome Sequencing Services Market Value (US$ Mn), By Technique 2017-2022
TABLE 173 Japan Microbiome Sequencing Services Market Value (US$ Mn), By End User 2012-2016
TABLE 174 Japan Microbiome Sequencing Services Market Value (US$ Mn), By End User 2017-2022
TABLE 175 Japan Microbiome Sequencing Services Market Value (US$ Mn), By Application 2012-2016
TABLE 176 Japan Microbiome Sequencing Services Market Value (US$ Mn), By Application 2017-2022
TABLE 177 China Microbiome Sequencing Services Market Value (US$ Mn), By Technique 2012-2016
TABLE 178 China Microbiome Sequencing Services Market Value (US$ Mn), By Technique 2017-2022
TABLE 179 China Microbiome Sequencing Services Market Value (US$ Mn), By End User 2012-2016
TABLE 180 China Microbiome Sequencing Services Market Value (US$ Mn), By End User 2017-2022
TABLE 181 China Microbiome Sequencing Services Market Value (US$ Mn), By Application 2012-2016
TABLE 182 China Microbiome Sequencing Services Market Value (US$ Mn), By Application 2017-2022
TABLE 183 India Microbiome Sequencing Services Market Value (US$ Mn), By Technique 2012-2016
TABLE 184 India Microbiome Sequencing Services Market Value (US$ Mn), By Technique 2017-2022
TABLE 185 India Microbiome Sequencing Services Market Value (US$ Mn), By End User 2012-2016
TABLE 186 India Microbiome Sequencing Services Market Value (US$ Mn), By End User 2017-2022
TABLE 187 India Microbiome Sequencing Services Market Value (US$ Mn), By Application 2012-2016
TABLE 188 India Microbiome Sequencing Services Market Value (US$ Mn), By Application 2017-2022
TABLE 189 Malaysia Microbiome Sequencing Services Market Value (US$ Mn), By Technique 2012-2016
TABLE 190 Malaysia Microbiome Sequencing Services Market Value (US$ Mn), By Technique 2017-2022
TABLE 191 Malaysia Microbiome Sequencing Services Market Value (US$ Mn), By End User 2012-2016
TABLE 192 Malaysia Microbiome Sequencing Services Market Value (US$ Mn), By End User 2017-2022
TABLE 193 Malaysia Microbiome Sequencing Services Market Value (US$ Mn), By Application 2012-2016
TABLE 194 Malaysia Microbiome Sequencing Services Market Value (US$ Mn), By Application 2017-2022
TABLE 195 Thailand Microbiome Sequencing Services Market Value (US$ Mn), By Technique 2012-2016
TABLE 196 Thailand Microbiome Sequencing Services Market Value (US$ Mn), By Technique 2017-2022
TABLE 197 Thailand Microbiome Sequencing Services Market Value (US$ Mn), By End User 2012-2016
TABLE 198 Thailand Microbiome Sequencing Services Market Value (US$ Mn), By End User 2017-2022
TABLE 199 Thailand Microbiome Sequencing Services Market Value (US$ Mn), By Application 2012-2016
TABLE 200 Thailand Microbiome Sequencing Services Market Value (US$ Mn), By Application 2017-2022
TABLE 201 Singapore Microbiome Sequencing Services Market Value (US$ Mn), By Technique 2012-2016
TABLE 202 Singapore Microbiome Sequencing Services Market Value (US$ Mn), By Technique 2017-2022
TABLE 203 Singapore Microbiome Sequencing Services Market Value (US$ Mn), By End User 2012-2016
TABLE 204 Singapore Microbiome Sequencing Services Market Value (US$ Mn), By End User 2017-2022
TABLE 205 Singapore Microbiome Sequencing Services Market Value (US$ Mn), By Application 2012-2016
TABLE 206 Singapore Microbiome Sequencing Services Market Value (US$ Mn), By Application 2017-2022
TABLE 207 Australia Microbiome Sequencing Services Market Value (US$ Mn), By Technique 2012-2016
TABLE 208 Australia Microbiome Sequencing Services Market Value (US$ Mn), By Technique 2017-2022
TABLE 209 Australia Microbiome Sequencing Services Market Value (US$ Mn), By End User 2012-2016
TABLE 210 Australia Microbiome Sequencing Services Market Value (US$ Mn), By End User 2017-2022
TABLE 211 Australia Microbiome Sequencing Services Market Value (US$ Mn), By Application 2012-2016
TABLE 212 Australia Microbiome Sequencing Services Market Value (US$ Mn), By Application 2017-2022
TABLE 213 GCC Countries Microbiome Sequencing Services Market Value (US$ Mn), By Technique 2012-2016
TABLE 214 GCC Countries Microbiome Sequencing Services Market Value (US$ Mn), By Technique 2017-2022
TABLE 215 GCC Countries Microbiome Sequencing Services Market Value (US$ Mn), By End User 2012-2016
TABLE 216 GCC Countries Microbiome Sequencing Services Market Value (US$ Mn), By End User 2017-2022
TABLE 217 GCC Countries Microbiome Sequencing Services Market Value (US$ Mn), By Application 2012-2016
TABLE 218 GCC Countries Microbiome Sequencing Services Market Value (US$ Mn), By Application 2017-2022
TABLE 219 South Africa Microbiome Sequencing Services Market Value (US$ Mn), By Technique 2012-2016
TABLE 220 South Africa Microbiome Sequencing Services Market Value (US$ Mn), By Technique 2017-2022
TABLE 221 South Africa Microbiome Sequencing Services Market Value (US$ Mn), By End User 2012-2016
TABLE 222 South Africa Microbiome Sequencing Services Market Value (US$ Mn), By End User 2017-2022
TABLE 223 South Africa Microbiome Sequencing Services Market Value (US$ Mn), By Application 2012-2016
TABLE 224 South Africa Microbiome Sequencing Services Market Value (US$ Mn), By Application 2017-2022
TABLE 225 Nigeria Microbiome Sequencing Services Market Value (US$ Mn), By Technique 2012-2016
TABLE 226 Nigeria Microbiome Sequencing Services Market Value (US$ Mn), By Technique 2017-2022
TABLE 227 Nigeria Microbiome Sequencing Services Market Value (US$ Mn), By End User 2012-2016
TABLE 228 Nigeria Microbiome Sequencing Services Market Value (US$ Mn), By End User 2017-2022
TABLE 229 Nigeria Microbiome Sequencing Services Market Value (US$ Mn), By Application 2012-2016
TABLE 230 Nigeria Microbiome Sequencing Services Market Value (US$ Mn), By Application 2017-2022
TABLE 231 Israel Microbiome Sequencing Services Market Value (US$ Mn), By Technique 2012-2016
TABLE 232 Israel Microbiome Sequencing Services Market Value (US$ Mn), By Technique 2017-2022
TABLE 233 Israel Microbiome Sequencing Services Market Value (US$ Mn), By End User 2012-2016
TABLE 234 Israel Microbiome Sequencing Services Market Value (US$ Mn), By End User 2017-2022
TABLE 235 Israel Microbiome Sequencing Services Market Value (US$ Mn), By Application 2012-2016
TABLE 236 Israel Microbiome Sequencing Services Market Value (US$ Mn), By Application 2017-2022
List of Figures
FIG. 1 Global Microbiome Sequencing Services Market Value (US$ Mn), 2012-2016
FIG. 2 Global Microbiome Sequencing Services Market Value (US$ Mn) Forecast, 2017-2022
FIG. 3 Global Microbiome Sequencing Services Market Value (US$ Mn) and Y-o-Y, 2015-2022
FIG. 4 Global Sequencing By Synthesis Segment Market Value (US$ Mn) By Region, 2012-2016
FIG. 5 Global Sequencing By Synthesis Segment Market Value (US$ Mn) By Region, 2017-2022
FIG. 6 Global Sequencing By Synthesis Segment Y-o-Y Growth Rate, By Region, 2015-2022
FIG. 7 Global Sequencing By Ligation Segment Market Value (US$ Mn) By Region, 2012-2016
FIG. 8 Global Sequencing By Ligation Segment Market Value (US$ Mn) By Region, 2017-2022
FIG. 9 Global Sequencing By Ligation Segment Y-o-Y Growth Rate, By Region, 2015-2022
FIG. 10 Global Pyrosequencing Segment Market Value (US$ Mn) By Region, 2012-2016
FIG. 11 Global Pyrosequencing Segment Market Value (US$ Mn) By Region, 2017-2022
FIG. 12 Global Pyrosequencing Segment Y-o-Y Growth Rate, By Region, 2015-2022
FIG. 13 Global Sanger Sequencing Segment Market Value (US$ Mn) By Region, 2012-2016
FIG. 14 Global Sanger Sequencing Segment Market Value (US$ Mn) By Region, 2017-2022
FIG. 15 Global Sanger Sequencing Segment Y-o-Y Growth Rate, By Region, 2015-2022
FIG. 16 Global Other Technologies Segment Market Value (US$ Mn) By Region, 2012-2016
FIG. 17 Global Other Technologies Segment Market Value (US$ Mn) By Region, 2017-2022
FIG. 18 Global Other Technologies Segment Y-o-Y Growth Rate, By Region, 2015-2022
FIG. 19 Global Pharmaceutical Companies Segment Market Value (US$ Mn) By Region, 2012-2016
FIG. 20 Global Pharmaceutical Companies Segment Market Value (US$ Mn) By Region, 2017-2022
FIG. 21 Global Pharmaceutical Companies Segment Y-o-Y Growth Rate, By Region, 2015-2022
FIG. 22 Global Academic and Research Institutes Segment Market Value (US$ Mn) By Region, 2012-2016
FIG. 23 Global Academic and Research Institutes Segment Market Value (US$ Mn) By Region, 2017-2022
FIG. 24 Global Academic and Research Institutes Segment Y-o-Y Growth Rate, By Region, 2015-2022
FIG. 25 Global Biotech Companies Segment Market Value (US$ Mn) By Region, 2012-2016
FIG. 26 Global Biotech Companies Segment Market Value (US$ Mn) By Region, 2017-2022
FIG. 27 Global Biotech Companies Segment Y-o-Y Growth Rate, By Region, 2015-2022
FIG. 28 Global Shotgun Sequencing Segment Market Value (US$ Mn) By Region, 2012-2016
FIG. 29 Global Shotgun Sequencing Segment Market Value (US$ Mn) By Region, 2017-2022
FIG. 30 Global Shotgun Sequencing Segment Y-o-Y Growth Rate, By Region, 2015-2022
FIG. 31 Global Targeted Gene Sequencing Segment Market Value (US$ Mn) By Region, 2012-2016
FIG. 32 Global Targeted Gene Sequencing Segment Market Value (US$ Mn) By Region, 2017-2022
FIG. 33 Global Targeted Gene Sequencing Segment Y-o-Y Growth Rate, By Region, 2015-2022
FIG. 34 Global RNA Sequencing Segment Market Value (US$ Mn) By Region, 2012-2016
FIG. 35 Global RNA Sequencing Segment Market Value (US$ Mn) By Region, 2017-2022
FIG. 36 Global RNA Sequencing Segment Y-o-Y Growth Rate, By Region, 2015-2022
FIG. 37 Global Whole Genome Sequencing Segment Market Value (US$ Mn) By Region, 2012-2016
FIG. 38 Global Whole Genome Sequencing Segment Market Value (US$ Mn) By Region, 2017-2022
FIG. 39 Global Whole Genome Sequencing Segment Y-o-Y Growth Rate, By Region, 2015-2022
FIG. 40 Global Other Applications Segment Market Value (US$ Mn) By Region, 2012-2016
FIG. 41 Global Other Applications Segment Market Value (US$ Mn) By Region, 2017-2022
FIG. 42 Global Other Applications Segment Y-o-Y Growth Rate, By Region, 2015-2022
FIG. 43 North America Microbiome Sequencing Services Market Value (US$ Mn), By Technique 2012-2016
FIG. 44 North America Microbiome Sequencing Services Market Value (US$ Mn), By Technique 2017-2022
FIG. 45 North America Microbiome Sequencing Services Market Value (US$ Mn), By End User 2012-2016
FIG. 46 North America Microbiome Sequencing Services Market Value (US$ Mn), By End User 2017-2022
FIG. 47 North America Microbiome Sequencing Services Market Value (US$ Mn), By Application 2012-2016
FIG. 48 North America Microbiome Sequencing Services Market Value (US$ Mn), By Application 2017-2022
FIG. 49 Latin America Microbiome Sequencing Services Market Value (US$ Mn), By Technique 2012-2016
FIG. 50 Latin America Microbiome Sequencing Services Market Value (US$ Mn), By Technique 2017-2022
FIG. 51 Latin America Microbiome Sequencing Services Market Value (US$ Mn), By End User 2012-2016
FIG. 52 Latin America Microbiome Sequencing Services Market Value (US$ Mn), By End User 2017-2022
FIG. 53 Latin America Microbiome Sequencing Services Market Value (US$ Mn), By Application 2012-2016
FIG. 54 Latin America Microbiome Sequencing Services Market Value (US$ Mn), By Application 2017-2022
FIG. 55 Europe Microbiome Sequencing Services Market Value (US$ Mn), By Technique 2012-2016
FIG. 56 Europe Microbiome Sequencing Services Market Value (US$ Mn), By Technique 2017-2022
FIG. 57 Europe Microbiome Sequencing Services Market Value (US$ Mn), By End User 2012-2016
FIG. 58 Europe Microbiome Sequencing Services Market Value (US$ Mn), By End User 2017-2022
FIG. 59 Europe Microbiome Sequencing Services Market Value (US$ Mn), By Application 2012-2016
FIG. 60 Europe Microbiome Sequencing Services Market Value (US$ Mn), By Application 2017-2022
FIG. 61 Japan Microbiome Sequencing Services Market Value (US$ Mn), By Technique 2012-2016
FIG. 62 Japan Microbiome Sequencing Services Market Value (US$ Mn), By Technique 2017-2022
FIG. 63 Japan Microbiome Sequencing Services Market Value (US$ Mn), By End User 2012-2016
FIG. 64 Japan Microbiome Sequencing Services Market Value (US$ Mn), By End User 2017-2022
FIG. 65 Japan Microbiome Sequencing Services Market Value (US$ Mn), By Application 2012-2016
FIG. 66 Japan Microbiome Sequencing Services Market Value (US$ Mn), By Application 2017-2022
FIG. 67 APEJ Microbiome Sequencing Services Market Value (US$ Mn), By Technique 2012-2016
FIG. 68 APEJ Microbiome Sequencing Services Market Value (US$ Mn), By Technique 2017-2022
FIG. 69 APEJ Microbiome Sequencing Services Market Value (US$ Mn), By End User 2012-2016
FIG. 70 APEJ Microbiome Sequencing Services Market Value (US$ Mn), By End User 2017-2022
FIG. 71 APEJ Microbiome Sequencing Services Market Value (US$ Mn), By Application 2012-2016
FIG. 72 APEJ Microbiome Sequencing Services Market Value (US$ Mn), By Application 2017-2022
FIG. 73 MEA Microbiome Sequencing Services Market Value (US$ Mn), By Technique 2012-2016
FIG. 74 MEA Microbiome Sequencing Services Market Value (US$ Mn), By Technique 2017-2022
FIG. 75 MEA Microbiome Sequencing Services Market Value (US$ Mn), By End User 2012-2016
FIG. 76 MEA Microbiome Sequencing Services Market Value (US$ Mn), By End User 2017-2022
FIG. 77 MEA Microbiome Sequencing Services Market Value (US$ Mn), By Application 2012-2016
FIG. 78 MEA Microbiome Sequencing Services Market Value (US$ Mn), By Application 2017-2022
Copyright © Transparency Market Research, Inc. All Rights reserved
Trust Online

Microbiome Sequencing Services Market