
Reports
Reports
Global Image Guided Surgery Devices Market: Snapshot
Conventional surgical procedures are time consuming and less accurate, with risk of hazards to nearby nonsurgical area involved. Hence, demand for surgical techniques with enhanced accuracy and lesser turnaround time is increasing rapidly. Image guided surgical techniques offer advantages such as rapid surgical wound healing, minimum surgical scars and enhanced accuracy during surgical operations. Therefore, demand for image guided surgical procedures is increasing rapidly across the world.
Demand from Neurosurgery Application Segment to Scale at a Higher Pace
The global image guided surgery devices market is divided into four segments: By device type, by application, by end user and by geography. Based on device type, the global image guided surgery devices market has been segmented into computed tomography scanners, ultrasound systems, magnetic resonance imaging, endoscope, x-ray fluoroscopy, positron emission tomography, single photon emission computed tomography. The computed tomography scanners segment accounted for the largest share in 2016. Computed tomography scanners have wide applications from tumor detection to imaging of soft tissue structures such as fat, lung and liver tissues. Moreover, turnaround time of computed tomography scanners is much lesser, which is beneficial for critical and complicated surgeries.
Based on application, the image guided surgery devices market is segmented into cardiac surgery, neurosurgery, orthopedic surgery, urology, gastroenterology, oncology surgery and others (ENT, dental, pulmonary surgery). The neurosurgery application segment accounted for the largest share in 2016. Minimum risk of hazards to nonsurgical sites in the brain and increase in accuracy in operating procedures are the major factors driving the neurosurgery application segment. Factors such as rising incidence of road accidents and increasing geriatric population are anticipated to fuel demand for orthopedic image guided surgeries during the forecast period. For instance, according to the Association for Safe International Road Travel (ASIRT), around 20 million to 50 million people are disabled or injured by road accidents globally every year. Considering the high number of road accidents, demand for orthopedic surgeries with image guided technology is expected to rise in the near future. Based on end user, the image guided surgery devices market is segmented into hospitals, ambulatory surgical centers, clinics, and research & academic institutes.
Favorable Reimbursement Policies in North America and Europe Aid Market’s Expansion
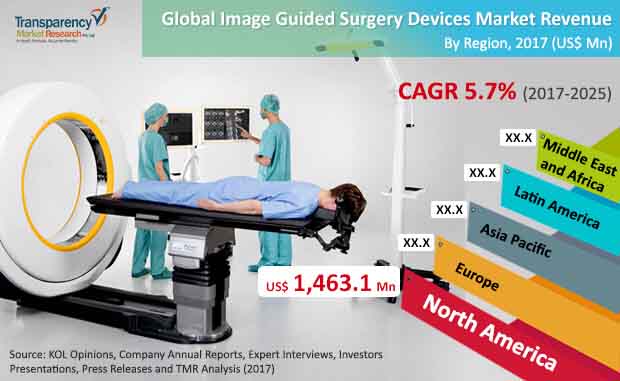
Geographically, the image guided surgery devices market has been categorized into five regions: North America, Europe, Asia Pacific, Latin America, and Middle East & Africa. North America was the largest market in 2016, followed by Europe. High health care expenditure, reimbursement coverage, high rate of adoption of new technologies and availability of skilled health care professionals to perform technically advanced surgeries are some of the factors driving the growth of the image guided surgery devices market in North America and Europe. On the other hand, the image guided surgery devices market in Asia Pacific is anticipated to grow at the higher CAGR compared to other regions during the forecast period from 2017 to 2025. Rapidly growing medical tourism industry is boosting demand for image guided surgeries in Asia Pacific. Moreover, government initiatives to support the growth of the health care industry and rising disposable income are some of the factors anticipated to support the growth of the image guided surgery devices market in Asia Pacific. The image guided surgery devices market in Latin America is a promising market, offering significant growth opportunities due to the presence of regulatory framework and increasing awareness about the benefits of image guided surgeries.
Major players operating in the global image guided surgery devices market are GE Healthcare, Siemens Healthineers, Olympus Corporation, Medtronic, Koninklijke Philips N.V., Analogic Corporation, Brainlab AG, KARL STORZ GmbH & Co. KG, Stryker, Varian Medical Systems, Inc. These players exhibit the larger geographical outreach with presence in multiple Image Guided Surgery Devices product categories.
Advancement in technology will add Impetus to Global Image Guided Surgery Devices Market
The increasing demand for surgical techniques with time and accuracy efficiency is likely to aid in expansion of the global image guided surgery devices market. Image guided careful methods offer favorable circumstances, for example, fast careful injury recuperating, least careful scars and improved precision during careful tasks. Hence, interest for picture guided surgeries is expanding quickly across the world.
The drive for precision, expandability, and comfort in careful route frameworks is a key factor making new roads in the picture guided a medical procedure gadgets market. Clinical importance of these medical procedure gadgets in oncologic medical procedure has been developing, especially because of their viability in imagining tiny tumors. Among different item types, incomes created from figured tomography scanners are unmistakable. Rising application can be credited to their utilization in imaging delicate tissue structures.
As per segmentation by device type, the market is dominated by the computed tomography scanners section. This is attributable to the less turnaround time of topography scanners that can be used during complicated and critical surgeries. Regionwise, the market is dominated by North America, followed by Europe in close competition. This is owing to the increasing adoption of latest technologies, coupled with the availability of skilled health care professionals in the developed nations. On the other side, the market in Asia Pacific is expected to gain significant revenue in the coming years on account of the growing healthcare infrastructure and increasing adoption of better therapeutics for diagnostic purporses.
Some of the players functioning in the global image guided surgery devices market include Analogic Corporation, Koninklijke Philips N.V., Stryker, Olympus Corporation, GE Healthcare, Varian Medical Systems, Inc., KARL STORZ GmbH & Co. KG, Brainlab AG, Medtronic, and Siemens Healthineers,
1. Preface
1.1. Report Scope and Market Segmentation
1.2. Research Highlights
2. Acronyms and Research Methodology
2.1. Acronyms Used
2.2. Research Methodology
3. Executive Summary
3.1. Global Image Guided Surgery Devices Market Size (US$ Mn) and Share (%), by Geography, 2017 and 2025
3.2. Global Image Guided Surgery Devices Market Size (US$ Mn), by Device Type, 2017 and 2025
3.3. Market Opportunity Map
4. Market Overview
4.1. Introduction
4.2. Market Dynamics
4.2.1. Drivers
4.2.1.1 Advancements in imaging technologies
4.2.1.2. Collaboration between private and public sectors for deployment of image guided surgery devices
4.2.1.3. Rise in preference for minimally invasive surgeries over open surgery
4.2.1.4 Increase in cases of neurological disorders, cancer, and other life threatening diseases
4.2.1.3. Rise in preference for minimally invasive surgeries over open surgery
4.2.1.4 Increase in cases of neurological disorders, cancer, and other life threatening diseases
4.2.2. Restraints
4.2.2.1. High cost of image guided surgery devices
4.2.2.2. Lack of skilled professionals
4.2.3. Opportunities
4.2.3.1. Use of image-guided surgeries for broader application areas
4.2.3.2. Development of cost effective & innovative products to increase the adoption in small/mid-size hospitals and clinics
4.3. Global Image Guided Surgery Devices Market Analysis and Forecasts, 2015–2025
4.3.1. Market Revenue Projections (US$ Mn)
4.4. Porter’s Five Force Analysis
4.5. Value Chain Analysis
4.6. Market Outlook
4.7. Technology Roadmap
4.8. Installed Base Scenario
4.9. Regulations
4.10. Reimbursement Scenario
4.11. Comparative Analysis of Open Surgery & Minimally Invasive Surgery
4.12. Image Guided Surgical Procedure, By Region with Key Countries
5. Global Image Guided Surgery Devices Market Analysis and Forecasts, By Device Type
5.1. Introduction & Definition
5.2. Key Findings / Developments
5.3. Key Trends
5.4. Market Value (US$ Mn) Forecast, By Device Type, 2015–2025
5.4.1. Computed Tomography (CT) Scanners
5.4.2. Ultrasound Systems
5.4.3. Magnetic Resonance Imaging (MRI)
5.4.4. Endoscope
5.4.5. X-ray Fluoroscopy
5.4.6. Positron Emission Tomography (PET)
5.4.7. Single Photon Emission Computed Tomography (SPECT)
5.5. Market Attractiveness By Device Type
6. Global Image Guided Surgery Devices Market Analysis and Forecasts, By Application
6.1. Introduction & Definition
6.2. Key Findings / Developments
6.3. Key Trends
6.4. Market Value (US$ Mn) Forecast, By Application, 2015–2025
6.4.1. Cardiac Surgery
6.4.2. Neurosurgery
6.4.3. Orthopedic Surgery
6.4.4. Urology
6.4.5. Gastroenterology
6.4.6. Oncology Surgery
6.4.7. Others (Ear, Nose and Throat Surgery, etc.)
6.5. Market Attractiveness By Application
7. Global Image Guided Surgery Devices Market Analysis and Forecasts, By End User
7.1. Introduction & Definition
7.2. Key Findings / Developments
7.3. Key Trends
7.4. Market Value (US$ Mn) Forecast, By End User, 2015–2025
7.4.1. Hospitals
7.4.2. Ambulatory Surgical Centers
7.4.3. Clinics
7.4.4 Research & Academic Institutes
7.5. Market Attractiveness, By End User
8. Global Image Guided Surgery Devices Market Analysis and Forecasts, By Region
8.1. Key Findings
8.2. Market Value (US$ Mn) Forecast, By Region
8.2.1. North America
8.2.2. Europe
8.2.3. Asia Pacific
8.2.4. Latin America
8.2.5. Middle East & Africa
8.3. Market Attractiveness, By Region
9. North America Image Guided Surgery Devices Market Analysis and Forecast
9.1. Introduction
9.1.1. Key Findings
9.1.2. Key Trends
9.2. Market Value (US$ Mn) Forecast, By Device Type, 2015–2025
9.2.1. Computed Tomography (CT) Scanners
9.2.2. Ultrasound Systems
9.2.3. Magnetic Resonance Imaging (MRI)
9.2.4. Endoscope
9.2.5. X-ray Fluoroscopy
9.2.6. Positron Emission Tomography (PET)
9.2.7. Single Photon Emission Computed Tomography (SPECT)
9.3. Market Value (US$ Mn) Forecast, By Application, 2015–2025
9.3.1. Cardiac Surgery
9.3.2. Neurosurgery
9.3.3. Orthopedic Surgery
9.3.4. Urology
9.3.5. Gastroenterology
9.3.6. Oncology Surgery
9.3.7. Others (Ear, Nose and Throat Surgery, etc.)
9.4. Market Value (US$ Mn) Forecast, By End User, 2015–2025
9.4.1. Hospitals
9.4.2. Ambulatory Surgical Centers
9.4.3. Clinics
9.4.4 Research & Academic Institutes
9.5. Market Value (US$ Mn) Forecast, By Country, 2015–2025
9.5.1. U.S.
9.5.2. Canada
9.6. Market Attractiveness Analysis
9.6.1. By Device Type
9.6.2. By Application
9.6.3. By End User
9.6.4. By Country
10. Europe Image Guided Surgery Devices Market Analysis and Forecast
10.1. Introduction
10.1.1. Key Findings
10.1.2. Key Trends
10.2. Market Value (US$ Mn) Forecast, By Device Type, 2015–2025
10.2.1. Computed Tomography (CT) Scanners
10.2.2. Ultrasound Systems
10.2.3. Magnetic Resonance Imaging (MRI)
10.2.4. Endoscope
10.2.5. X-ray Fluoroscopy
10.2.6. Positron Emission Tomography (PET)
10.2.7. Single Photon Emission Computed Tomography (SPECT)
10.3. Market Value (US$ Mn) Forecast, By Application, 2015–2025
10.3.1. Cardiac Surgery
10.3.2. Neurosurgery
10.3.3. Orthopedic Surgery
10.3.4. Urology
10.3.5. Gastroenterology
10.3.6. Oncology Surgery
10.3.7. Others (Ear, Nose and Throat Surgery, etc.)
10.4. Market Value (US$ Mn) Forecast, By End User, 2015–2025
10.4.1. Hospitals
10.4.2. Ambulatory Surgical Centers
10.4.3. Clinics
10.4.4 Research & Academic Institutes
10.5. Market Value (US$ Mn) Forecast, By Country / Sub-Region, 2015–2025
10.5.1. Germany
10.5.2. France
10.5.3. U.K.
10.5.4. Spain
10.5.5. Italy
10.5.6. Russia
10.5.7. Rest of Europe
10.6. Market Attractiveness Analysis
10.6.1. By Device Type
10.6.2. By Application
10.6.3. By End User
10.6.4. By Country / Sub-Region
11. Asia Pacific Image Guided Surgery Devices Market Analysis and Forecast
11.1. Introduction
11.1.1. Key Findings
11.1.2. Key Trends
11.2. Market Value (US$ Mn) Forecast, By Device Type, 2015–2025
11.2.1. Computed Tomography (CT) Scanners
11.2.2. Ultrasound Systems
11.2.3. Magnetic Resonance Imaging (MRI)
11.2.4. Endoscope
11.2.5. X-ray Fluoroscopy
11.2.6. Positron Emission Tomography (PET)
11.2.7. Single Photon Emission Computed Tomography (SPECT)
11.3. Market Value (US$ Mn) Forecast, By Application, 2015–2025
11.3.1. Cardiac Surgery
11.3.2. Neurosurgery
11.3.3. Orthopedic Surgery
11.3.4. Urology
11.3.5. Gastroenterology
11.3.6. Oncology Surgery
11.3.7. Others (Ear, Nose and Throat Surgery, etc.)
11.4. Market Value (US$ Mn) Forecast, By End User, 2015–2025
11.4.1. Hospitals
11.4.2. Ambulatory Surgical Centers
11.4.3. Clinics
11.4.4 Research & Academic Institutes
11.5. Market Value (US$ Mn) Forecast, By Country / Sub-Region, 2015–2025
11.5.1. Japan
11.5.2. China
11.5.3. India
11.5.4. Australia & New Zealand
11.5.5. Rest of Asia Pacific
11.6. Market Attractiveness Analysis
11.6.1. By Device Type
11.6.2. By Application
11.6.3. By End User
11.6.4. By Country / Sub-Region
12. Latin America Image Guided Surgery Devices Market Analysis and Forecast
12.1. Introduction
12.1.1. Key Findings
12.1.2. Key Trends
12.2. Market Value (US$ Mn) Forecast, By Device Type, 2015–2025
12.2.1. Computed Tomography (CT) Scanners
12.2.2. Ultrasound Systems
12.2.3. Magnetic Resonance Imaging (MRI)
12.2.4. Endoscope
12.2.5. X-ray Fluoroscopy
12.2.6. Positron Emission Tomography (PET)
12.2.7. Single Photon Emission Computed Tomography (SPECT)
12.3. Market Value (US$ Mn) Forecast, By Application, 2015–2025
12.3.1. Cardiac Surgery
12.3.2. Neurosurgery
12.3.3. Orthopedic Surgery
12.3.4. Urology
12.3.5. Gastroenterology
12.3.6. Oncology Surgery
12.3.7. Others (Ear, Nose and Throat Surgery, etc.)
12.4. Market Value (US$ Mn) Forecast, By End User, 2015–2025
12.4.1. Hospitals
12.4.2. Ambulatory Surgical Centers
12.4.3. Clinics
12.4.4 Research & Academic Institutes
12.5. Market Value (US$ Mn) Forecast, By Country / Sub-Region, 2015–2025
12.5.1. Brazil
12.5.2. Mexico
12.5.3. Rest of Latin America
12.6. Market Attractiveness Analysis
12.6.1. By Device Type
12.6.2. By Application
12.6.3. By End User
12.6.4. By Country / Sub-Region
13. Middle East & Africa Image Guided Surgery Devices Market Analysis and Forecast
13.1. Introduction
13.1.1. Key Findings
13.1.2. Key Trends
13.2. Market Value (US$ Mn) Forecast, By Device Type, 2015–2025
13.2.1. Computed Tomography (CT) Scanners
13.2.2. Ultrasound Systems
13.2.3. Magnetic Resonance Imaging (MRI)
13.2.4. Endoscope
13.2.5. X-ray Fluoroscopy
13.2.6. Positron Emission Tomography (PET)
13.2.7. Single Photon Emission Computed Tomography (SPECT)
13.3. Market Value (US$ Mn) Forecast, By Application, 2015–2025
13.3.1. Cardiac Surgery
13.3.2. Neurosurgery
13.3.3. Orthopedic Surgery
13.3.4. Urology
13.3.5. Gastroenterology
13.3.6. Oncology Surgery
13.3.7. Others (Ear, Nose and Throat Surgery, etc.)
13.4. Market Value (US$ Mn) Forecast, By End User, 2015–2025
13.4.1. Hospitals
13.4.2. Ambulatory Surgical Centers
13.4.3. Clinics
13.4.4 Research & Academic Institutes
13.5. Market Value (US$ Mn) Forecast, By Country / Sub-Region, 2015–2025
13.5.1. GCC countries
13.5.2. South Africa
13.5.3. Israel
13.5.4. Rest of Middle East & Africa
13.6. Market Attractiveness Analysis
13.6.1. By Device Type
13.6.2. By Application
13.6.3. By End User
13.6.4. By Country / Sub-Region
14. Competition Landscape
14.1. Global Image Guided Surgery Devices Market Share Analysis, by Company, 2016
14.2. Competition Matrix
14.3. Company Profiles (Details – Overview, Financials, Recent Developments, Strategy)
14.3.1. GE Healthcare
14.3.1.1. Company Overview (HQ, Business Segments, Employee Strength)
14.3.1.2. Financial Overview
14.3.1.3. Product Portfolio
14.3.1.4. SWOT Analysis
14.3.1.5. Strategic Overview
14.3.2. Siemens Healthineers
14.3.2.1. Company Overview (HQ, Business Segments, Employee Strength)
14.3.2.2. Financial Overview
14.3.2.3. Product Portfolio
14.3.2.4. SWOT Analysis
14.3.2.5. Strategic Overview
14.3.3. Olympus Corporation
14.3.3.1. Company Overview (HQ, Business Segments, Employee Strength)
14.3.3.2. Financial Overview
14.3.3.3. Product Portfolio
14.3.3.4. SWOT Analysis
14.3.3.5. Strategic Overview
14.3.4. Medtronic
14.3.4.1. Company Overview (HQ, Business Segments, Employee Strength)
14.3.4.2. Financial Overview
14.3.4.3. Product Portfolio
14.3.4.4. SWOT Analysis
14.3.4.5. Strategic Overview
14.3.5. Koninklijke Philips N.V.
14.3.5.1. Company Overview (HQ, Business Segments, Employee Strength)
14.3.5.2. Financial Overview
14.3.5.3. Product Portfolio
14.3.5.4. SWOT Analysis
14.3.5.5. Strategic Overview
14.3.6. Analogic Corporation
14.3.6.1. Company Overview (HQ, Business Segments, Employee Strength)
14.3.6.2. Financial Overview
14.3.6.3. Product Portfolio
14.3.6.4. SWOT Analysis
14.3.6.5. Strategic Overview
14.3.7. Brainlab AG
14.3.7.1. Company Overview (HQ, Business Segments, Employee Strength)
14.3.7.2. Product Portfolio
14.3.7.3. SWOT Analysis
14.3.7.4. Strategic Overview
14.3.8. KARL STORZ GmbH & Co. KG
14.3.8.1. Company Overview (HQ, Business Segments, Employee Strength)
14.3.8.2. Product Portfolio
14.3.8.3. SWOT Analysis
14.3.8.4. Strategic Overview
14.3.9. Stryker
14.3.9.1. Company Overview (HQ, Business Segments, Employee Strength)
14.3.9.2. Financial Overview
14.3.9.3. Product Portfolio
14.3.9.4. SWOT Analysis
14.3.9.5. Strategic Overview
14.3.10. Varian Medical Systems, Inc.
14.3.10.1. Company Overview (HQ, Business Segments, Employee Strength)
14.3.10.2. Financial Overview
14.3.10.3. Product Portfolio
14.3.10.4. SWOT Analysis
14.3.10.5. Strategic Overview
List of Tables
Table 01: Global Image Guided Surgery Devices Market Revenue (US$ Mn) Forecast, by Device Type, 2015–2025
Table 02: Global Image Guided Surgery Devices Market Revenue (US$ Mn) Forecast, by Application, 2015–2025
Table 03: Global Image Guided Surgery Devices Market Revenue (US$ Mn) Forecast, by End-user, 2015–2025
Table 04: Global Image Guided Surgery Devices Market Revenue (US$ Mn) Forecast, by Region, 2015–2025
Table 05: North America Image Guided Surgery Devices Market Revenue (US$ Mn) Forecast, by Country, 2015–2025
Table 06: North America Image Guided Surgery Devices Market Revenue (US$ Mn) Forecast, by Device Type, 2015–2025
Table 07: North America Image Guided Surgery Devices Market Revenue (US$ Mn) Forecast, by Application, 2015–2025
Table 08: North America Image Guided Surgery Devices Market Revenue (US$ Mn) Forecast, by End-user, 2015–2025
Table 09: Europe Image Guided Surgery Devices Market Revenue (US$ Mn) Forecast, by Country/Sub-region, 2015–2025
Table 10: Europe Image Guided Surgery Devices Market Revenue (US$ Mn) Forecast, by Device Type, 2015–2025
Table 11: Europe Image Guided Surgery Devices Market Revenue (US$ Mn) Forecast, by Application, 2015–2025
Table 12: Europe Image Guided Surgery Devices Market Revenue (US$ Mn) Forecast, by End-user, 2015–2025
Table 13: Asia Pacific Image Guided Surgery Devices Market Revenue (US$ Mn) Forecast, by Country/Region, 2015–2025
Table 14: Asia Pacific Image Guided Surgery Devices Market Revenue (US$ Mn) Forecast, by Device Type, 2015–2025
Table 15: Asia Pacific Image Guided Surgery Devices Market Revenue (US$ Mn) Forecast, by Application, 2015–2025
Table 16: Asia Pacific Image Guided Surgery Devices Market Revenue (US$ Mn) Forecast, by End-user, 2015–2025
Table 17: Latin America Image Guided Surgery Devices Market Revenue (US$ Mn) Forecast, by Country/Sub-region, 2015–2025
Table 18: Latin America Image Guided Surgery Devices Market Revenue (US$ Mn) Forecast, by Device Type, 2015–2025
Table 19: Latin America Image Guided Surgery Devices Market Revenue (US$ Mn) Forecast, by Application, 2015–2025
Table 20: Latin America Image Guided Surgery Devices Market Revenue (US$ Mn) Forecast, by End-user, 2015–2025
Table 21: Middle East & Africa Image Guided Surgery Devices Market Revenue (US$ Mn) Forecast, by Country/Sub-region, 2015–2025
Table 22: Middle East & Africa Image Guided Surgery Devices Market Revenue (US$ Mn) Forecast, by Device Type, 2015–2025
Table 23: Middle East & Africa Image Guided Surgery Devices Market Revenue (US$ Mn) Forecast, by Application, 2015–2025
Table 24: Middle East & Africa Image Guided Surgery Devices Market Revenue (US$ Mn) Forecast, by End-user, 2015–2025
List of Figures
Figure 01: Global Image Guided Surgery Devices Market Size (US$ Mn) Forecast, 2015–2025
Figure 02: Global Image Guided Surgery Devices Market Share, by Device Type (2016)
Figure 03: Global Image Guided Surgery Devices Market Share, by Application (2016)
Figure 04: Global Image Guided Surgery Devices Market Share, by End-user (2016)
Figure 05: Global Image Guided Surgery Devices Market Share, by Region (2016)
Figure 06: Global Image Guided Surgery Devices Market Value Share, by Device Type, 2017 and 2025
Figure 07: Global Image Guided Surgery Devices Market Revenue (US$ Mn) and Y-o-Y Growth (%) Forecast, by CT Scanners, 2015–2025
Figure 08: Global Image Guided Surgery Devices Market Revenue (US$ Mn) and Y-o-Y Growth (%) Forecast, by Ultrasound Systems, 2015–2025
Figure 09: Global Image Guided Surgery Devices Market Revenue (US$ Mn) and Y-o-Y Growth (%) Forecast, by MRI, 2015–2025
Figure 10: Global Image Guided Surgery Devices Market Revenue (US$ Mn) and Y-o-Y Growth (%) Forecast, by Endoscopes, 2015–2025
Figure 11: Global Image Guided Surgery Devices Market Revenue (US$ Mn) and Y-o-Y Growth (%) Forecast, by X-ray Fluoroscopy, 2015–2025
Figure 12: Global Image Guided Surgery Devices Market Revenue (US$ Mn) and Y-o-Y Growth (%) Forecast, by PET, 2015–2025
Figure 13: Global Image Guided Surgery Devices Market Revenue (US$ Mn) and Y-o-Y Growth (%) Forecast, by SPECT, 2015–2025
Figure 14: Global Image Guided Surgery Devices Market Attractiveness, by Device Type, 2017–2025
Figure 15: Global Image Guided Surgery Devices Market Value Share, by Application, 2017 and 2025
Figure 16: Global Image Guided Surgery Devices Market Revenue (US$ Mn) and Y-o-Y Growth (%) Forecast, by Cardiac Surgery, 2015–2025
Figure 17: Global Image Guided Surgery Devices Market Revenue (US$ Mn) and Y-o-Y Growth (%) Forecast, by Neurosurgery, 2015–2025
Figure 18: Global Image Guided Surgery Devices Market Revenue (US$ Mn) and Y-o-Y Growth (%) Forecast, by Orthopedic Surgery, 2015–2025
Figure 19: Global Image Guided Surgery Devices Market Revenue (US$ Mn) and Y-o-Y Growth (%) Forecast, by Gastroenterology, 2015–2025
Figure 20: Global Image Guided Surgery Devices Market Revenue (US$ Mn) and Y-o-Y Growth (%) Forecast, by Urology, 2015–2025
Figure 21: Global Image Guided Surgery Devices Market Revenue (US$ Mn) and Y-o-Y Growth (%) Forecast, by Oncology Surgery, 2015–2025
Figure 22: Global Image Guided Surgery Devices Market Revenue (US$ Mn) and Y-o-Y Growth (%) Forecast, by Others, 2015–2025
Figure 23: Global Image Guided Surgery Devices Market Attractiveness, by Application, 2017–2025
Figure 24: Global Image Guided Surgery Devices Market Value Share, by End-user, 2017 and 2025
Figure 25: Global Image Guided Surgery Devices Market Revenue (US$ Mn) and Y-o-Y Growth (%) Forecast, by Hospitals,2015–2025
Figure 26: Global Image Guided Surgery Devices Market Revenue (US$ Mn) and Y-o-Y Growth (%) Forecast, by Ambulatory Surgical Centers, 2015–2025
Figure 27: Global Image Guided Surgery Devices Market Revenue (US$ Mn) and Y-o-Y Growth (%) Forecast, by Clinics, 2015–2025
Figure 28: Global Image Guided Surgery Devices Market Revenue (US$ Mn) and Y-o-Y Growth (%) Forecast, by Research & Academic Institutes, 2015–2025
Figure 29: Global Image Guided Surgery Devices Market Attractiveness, by End-user, 2017–2025
Figure 30: Global Image Guided Surgery Devices Market Value Share, by Region, 2017 and 2025
Figure 31: Global Image Guided Surgery Devices Market Attractiveness, by Region, 2017–2025
Figure 32: North America Image Guided Surgery Devices Market Revenue (US$ Mn) Forecast and Y-o-Y Growth Projection (%), 2015–2025
Figure 33: North America Image Guided Surgery Devices Market Attractiveness, by Country, 2017–2025
Figure 34: North America Image Guided Surgery Devices Market Value Share, by Country, 2017 and 2025
Figure 35: North America Image Guided Surgery Devices Market Value Share, by Device Type, 2017 and 2025
Figure 36: North America Image Guided Surgery Devices Market Value Share, by Application, 2017 and 2025
Figure 37: North America Image Guided Surgery Devices Market Attractiveness, by Device Type, 2017–2025
Figure 38: North America Image Guided Surgery Devices Market Attractiveness, by Application, 2017–2025
Figure 39: North America Image Guided Surgery Devices Market Value Share, by End-user, 2017 and 2025
Figure 40: North America Image Guided Surgery Devices Market Attractiveness, by End-user, 2017–2025
Figure 41: Europe Image Guided Surgery Devices Market Revenue (US$ Mn) Forecast and Y-o-Y Growth Projection (%), 2015–2025
Figure 42: Europe Image Guided Surgery Devices Market Attractiveness, by Country/Sub-region, 2017–2025
Figure 43: Europe Image Guided Surgery Devices Market Value Share, by Country/Sub-region, 2017 and 2025
Figure 44: Europe Image Guided Surgery Devices Market Value Share, by Device Type, 2017 and 2025
Figure 45: Europe Image Guided Surgery Devices Market Value Share, by Application, 2017 and 2025
Figure 46: Europe Image Guided Surgery Devices Market Attractiveness, by Device Type, 2017–2025
Figure 47: Europe Image Guided Surgery Devices Market Attractiveness, by Application, 2017–2025
Figure 48: Europe Image Guided Surgery Devices Market Value Share, by End-user, 2017 and 2025
Figure 49: Europe Image Guided Surgery Devices Market Attractiveness, by End-user, 2017–2025
Figure 50: Asia Pacific Image Guided Surgery Devices Market Revenue (US$ Mn) Forecast and Y-o-Y Growth Projection (%), 2015–2025
Figure 51: Asia Pacific Image Guided Surgery Devices Market Attractiveness, by Country/Sub-region, 2017–2025
Figure 52: Asia Pacific Image Guided Surgery Devices Market Value Share, by Country/Sub-region, 2017 and 2025
Figure 53: Asia Pacific Image Guided Surgery Devices Market Value Share, by Device Type, 2017 and 2025
Figure 54: Asia Pacific Image Guided Surgery Devices Market Value Share, by Application, 2017 and 2025
Figure 55: Asia Pacific Image Guided Surgery Devices Market Attractiveness, by Device Type, 2017–2025
Figure 56: Asia Pacific Image Guided Surgery Devices Market Attractiveness, by Application, 2017–2025
Figure 57: Asia Pacific Image Guided Surgery Devices Market Value Share, by End-user, 2017 and 2025
Figure 58: Asia Pacific Image Guided Surgery Devices Market Attractiveness, by End-user, 2017–2025
Figure 59: Latin America Image Guided Surgery Devices Market Revenue (US$ Mn) Forecast and Y-o-Y Growth Projection (%), 2015–2025
Figure 60: Latin America Image Guided Surgery Devices Market Attractiveness, by Country/Sub-region, 2017–2025
Figure 61: Latin America Image Guided Surgery Devices Market Value Share, by Country/Sub-region, 2017 and 2025
Figure 62: Latin America Image Guided Surgery Devices Market Value Share, by Device Type, 2017 and 2025
Figure 63: Latin America Image Guided Surgery Devices Market Value Share, by Application, 2017 and 2025
Figure 64: Latin America Image Guided Surgery Devices Market Attractiveness, by Device Type, 2017–2025
Figure 65: Latin America Image Guided Surgery Devices Market Attractiveness, by Application, 2017–2025
Figure 66: Latin America Image Guided Surgery Devices Market Value Share, by End-user, 2017 and 2025
Figure 67: Latin America Image Guided Surgery Devices Market Attractiveness, by End-user, 2017–2025
Figure 68: Middle East & Africa Image Guided Surgery Devices Market Revenue (US$ Mn) Forecast and Y-o-Y Growth (%) Projection, 2015–2025
Figure 69: Middle East & Africa Image Guided Surgery Devices Market Attractiveness, by Country/Sub-region, 2017–2025
Figure 70: Middle East & Africa Image Guided Surgery Devices Market Value Share, by Country/Sub-region, 2017 and 2025
Figure 71: Middle East & Africa Image Guided Surgery Devices Market Value Share, by Device Type, 2017 and 2025
Figure 72: Middle East & Africa Image Guided Surgery Devices Market Value Share, by Application, 2017 and 2025
Figure 73: Middle East & Africa Image Guided Surgery Devices Market Attractiveness, by Device Type, 2017–2025
Figure 74: Middle East & Africa Image Guided Surgery Devices Market Attractiveness, by Application, 2017–2025
Figure 75: Middle East & Africa Image Guided Surgery Devices Market Value Share, by End-user, 2017 and 2025
Figure 76: Middle East & Africa Image Guided Surgery Devices Market Attractiveness, by End-user, 2017–2025
Figure 77: Global Image Guided Surgery Devices Market Share & Share Range (%), by Company, 2016
Copyright © Transparency Market Research, Inc. All Rights reserved
Trust Online

Image Guided Surgery Devices Market