
Reports
Reports
Global High Availability Server Market: Snapshot
Both large and medium-sized companies are competing against one another in the global market for high availability servers. In order to stay ahead of the game, they are focusing hard on configuring high availability server into system infrastructure that will provide better features by improving the skill sets supported by these servers.
A properly designed high availability server offers minimum processing latency and maximum uptime by means of hardware redundancy feature, which serves to lower the risk of hardware failure. This advantage has led to its swift uptake by the banking and financial institutions and the retail sector that needs to store vast amounts of data and access those quickly, efficiently, and securely. Because of this and also the constant thrust on product development along with the expansion in the data center equipment market, the global market for high availability servers has been expanding at a healthy clip.
Expensiveness of high availability server and steep cost of its maintenance, on the flip side, is serving to hinder its market’s growth. Besides, the fact that not many are aware of its uses, is also acting as a deterrent to the market.
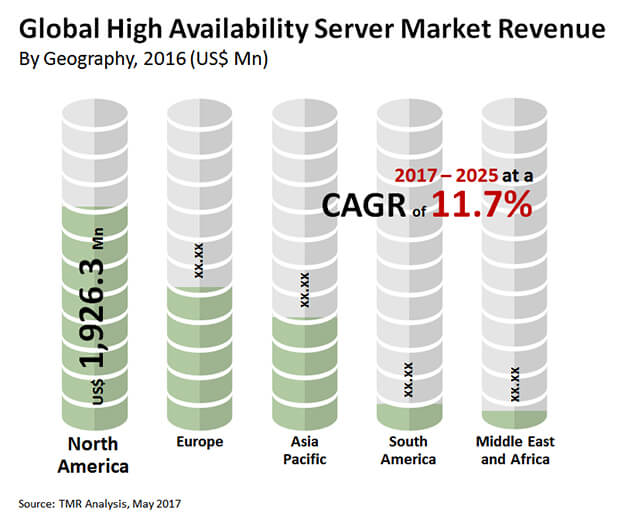
A report by Transparency Market Research forecasts the global high availability server market to expand at a robust CAGR of 11.7% from 2017 to 2025 to become worth US$12,306.9 mn by 2025 from US$4,105.0 mn in 2015.
Banking, Financial Services, and Manufacturing Drives Growth Primarily
The global high availability server market can be segmented on the basis of service sector into banking, financial service and insurance (BFSI), IT and telecommunication, retail, medical and healthcare, government, and manufacturing. The BFSI sector, of them, is at the forefront of driving sales as it needs to store massive volumes of data and access them continuously without any glitch for its smooth functioning and a high availability server is nothing but a secured pool storage. The BFSI segment accounted for 19% share in the market in 2016.
Going forward, the BFSI segment will likely outpace most other segments in terms of growth rate because of the little risk of system failure or downtime in high availability servers.
Greater Installed Base in Crucial Industries Makes North America Market Leader
From a geographical perspective, North America dominates the global market for high availability server with a leading share on the back of multinational players trying to tap into the promising U.S. and Canada markets. The phenomenal growth in the market in the region has also been brought about by greater installed base and deep penetration of high availability servers in crucial end-use industries of IT and telecommunication, BFSI, retail, e-commerce, etc. In 2016, North America accounted for a substantial 42% of the market share in the global high availability server market.
Going forward, the market in Asia Pacific is predicted to rise at a solid 13.0% CAGR from 2017 to 2025 because of the continued innovations in technology and expansion in data center equipment market, particularly in China.
In Europe, high uptake of advanced cloud based technologies and presence of multinational firms, particularly in the nations of the U.K. and Germany, needing high availability solutions, has majorly boosted the market for high availability server.
Some of the key players in the high availability server market are International Business Machines (IBM) Corporation, Dell Inc., Stratus Technologies, Inc., Hewlett Packard Enterprise, Oracle Corporation, Fujitsu, NEC Corporation, Cisco Systems Inc. and Unisys Global Technologies, and CenterServ International Ltd.
High Availability Server Market to Meet Demand for Business-Critical Activities in Various Sectors
High availability IT servers are characterized by their capability to perform continuously for a desirably long period of time without any downtime or maintenance. Perfect availability is the ideal point, and the IT providers are keenly pursuing the standard of five 9s, as they are called in the IT parlance, implying 99.999 percent availability. For this period of time, it is imperative to eliminate single points of failure, and avoid unexpected repairs. In production environments, there is a pressing need for minimizing downtimes and prevent service interruptions so that the IT system functions when needed and at ideal rate. These are some of the key consumer propositions for the preference of products in the high availability servers market. Growing number of businesses who desire 24 by 7 running operations and services online is a key aspect for the need for high availability servers. A major application area is in healthcare industry, where 24 by 7 monitoring is increasingly desirable. Growing number of business-critical activities where outages are considered to pose high casualty, either loss of massive dollars or revenue loss, have been spurring the demand in the high availability servers. Another use case of high availability servers is in stock market.
The COVID-19 pandemic and the fallouts in the past few months have triggered overhauls in IT strategies. Consumer expectations from IT-enabled and IT-based businesses across industries have undergone massive changes, with companies in the ecosystem adopting new IT frameworks to meet these. Further, the changing nature of digital offerings as well as their sheer variability have paved way to new game-changing strategies in the high availability server market. Companies are realigning their technology imperatives and rechannelling their research and development spending to counter the macroeconomic and microeconomic shocks cause by the pandemic. The aftermath will motivate industry players in the high availability server market to shift to new normals rapidly to stay relevant.
1. Preface
1.1. Market Definition and Scope
1.2. Market Segmentation
1.3. Key Research Objectives
1.4. Research Highlights
2. Assumptions and Research Methodology
3. Executive Summary : Global High Availability Server Market
4. Market Overview
4.1. Introduction
4.1.1. Product Definition
4.1.2. Industry Evolution / Developments
4.2. Market Overview
4.3. Key Market Indicators
4.4. Market Dynamics
4.4.1. Drivers
4.4.2. Restraints
4.4.3. Opportunity
4.5. Key Trend Analysis
4.6. Global High Availability Server Market Analysis and Forecasts, 2017 – 2025
4.6.1. Market Revenue Projections (US$ Mn)
4.7. Porter’s Five Force Analysis
4.8. Market Outlook
5. Global High Availability Server Market Analysis and Forecasts, By Availability Level
5.1. Introduction & Definition
5.2. Key Findings / Developments
5.3. Key Trends
5.4. Market Size (US$ Mn) Analysis and Forecast By Availability Level, 2017 – 2025
5.4.1. Availability Level 1
5.4.2. Availability Level 2
5.4.3. Availability Level 3
5.4.4. Availability Level 4
5.4.5. Availability Level 5
5.5. Market Attractiveness By Availability Level
6. Global High Availability Server Market Analysis and Forecasts, By End-use Industry
6.1. Introduction & Definition
6.2. Key Findings / Developments
6.3. Key Trends
6.4. Market Size (US$ Mn) Analysis and Forecast By End-use Industry 2017 – 2025
6.4.1. IT & Telecommunication
6.4.2. Banking, Financial Service and Insurance (BFSI)
6.4.3. Retail
6.4.4. Medical & Healthcare
6.4.5. Manufacturing
6.4.6. Government
6.4.7. Others
6.5. Market Attractiveness By End-use Industry
7. Global High Availability Server Market Analysis and Forecasts, By Operating System
7.1. Introduction & Definition
7.2. Key Findings / Developments
7.3. Key Trends
7.4. Market Size (US$ Mn) Analysis and Forecast By Operating System 2017 – 2025
7.4.1. Linux
7.4.2. Windows
7.4.3. Others (UNIX, Free BSD, etc.)
7.5. Market Attractiveness By Operating System
8. Global High Availability Server Market Analysis and Forecasts, By Region
8.1. Key Findings
8.2. Policies and Regulations
8.3. Market Size (US$ Mn) Analysis and Forecast By Region, 2017 – 2025
8.3.1. North America
8.3.2. Europe
8.3.3. Asia Pacific
8.3.4. Middle East and Africa
8.3.5. South America
8.4. Market Attractiveness By Region
9. North America High Availability Server Market Analysis and Forecast
9.1. Key Findings
9.2. Market Size (US$ Mn) Analysis and Forecast By Availability Level, 2017 – 2025
9.2.1. Availability Level 1
9.2.2. Availability Level 2
9.2.3. Availability Level 3
9.2.4. Availability Level 4
9.2.5. Availability Level 5
9.3. Market Size (US$ Mn) Analysis and Forecast By End-use Industry, 2017 – 2025
9.3.1. IT & Telecommunication
9.3.2. Banking, Financial Service and Insurance (BFSI)
9.3.3. Retail
9.3.4. Medical & Healthcare
9.3.5. Manufacturing
9.3.6. Government
9.3.7. Others
9.4. Market Size (US$ Mn) Analysis and Forecast By Operating System, 2017 – 2025
9.4.1. Linux
9.4.2. Windows
9.4.3. Others (UNIX, Free BSD, etc.)
9.5. Market Size (US$ Mn) Analysis and Forecast By Country, 2017 – 2025
9.5.1. United States
9.5.2. Canada
9.5.3. Rest of North America
9.6. Market Attractiveness Analysis
9.6.1. By Availability Level
9.6.2. By End-use Industry
9.6.3. By Operating System
9.6.4. By Country
10. Europe High Availability Server Market Analysis and Forecast
10.1. Key Findings
10.2. Market Size (US$ Mn) Analysis and Forecast By Availability Level, 2017 – 2025
10.2.1. Availability Level 1
10.2.2. Availability Level 2
10.2.3. Availability Level 3
10.2.4. Availability Level 4
10.2.5. Availability Level 5
10.3. Market Size (US$ Mn) Analysis and Forecast By End-use Industry, 2017 – 2025
10.3.1. IT & Telecommunication
10.3.2. Banking, Financial Service and Insurance (BFSI)
10.3.3. Retail
10.3.4. Medical & Healthcare
10.3.5. Manufacturing
10.3.6. Government
10.3.7. Others
10.4. Market Size (US$ Mn) Analysis and Forecast By Operating System, 2017 – 2025
10.4.1. Linux
10.4.2. Windows
10.4.3. Others (UNIX, Free BSD, etc.)
10.5. Market Size (US$ Mn) Analysis and Forecast By Country, 2017 – 2025
10.5.1. Germany
10.5.2. France
10.5.3. United Kingdom
10.5.4. Rest of Europe
10.6. Market Attractiveness Analysis
10.6.1. By Availability Level
10.6.2. By End-use Industry
10.6.3. By Operating System
10.6.4. By Country
11. Asia Pacific High Availability Server Market Analysis and Forecast
11.1. Key Findings
11.2. Market Size (US$ Mn) Analysis and Forecast By Availability Level, 2017 – 2025
11.2.1. Availability Level 1
11.2.2. Availability Level 2
11.2.3. Availability Level 3
11.2.4. Availability Level 4
11.2.5. Availability Level 5
11.3. Market Size (US$ Mn) Analysis and Forecast By End-use Industry, 2017 – 2025
11.3.1. IT & Telecommunication
11.3.2. Banking, Financial Service and Insurance (BFSI)
11.3.3. Retail
11.3.4. Medical & Healthcare
11.3.5. Manufacturing
11.3.6. Government
11.3.7. Others
11.4. Market Size (US$ Mn) Analysis and Forecast By Operating System, 2017 – 2025
11.4.1. Linux
11.4.2. Windows
11.4.3. Others (UNIX, Free BSD, etc.)
11.5. Market Size (US$ Mn) Analysis and Forecast By Country, 2017 – 2025
11.5.1. China
11.5.2. Japan
11.5.3. Australia
11.5.4. Rest of APAC
11.6. Market Attractiveness Analysis
11.6.1. By Availability Level
11.6.2. By End-use Industry
11.6.3. By Operating System
11.6.4. By Country
12. Middle East And Africa High Availability Server Market Analysis and Forecast
12.1. Key Findings
12.2. Market Size (US$ Mn) Analysis and Forecast By Availability Level, 2017 – 2025
12.2.1. Availability Level 1
12.2.2. Availability Level 2
12.2.3. Availability Level 3
12.2.4. Availability Level 4
12.2.5. Availability Level 5
12.3. Market Size (US$ Mn) Analysis and Forecast By End-use Industry, 2017 – 2025
12.3.1. IT & Telecommunication
12.3.2. Banking, Financial Service and Insurance (BFSI)
12.3.3. Retail
12.3.4. Medical & Healthcare
12.3.5. Manufacturing
12.3.6. Government
12.3.7. Others
12.4. Market Size (US$ Mn) Analysis and Forecast By Operating System, 2017 – 2025
12.4.1. Linux
12.4.2. Windows
12.4.3. Others (UNIX, Free BSD, etc.)
12.5. Market Size (US$ Mn) Analysis and Forecast By Country, 2017 – 2025
12.5.1. UAE
12.5.2. South Africa
12.5.3. Saudi Arabia
12.5.4. Rest of Middle East
12.6. Market Attractiveness Analysis
12.6.1. By Availability Level
12.6.2. By End-use Industry
12.6.3. By Operating System
12.6.4. By Country
13. South America High Availability Server Market Analysis and Forecast
13.1. Key Findings
13.2. Market Size (US$ Mn) Analysis and Forecast By Availability Level, 2017 – 2025
13.2.1. Availability Level 1
13.2.2. Availability Level 2
13.2.3. Availability Level 3
13.2.4. Availability Level 4
13.2.5. Availability Level 5
13.3. Market Size (US$ Mn) Analysis and Forecast By End-use Industry, 2017 – 2025
13.3.1. IT & Telecommunication
13.3.2. Banking, Financial Service and Insurance (BFSI)
13.3.3. Retail
13.3.4. Medical & Healthcare
13.3.5. Manufacturing
13.3.6. Government
13.3.7. Others
13.4. Market Size (US$ Mn) Analysis and Forecast By Operating System, 2017 – 2025
13.4.1. Linux
13.4.2. Windows
13.4.3. Others (UNIX, Free BSD, etc.)
13.5. Market Size (US$ Mn) Analysis and Forecast By Country, 2017 – 2025
13.5.1. Brazil
13.5.2. Argentina
13.5.3. Rest of South America
13.6. Market Attractiveness Analysis
13.6.1. By Availability Level
13.6.2. By End-use Industry Industry
13.6.3. By Operating System
13.6.4. By Country
14. Competition Landscape
14.1. Market Player – Competition Matrix (By Tier and Size of companies)
14.2. Market Share Analysis By Company (2015)
14.3. Company Profiles (Details – Overview, Financials, Recent Developments, Strategy)
14.3.1. International Business Machines (IBM) Corporation
14.3.1.1. Company Details (Headquarter, Foundation Year, & Employee Strength)
14.3.1.2. Company Description
14.3.1.3. SWOT Analysis
14.3.1.4. Annual Revenue
14.3.1.5. Strategic Overview
14.3.2. CenterServ
14.3.2.1. Company Details (Headquarter, Foundation Year, & Employee Strength)
14.3.2.2. Company Description
14.3.2.3. SWOT Analysis
14.3.2.4. Annual Revenue
14.3.2.5. Strategic Overview
14.3.3. Dell Inc.
14.3.3.1. Company Details (Headquarter, Foundation Year, & Employee Strength)
14.3.3.2. Company Description
14.3.3.3. SWOT Analysis
14.3.3.4. Annual Revenue
14.3.3.5. Strategic Overview
14.3.4. HP
14.3.4.1. Company Details (Headquarter, Foundation Year, & Employee Strength)
14.3.4.2. Company Description
14.3.4.3. SWOT Analysis
14.3.4.4. Annual Revenue
14.3.4.5. Strategic Overview
14.3.5. Oracle Corporation
14.3.5.1. Company Details (Headquarter, Foundation Year, & Employee Strength)
14.3.5.2. Company Description
14.3.5.3. SWOT Analysis
14.3.5.4. Annual Revenue
14.3.5.5. Strategic Overview
14.3.6. Fujitsu
14.3.6.1. Company Details (Headquarter, Foundation Year, & Employee Strength)
14.3.6.2. Company Description
14.3.6.3. SWOT Analysis
14.3.6.4. Annual Revenue
14.3.6.5. Strategic Overview
14.3.7. NEC Corporation
14.3.7.1. Company Details (Headquarter, Foundation Year, & Employee Strength)
14.3.7.2. Company Description
14.3.7.3. SWOT Analysis
14.3.7.4. Annual Revenue
14.3.7.5. Strategic Overview
14.3.8. Stratus Technologies, Inc.
14.3.8.1. Company Details (Headquarter, Foundation Year, & Employee Strength)
14.3.8.2. Company Description
14.3.8.3. SWOT Analysis
14.3.8.4. Annual Revenue
14.3.8.5. Strategic Overview
14.3.9. Cisco Systems Inc.
14.3.9.1. Company Details (Headquarter, Foundation Year, & Employee Strength)
14.3.9.2. Company Description
14.3.9.3. SWOT Analysis
14.3.9.4. Annual Revenue
14.3.9.5. Strategic Overview
14.3.10. Unisys Global Technologies
14.3.10.1. Company Details (Headquarter, Foundation Year, & Employee Strength)
14.3.10.2. Company Description
14.3.10.3. SWOT Analysis
14.3.10.4. Annual Revenue
14.3.10.5. Strategic Overview
15. Key Takeaways
List of Tables
Table 1: Global High Availability Server Market Size (US$ Bn) Analysis and Forecast, By Availability Level, 2015 – 2025
Table 2: Global High Availability Server Market Size (US$ Bn) Analysis and Forecast, By End-use Industry, 2015 – 2025
Table 3: Global High Availability Server Market Size (US$ Bn) Analysis and Forecast, By Operating System, 2015 – 2025
Table 4: Global High Availability Server Market Size (US$ Bn) Analysis and Forecast, By Region, 2015 – 2025
Table 5: North American High Availability Server Market Size (US$ Bn) Analysis and Forecast, By Availability Level, 2015 – 2025
Table 6: North America High Availability Server Market Size (US$ Bn) Analysis and Forecast, By End-use Industry, 2015 – 2025
Table 7: North America High Availability Server Market Size (US$ Bn) Analysis and Forecast, By Operating System, 2015 – 2025
Table 8: North America High Availability Server Market Size (US$ Bn) Analysis and Forecast, By Country, 2015 – 2025
Table 9: Europe High Availability Server Market Size (US$ Bn) Analysis and Forecast, By Availability Level, 2015 – 2025
Table 10: Europe High Availability Server Market Size (US$ Bn) Analysis and Forecast, By End-use Industry, 2015 – 2025
Table 11: Europe High Availability Server Market Size (US$ Bn) Analysis and Forecast, By Operating System, 2015 – 2025
Table 12: Europe High Availability Server Market Size (US$ Bn) Analysis and Forecast, By Country, 2015 – 2025
Table 13: Asia Pacific High Availability Server Market Size (US$ Bn) Analysis and Forecast, By Availability Level, 2015 – 2025
Table 14: Asia Pacific High Availability Server Market Size (US$ Bn) Analysis and Forecast, By End-use Industry, 2015 – 2025
Table 15: Asia Pacific High Availability Server Market Size (US$ Bn) Analysis and Forecast, By Operating System, 2015 – 2025
Table 16: Asia Pacific High Availability Server Market Size (US$ Bn) Analysis and Forecast, By Country, 2015 – 2025
Table 17: MEA High Availability Server Market Size (US$ Bn) Analysis and Forecast, By Availability Level, 2015 – 2025
Table 18: MEA High Availability Server Market Size (US$ Bn) Analysis and Forecast, By End-use Industry, 2015 – 2025
Table 19: MEA High Availability Server Market Size (US$ Bn) Analysis and Forecast, By Operating System, 2015 – 2025
Table 20: MEA High Availability Server Market Size (US$ Bn) Analysis and Forecast, By Country, 2015 – 2025
Table 21: South America High Availability Server Market Size (US$ Bn) Analysis and Forecast, By Availability Level, 2015 – 2025
Table 22: South America High Availability Server Market Size (US$ Bn) Analysis and Forecast, By End-use Industry, 2015 – 2025
Table 23: South America High Availability Server Market Size (US$ Bn) Analysis and Forecast, By Operating System, 2015 – 2025
Table 24: South America High Availability Server Market Size (US$ Bn) Analysis and Forecast, By Country, 2015 – 2025
List of Figures
Figure 1: Revenue (US$ Mn) Graphical Analysis
Figure 2: Porter’s Five Forces Analysis
Figure 3: Ecosystem Analysis
Figure 4: Market Value Share, By Availability Level (2016)
Figure 5: Market Value Share, By Operating System (2016)
Figure 6: Market Value Share, By End-use Industry (2016)
Figure 7: Market Value Share, By Geography (2016)
Figure 8: Global High Availability Server Market Value Share Analysis, By Availability Level, 2017 and 2025
Figure 9: Global High Availability Server Market Attractiveness Analysis, By Availability Level
Figure 10: Global High Availability Server Market Value Share Analysis, By End-use Industry, 2017 and 2025
Figure 11: Global High Availability Server Market Attractiveness Analysis, By End-use Industry
Figure 12: Global High Availability Server Market Value Share Analysis, By Operating System, 2017 and 2025
Figure 13: Global High Availability Server Market Attractiveness Analysis, By Operating System
Figure 14: Global High Availability Server Market CAGR (2017 – 2025) Analysis, By Country
Figure 15: Global High Availability Server Market Attractiveness Analysis, By Region
Figure 16: North America High Availability Server Market Value Share Analysis, By Availability Level 2017 and 2025
Figure 17: North America High Availability Server Market Value Share Analysis, By End-use Industry 2017 and 2025
Figure 18: North America High Availability Server Market Value Share Analysis, By Operating System 2017 and 2025
Figure 19: North America High Availability Server Market Value Share Analysis, By Country 2017 and 2025
Figure 20: North America High Availability Server Market Attractiveness Analysis, By Availability Level
Figure 21: North America High Availability Server Market Attractiveness Analysis, By End-use Industry
Figure 22: North America High Availability Server Market Attractiveness Analysis, By Operating System
Figure 23: North America High Availability Server Market Attractiveness Analysis, By Country
Figure 24: Europe High Availability Server Market Value Share Analysis, By Availability Level 2017 and 2025
Figure 25: Europe High Availability Server Market Value Share Analysis, By End-use Industry 2017 and 2025
Figure 26: Europe High Availability Server Market Value Share Analysis, By Operating System 2017 and 2025
Figure 27: Europe High Availability Server Market Value Share Analysis, By Country 2017 and 2025
Figure 28: Europe High Availability Server Market Attractiveness Analysis, By Availability Level
Figure 29: Europe High Availability Server Market Attractiveness Analysis, By End-use Industry
Figure 30: Europe High Availability Server Market Attractiveness Analysis, By Operating System
Figure 31: Europe High Availability Server Market Attractiveness Analysis, By Country
Figure 32: Asia Pacific High Availability Server Market Value Share Analysis, By Availability Level 2017 and 2025
Figure 33: Asia Pacific High Availability Server Market Value Share Analysis, By End-use Industry 2017 and 2025
Figure 34: Asia Pacific High Availability Server Market Value Share Analysis, By Operating System 2017 and 2025
Figure 35: Asia Pacific High Availability Server Market Value Share Analysis, By Country 2017 and 2025
Figure 36: Asia Pacific High Availability Server Market Attractiveness Analysis, By Availability Level
Figure 37: Asia Pacific High Availability Server Market Attractiveness Analysis, By End-use Industry
Figure 38: Asia Pacific High Availability Server Market Attractiveness Analysis, By Operating System
Figure 39: Asia Pacific High Availability Server Market Attractiveness Analysis, By Country
Figure 40: MEA High Availability Server Market Value Share Analysis, By Availability Level 2017 and 2025
Figure 41: MEA High Availability Server Market Value Share Analysis, By End-use Industry 2017 and 2025
Figure 42: MEA High Availability Server Market Value Share Analysis, By Operating System 2017 and 2025
Figure 43: MEA High Availability Server Market Value Share Analysis, By Country 2017 and 2025
Figure 44: MEA High Availability Server Market Attractiveness Analysis, By Availability Level
Figure 45: MEA High Availability Server Market Attractiveness Analysis, By End-use Industry
Figure 46: MEA High Availability Server Market Attractiveness Analysis, By Operating System
Figure 47: MEA High Availability Server Market Attractiveness Analysis, By Country
Figure 48: South America High Availability Server Market Value Share Analysis, By Availability Level 2017 and 2025
Figure 49: South America High Availability Server Market Value Share Analysis, By End-use Industry 2017 and 2025
Figure 50: South America High Availability Server Market Value Share Analysis, By Operating System 2017 and 2025
Figure 51: South America High Availability Server Market Value Share Analysis, By Country 2017 and 2025
Figure 52: South America High Availability Server Market Attractiveness Analysis, By Availability Level
Figure 53: South America High Availability Server Market Attractiveness Analysis, By End-use Industry
Figure 54: South America High Availability Server Market Attractiveness Analysis, By Operating System
Figure 55: South America High Availability Server Market Attractiveness Analysis, By Country
Copyright © Transparency Market Research, Inc. All Rights reserved
Trust Online

High Availability Server Market