
Reports
Reports
The demand within the global market for contactless payment transactions has been expanding on account of the need to make secure, safe, and easy payments across several industrial units. Contact payment transaction involves the use of near field communication (NFC) or RFID technologies in order to debit or credit money from one account to the other. The advent of a contactless payment transaction has eased buying procedures for individuals, companies, and other entities. Owing to the aforementioned factors, it is legit to expound that the global market for contactless payment transactions would experience an unprecedented rise in demand over the coming years.
The ability to make online payments from laptops, smartphones, and other smart devices has helped people in streamlining their tasks. Furthermore, most people prefer to carry as little cash as possible during travel and other commutes, and this brings contactless payment transaction services to the fore. Over the past decade, several industries including healthcare, automotive, and infrastructure have become reliant on the use of contactless payment for several purposes. The retail sector has emerged as the most prominent consumer of contact payment transaction services in recent times. Furthermore, the popularity of credit and debit cards has led to the launch of multiple mobile apps to that facilitate contactless payment transactions.
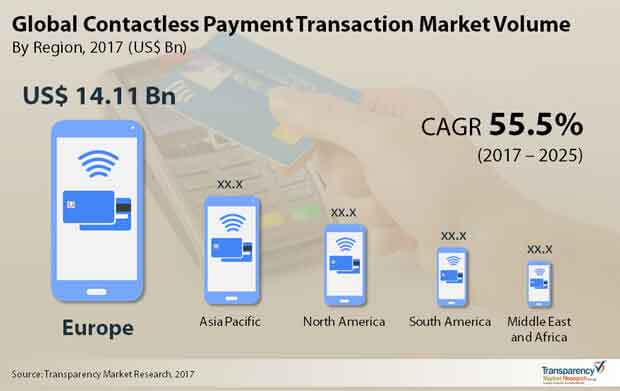
A report by Transparency Market Research (TMR) predicts that the global market for contactless payment transactions would expand at an astral CAGR of 55.50% over the period between 2017 and 2025. Furthermore, the global market for contactless payment transactions was valued at US$14.1 bn in 2017 and is expected to reach a value of US$801.4 bn by 2025.
On the basis of the end-use industry, the global market for contactless payment transactions can be segmented into media and entertainment, healthcare, retail, hospitality, and transport. Amongst these segments, the retail sector has become the most ardent consumer of contactless payment transactions due to the need for swift, easy, and secure transfers.
Furthermore, retail stores form an important part of the e-commerce industry, and this further propels demand within the global market for contactless payment transactions. The healthcare sector has also emerged as a key consumer of contact payment transaction services due to the advent of multiple healthcare apps. Based on the mode of payment, the global contactless payment transaction market can be segmented into wearable devices, contactless cards, and contactless mobile payments.
The demand for contactless payment transactions has been the highest across Europe, majorly due to the sophisticated retail sector in the region. Moreover, countries such as England, France, and Germany have inducted contactless payment transaction services across several sectors. The market for contactless payment transaction services in North America has been expanding on account of key developments in the media and entertainment industry in the US and Canada. The rising disposable income of the masses in China, Indonesia, and India has created growth opportunities within the market for contactless payment transactions in the Asia Pacific.
Some of the key players in the global market for contactless payment transactions are Ingenico Gemalto N.V., Group, and Barclays.
Economies around the world have been pursuing digital payment. The contactless payment transaction market has seen some remarkable strides on the back of support by governments and technological advances in payment platforms. Governments especially in emerging economies are intensively supporting the adoption of contactless payments. This has become even more crucial when the currently emerging Covid-19 pandemic mandated the use and adoption of a wide spectrum of contactless technologies. The pandemic further caused snags on the wheels of the economy, and the financial sector was also left untouched. Digital payments witnessed a surge in the early part of 2020, creating new demands for technology companies and app providers. The proliferating use of mobile devices during these times also led to the adoption of digital payments. Further, the growing consumer preference for digital payments is a key trend in the payment transaction market. Over the past few years, there has been a surge in the popularity of contactless NFC technology in cards. Visa card providers offered by many private banks had been quick to offer them to their customers. This point also spurred the popularity of contactless payment transition system capabilities, thereby attracting prospective customers.
With the economies gradually opening and consumer sentiments expected to gain force, the retail industry will gain new momentum. The contactless payment transaction market saw a surge in the number of times contactless payment was made, at retail stores, malls, and hyper stores. Further, high-ticket recurring payments also bolstered the demand in the contactless payment transaction market. This has also nudged stakeholders to cement the technologies to make these transactions secure, convenient, and hassle-free. Particularly, those behind Unified Payment Interface (UPI) have been relentlessly working to improve the convenience of consumers and offer safety without the use of PIN. Regulatory agencies, such as in India, have also relaxed norms for enhancing the limit that is possible for consumers to make in each transaction.
The contactless payment transactions market is studied from 2017 - 2025
TMR prognosticates the global contactless payment transaction market to rise at a 55.5% CAGR between 2017 and 2025 to be valued at an US$801.4 bn by the final forecast year.
The COVID-19 pandemic has surprisingly had a very positive impact on the product adoption owing to increasing number of lockdowns, social distancing measures, and rising usage in the retail sector.
Top market leaders such as Ingenico Group, Gemalto N.V., and Barclays could make their presence known in the industry.
Key factors that are driving the market growth include increasing adoption of digital payment platforms, growing customer convenience for low-value payment, and technology innovation in contactless payment devices and services.
1. Preface
1.1. Report Scope
1.2. Market Segmentation
1.3. Key Research Objectives
1.4. Research Highlights
2. Assumptions and Research Methodology
3. Executive Summary : Global Contactless Payment Transaction Market
4. Market Overview
4.1. Industry Developments
4.2. Market Dynamics
4.2.1. Drivers
4.2.2. Restraints
4.2.3. Opportunities
4.3. Key Market Indicators
4.4. Contactless Payment Transaction Market Analysis and Forecasts, 2015 – 2025
4.4.1. Market Revenue Projections (US$ Bn)
4.4.2. Market Volume Projection (No of Payments in Bn)
4.5. Key Findings
4.6. Porter’s Five Force Analysis
4.7. Ecosystem Analysis
4.8. Market Outlook
5. Global Contactless Payment Transaction Market Analysis and Forecast, by Mode of Payment
5.1. Definitions
5.2. Contactless Payment Transaction Market Analysis and Forecast (US$ Bn & No of Payments in Bn) by Mode of Payment, 2015 – 2025
5.2.1. Contactless Card (NFC/RFID)
5.2.2. Wearable Devices
5.2.3. Contactless Mobile Payment
5.3. Mode of Payment Comparison Matrix
5.4. Market Attractiveness By Mode of Payment
6. Global Contactless Payment Transaction Market Analysis and Forecast, by End-Use
6.1. Contactless Payment Transaction Market Analysis and Forecast (US$ Bn & No of Payments in Bn) by End-Use, 2015 – 2025
6.1.1. Hospitality
6.1.2. Transport
6.1.3. Media & Entertainment
6.1.4. Retail
6.1.5. Healthcare
6.1.6. Others
6.2. End-Use Comparison Matrix
6.3. Market Attractiveness By End-Use
7. Global Contactless Payment Transaction Market Analysis and Forecast, by Region
7.1. Key Trends
7.2. Market Analysis and Forecast (US$ Bn & No of Payments in Bn), by Region, 2015 - 2025
7.2.1. North America
7.2.2. Europe
7.2.3. Asia Pacific
7.2.4. Middle East and Africa
7.2.5. South America
7.3. Market Attractiveness By Country/Region
8. North America Contactless Payment Transaction Market Analysis and Forecast
8.1. Contactless Payment Transaction Market Analysis and Forecast (US$ Bn & No of Payments in Bn) by Mode of Payment, 2015 – 2025
8.1.1. Contactless Card (NFC/RFID)
8.1.2. Wearable Devices
8.1.3. Contactless Mobile Payment
8.2. Contactless Payment Transaction Market Analysis and Forecast (US$ Bn & No of Payments in Bn) by End-Use, 2015 – 2025
8.2.1. Hospitality
8.2.2. Transport
8.2.3. Media & Entertainment
8.2.4. Retail
8.2.5. Healthcare
8.2.6. Others
8.3. Market Analysis and Forecast (US$ Bn & No of Payments in Bn) By Country, 2015 - 2025
8.3.1. The U.S.
8.3.2. Canada
8.3.3. Rest of North America
8.4. Market Attractiveness Analysis
8.4.1. By Country
8.4.2. By Mode of Payment
8.4.3. By End-Use
9. Europe Contactless Payment Transaction Market Analysis and Forecast
9.1. Contactless Payment Transaction Market Analysis and Forecast (US$ Bn & No of Payments in Bn) by Mode of Payment, 2015 – 2025
9.1.1. Contactless Card (NFC/RFID)
9.1.2. Wearable Devices
9.1.3. Contactless Mobile Payment
9.2. Contactless Payment Transaction Market Analysis and Forecast (US$ Bn & No of Payments in Bn) by End-Use, 2015 – 2025
9.2.1. Hospitality
9.2.2. Transport
9.2.3. Media & Entertainment
9.2.4. Retail
9.2.5. Healthcare
9.2.6. Others
9.3. Market Analysis and Forecast (US$ Bn & No of Payments in Bn) By Country, 2015 - 2025
9.3.1. The U.K.
9.3.2. Germany
9.3.3. Poland
9.3.4. Sweden
9.3.5. France
9.3.6. Rest of Europe
9.4. Market Attractiveness Analysis
9.4.1. By Country
9.4.2. By Mode of Payment
9.4.3. By End-Use
10. Asia Pacific Contactless Payment Transaction Market Analysis and Forecast
10.1. Contactless Payment Transaction Market Analysis and Forecast (US$ Bn & No of Payments in Bn) by Mode of Payment, 2015 – 2025
10.1.1. Contactless Card (NFC/RFID)
10.1.2. Wearable Devices
10.1.3. Contactless Mobile Payment
10.2. Contactless Payment Transaction Market Analysis and Forecast (US$ Bn & No of Payments in Bn) by End-Use, 2015 – 2025
10.2.1. Hospitality
10.2.2. Transport
10.2.3. Media & Entertainment
10.2.4. Retail
10.2.5. Healthcare
10.2.6. Others
10.3. Market Analysis and Forecast (US$ Bn & No of Payments in Bn) By Country, 2015 - 2025
10.3.1. India
10.3.2. China
10.3.3. Japan
10.3.4. Australia
10.3.5. South Korea
10.3.6. Taiwan
10.3.7. Singapore
10.3.8. Rest of Asia Pacific
10.4. Market Attractiveness Analysis
10.4.1. By Country
10.4.2. By Mode of Payment
10.4.3. By End-Use
11. Middle East and Africa Contactless Payment Transaction Market Analysis and Forecast
11.1. Contactless Payment Transaction Market Analysis and Forecast (US$ Bn & No of Payments in Bn) by Mode of Payment, 2015 – 2025
11.1.1. Contactless Card (NFC/RFID)
11.1.2. Wearable Devices
11.1.3. Contactless Mobile Payment
11.2. Contactless Payment Transaction Market Analysis and Forecast (US$ Bn & No of Payments in Bn) by End-Use, 2015 – 2025
11.2.1. Hospitality
11.2.2. Transport
11.2.3. Media & Entertainment
11.2.4. Retail
11.2.5. Healthcare
11.2.6. Others
11.3. Market Analysis and Forecast (US$ Bn & No of Payments in Bn) By Country, 2015 - 2025
11.3.1. UAE
11.3.2. Turkey
11.3.3. Saudi Arabia
11.3.4. South Africa
11.3.5. Rest of MEA
11.4. Market Attractiveness Analysis
11.4.1. By Country
11.4.2. By Mode of Payment
11.4.3. By End-Use
12. South America Contactless Payment Transaction Market Analysis and Forecast
12.1. Contactless Payment Transaction Market Analysis and Forecast (US$ Bn & No of Payments in Bn) by Mode of Payment, 2015 – 2025
12.1.1. Contactless Card (NFC/RFID)
12.1.2. Wearable Devices
12.1.3. Contactless Mobile Payment
12.2. Contactless Payment Transaction Market Analysis and Forecast (US$ Bn & No of Payments in Bn) by End-Use, 2015 – 2025
12.2.1. Hospitality
12.2.2. Transport
12.2.3. Media & Entertainment
12.2.4. Retail
12.2.5. Healthcare
12.2.6. Others
12.3. Market Analysis and Forecast (US$ Bn & No of Payments in Bn) By Country, 2015 - 2025
12.3.1. Brazil
12.3.2. Argentina
12.3.3. Rest of South America
12.4. Market Attractiveness Analysis
12.4.1. By Country
12.4.2. By Mode of Payment
12.4.3. By End-Use
13. Competition Landscape
13.1. Market Player – Competition Matrix
13.2. Market Positioning By Company (2016)
13.3. Company Profiles (Details – Overview, Financials, Strategy and SWOT Analysis)
13.3.1. Apple Inc.
13.3.1.1. Company Details (HQ, Foundation Year, Employee Strength)
13.3.1.2. Market Presence, By Segment.
13.3.1.3. Strategy
13.3.1.4. Revenue and Operating Profits
13.3.1.5. SWOT Analysis
13.3.2. Barclays
13.3.2.1. Company Details (HQ, Foundation Year, Employee Strength)
13.3.2.2. Market Presence, By Segment.
13.3.2.3. Strategy
13.3.2.4. Revenue and Operating Profits
13.3.2.5. SWOT Analysis
13.3.3. Gemalto N.V.
13.3.3.1. Company Details (HQ, Foundation Year, Employee Strength)
13.3.3.2. Market Presence, By Segment.
13.3.3.3. Strategy
13.3.3.4. Revenue and Operating Profits
13.3.3.5. SWOT Analysis
13.3.4. Giesecke & Devrient GmbH
13.3.4.1. Company Details (HQ, Foundation Year, Employee Strength)
13.3.4.2. Market Presence, By Segment.
13.3.4.3. Strategy
13.3.4.4. Revenue and Operating Profits
13.3.4.5. SWOT Analysis
13.3.5. Heartland Payment Systems, Inc.
13.3.5.1. Company Details (HQ, Foundation Year, Employee Strength)
13.3.5.2. Market Presence, By Segment.
13.3.5.3. Strategy
13.3.5.4. Revenue and Operating Profits
13.3.5.5. SWOT Analysis
13.3.6. Ingenico Group
13.3.6.1. Company Details (HQ, Foundation Year, Employee Strength)
13.3.6.2. Market Presence, By Segment.
13.3.6.3. Strategy
13.3.6.4. Revenue and Operating Profits
13.3.6.5. SWOT Analysis
13.3.7. Inside Secure
13.3.7.1. Company Details (HQ, Foundation Year, Employee Strength)
13.3.7.2. Market Presence, By Segment.
13.3.7.3. Strategy
13.3.7.4. Revenue and Operating Profits
13.3.7.5. SWOT Analysis
13.3.8. On Track Innovations LTD
13.3.8.1. Company Details (HQ, Foundation Year, Employee Strength)
13.3.8.2. Market Presence, By Segment.
13.3.8.3. Strategy
13.3.8.4. Revenue and Operating Profits
13.3.8.5. SWOT Analysis
13.3.9. Samsung Electronics Ltd.
13.3.9.1. Company Details (HQ, Foundation Year, Employee Strength)
13.3.9.2. Market Presence, By Segment.
13.3.9.3. Strategy
13.3.9.4. Revenue and Operating Profits
13.3.9.5. SWOT Analysis
13.3.10. Verifone Systems, Inc.
13.3.10.1. Company Details (HQ, Foundation Year, Employee Strength)
13.3.10.2. Market Presence, By Segment.
13.3.10.3. Strategy
13.3.10.4. Revenue and Operating Profits
13.3.10.5. SWOT Analysis
13.3.11. Wirecard AG
13.3.11.1. Company Details (HQ, Foundation Year, Employee Strength)
13.3.11.2. Market Presence, By Segment.
13.3.11.3. Strategy
13.3.11.4. Revenue and Operating Profits
13.3.11.5. SWOT Analysis
14. Key Takeaways
List of Tables
Table 1: Global Contactless Payment Market Revenue (US$ Bn) Forecast and CAGR, by Mode of Payment, 2015–2025
Table 2: Global Contactless Payment Market Volume (No of Payment in Bn) Forecast and CAGR, by Mode of Payment, 2015–2025
Table 3: Global Contactless Payment Market Revenue (US$ Bn) Forecast and CAGR, by End-Use, 2015–2025
Table 4: Global Contactless Payment Market Volume (No of Payment in Bn) Forecast and CAGR, by End-Use, 2015–2025
Table 5: Global Contactless Payment Market Revenue (US$ Bn) Forecast and CAGR, by Region, 2015–2025
Table 6: Global Contactless Payment Market Volume (No of Payment in Bn) Forecast and CAGR, by Region, 2015–2025
Table 7: North America Contactless Payment Market Revenue (US$ Bn) Forecast and CAGR, by Mode of Payment, 2015–2025
Table 8: North America Contactless Payment Market Volume (No of Payment in Bn) Forecast and CAGR, by Mode of Payment, 2015–2025
Table 9: North America Contactless Payment Market Revenue (US$ Bn) Forecast and CAGR, by End-Use, 2015–2025
Table 10: North America Contactless Payment Market Volume (No of Payment in Bn) Forecast and CAGR, by End-Use, 2015–2025
Table 11: North America Contactless Payment Market Revenue (US$ Bn) Forecast and CAGR, by Country, 2015–2025
Table 12: North America Contactless Payment Market Volume (No of Payment in Bn) Forecast and CAGR, by Country, 2015–2025
Table 13: Europe Contactless Payment Market Revenue (US$ Bn) Forecast and CAGR, by Mode of Payment, 2015–2025
Table 14: Europe Contactless Payment Market Volume (No of Payment in Bn) Forecast and CAGR, by Mode of Payment, 2015–2025
Table 15: Europe Contactless Payment Market Revenue (US$ Bn) Forecast and CAGR, by End-Use, 2015–2025
Table 16: Europe Contactless Payment Market Volume (No of Payment in Bn) Forecast and CAGR, by End-Use, 2015–2025
Table 17: Europe Contactless Payment Market Revenue (US$ Bn) Forecast and CAGR, by Country, 2015–2025
Table 18: Europe Contactless Payment Market Volume (No of Payment in Bn) Forecast and CAGR, by Country, 2015–2025
Table 19: APAC Contactless Payment Market Revenue (US$ Bn) Forecast and CAGR, by Mode of Payment, 2015–2025
Table 20: APAC Contactless Payment Market Volume (No of Payment in Bn) Forecast and CAGR, by Mode of Payment, 2015–2025
Table 21: APAC Contactless Payment Market Revenue (US$ Bn) Forecast and CAGR, by End-Use, 2015–2025
Table 22: APAC Contactless Payment Market Volume (No of Payment in Bn) Forecast and CAGR, by End-Use, 2015–2025
Table 23: APAC Contactless Payment Market Revenue (US$ Bn) Forecast and CAGR, by Country, 2015–2025
Table 24: APAC Contactless Payment Market Volume (No of Payments in Bn) Forecast and CAGR, by Country, 2015–2025
Table 25: MEA Contactless Payment Market Revenue (US$ Bn) Forecast and CAGR, by Mode of Payment, 2015–2025
Table 26: MEA Contactless Payment Market Volume (No of Payment in Bn) Forecast and CAGR, by Mode of Payment, 2015–2025
Table 27: MEA Contactless Payment Market Revenue (US$ Bn) Forecast and CAGR, by End-Use, 2015–2025
Table 28: MEA Contactless Payment Market Volume (No of Payment in Bn) Forecast and CAGR, by End-Use, 2015–2025
Table 29: MEA Contactless Payment Market Revenue (US$ Bn) Forecast and CAGR, by Country, 2015–2025
Table 30: MEA Contactless Payment Market Volume (No of Payment in Bn) Forecast and CAGR, by Country, 2015–2025
Table 31: South America Contactless Payment Market Revenue (US$ Bn) Forecast and CAGR, by Mode of Payment, 2015–2025
Table 32: South America Contactless Payment Market Volume (No of Payment in Bn) Forecast and CAGR, by Mode of Payment, 2015–2025
Table 33: South America Contactless Payment Market Revenue (US$ Bn) Forecast and CAGR, by End-Use, 2015–2025
Table 34: South America Contactless Payment Market Volume (No of Payment in Bn) Forecast and CAGR, by End-Use, 2015–2025
Table 35: South America Contactless Payment Market Revenue (US$ Bn) Forecast and CAGR, by Country, 2015–2025
Table 36: South America Contactless Payment Market Volume (No of Payment in Bn) Forecast and CAGR, by Country, 2015–2025
List of Figures
Figure 1: Global Contactless Payment Market- Share Analysis
Figure 2: Global Contactless Payment Market, by Region, 2025
Figure 3: Global Contactless Payment Market Revenue Projection (US$ Bn), 2015 – 2025
Figure 4: Global Contactless Payment Market Volume Projection, (No of Payment in Bn), 2015 – 2025
Figure 5: Global Contactless Payment Market Volume Share (%), by Region, 2015 – 2025
Figure 6: Global Contactless Payment Market CAGR by Mode of Payment (2017 – 2025)
Figure 7: Global Contactless Payment Market CAGR by End-Use (2017 – 2025)
Figure 8: Global Contactless Payment Market CAGR by Region (2017 – 2025)
Figure 9: Comparison Matrix by mode of payment
Figure 10: Comparison Matrix by End-Use
Figure 11: Global Contactless Payment Market Volume and Y-o-Y Growth, by Region – North America, 2015 – 2025, (No of payment in Bn & %)
Figure 12: Global Contactless Payment Market Volume and Y-o-Y Growth, by Region – Europe, 2015 – 2025, (No of payment in Bn & %)
Figure 13: Global Contactless Payment Market Volume and Y-o-Y Growth, by Region – APAC, 2015 – 2025, (No of Payments in Bn & %)
Figure 14: Global Contactless Payment Market Volume and Y-o-Y Growth, by Region – MEA, 2015 – 2025, (No of Payments in Bn & %)
Figure 15: Global Contactless Payment Market Volume and Y-o-Y Growth, by Region – South America, 2015 – 2025, (No of Payments in Bn & %)
Figure 16: Global Contactless Payment Market Attractiveness Analysis, by Mode of Payment (2016)
Figure 17: Global Contactless Payment Market Attractiveness Analysis, By End-Use (2016)
Figure 18: Global Contactless Payment Market Attractiveness Analysis, By Region (2016)
Figure 19: North America Contactless Payment Market Volume and Y-o-Y Growth, by Country – The U.S., 2015 – 2025, (No of Payments in Bn & %)
Figure 20: North America Contactless Payment Market Volume and Y-o-Y Growth, by Country – Canada, 2015 – 2025, (No of Payments in Bn & %)
Figure 21: North America Contactless Payment Market Attractiveness Analysis, by Mode of Payment (2016)
Figure 22: North America Contactless Payment Market Attractiveness Analysis, By End-Use (2016)
Figure 23: North America Contactless Payment Market Attractiveness Analysis, By Country (2016)
Figure 24: Europe Contactless Payment Market Volume and Y-o-Y Growth, by Country – The U.K., 2015 – 2025, (No of Payments in Bn & %)
Figure 25: Europe Contactless Payment Market Volume and Y-o-Y Growth, by Country – Germany, 2015 – 2025, (No of Payments in Bn & %)
Figure 26: Europe Contactless Payment Market Volume and Y-o-Y Growth, by Country – Poland, 2015 – 2025, (No of Payments in Bn & %)
Figure 27: Europe Contactless Payment Market Volume and Y-o-Y Growth, by Country – Sweden, 2015 – 2025, (No of Payments in Bn & %)
Figure 28: Europe Contactless Payment Market Volume and Y-o-Y Growth, by Country – France, 2015 – 2025, (No of Payments in Bn & %)
Figure 29: Europe Contactless Payment Market Attractiveness Analysis, by Mode of Payment (2016)
Figure 30: Europe Contactless Payment Market Attractiveness Analysis, By End-Use (2016)
Figure 31: Europe Contactless Payment Market Attractiveness Analysis, By Region (2016)
Figure 32: APAC Contactless Payment Market Volume and Y-o-Y Growth, by Country – India, 2015 – 2025, (No of Payments in Bn & %)
Figure 33: APAC Contactless Payment Market Volume and Y-o-Y Growth, by Country – China, 2015 – 2025, (No of Payments in Bn & %)
Figure 34: APAC Contactless Payment Market Size and Y-o-Y Growth, by Country – Japan, 2015 – 2025, (No of Payments in Bn & %)
Figure 35: APAC Contactless Payment Market Size and Y-o-Y Growth, by Country – Australia, 2015 – 2025, (No of Payments in Bn & %)
Figure 36: APAC Contactless Payment Market Size and Y-o-Y Growth, by Country – South Korea, 2015 – 2025, (No of Payments in Bn & %)
Figure 37: APAC Contactless Payment Market Size and Y-o-Y Growth, by Country – Taiwan, 2015 – 2025, (No of Payments in Bn & %)
Figure 38: APAC Contactless Payment Market Size and Y-o-Y Growth, by Country – Singapore, 2015 – 2025, (No of Payments in Bn & %)
Figure 39: APAC Contactless Payment Market Attractiveness Analysis, by Mode of Payment (2016)
Figure 40: APAC Contactless Payment Market Attractiveness Analysis, By End-Use (2016)
Figure 41: APAC Contactless Payment Market Attractiveness Analysis, By Region (2016)
Figure 42: MEA Contactless Payment Market Volume and Y-o-Y Growth, by Country – UAE, 2015 – 2025, (No of Payments in Bn & %)
Figure 43: MEA Contactless Payment Market Volume and Y-o-Y Growth, by Country – Turkey, 2015 – 2025, (No of Payments in Bn & %)
Figure 44: MEA Contactless Payment Market Volume and Y-o-Y Growth, by Country – Saudi Arabia, 2015 – 2025, (No of Payments in Bn & %)
Figure 45: MEA Contactless Payment Market Volume and Y-o-Y Growth, by Country – South Africa, 2015 – 2025, (No of Payments in Bn & %)
Figure 46: MEA Contactless Payment Market Attractiveness Analysis, by Mode of Payment (2016)
Figure 47: MEA Contactless Payment Market Attractiveness Analysis, By End-Use (2016)
Figure 48: MEA Contactless Payment Market Attractiveness Analysis, By Country (2016)
Figure 49: South America Contactless Payment Market Volume and Y-o-Y Growth, by Country – Brazil, 2015 – 2025, (No of Payments in Bn & %)
Figure 50: South America Contactless Payment Market Volume and Y-o-Y Growth, by Country – Argentina, 2015 – 2025, (No of Payments in Bn & %)
Figure 51: South America Contactless Payment Market Attractiveness Analysis, by Mode of Payment (2016)
Figure 52: South America Contactless Payment Market Attractiveness Analysis, By End-Use (2016)
Figure 53: South America Contactless Payment Market Attractiveness Analysis, By Region (2016)
Figure 54: Apple Inc. Net Sales, by Region, 2016
Figure 55: Apple Inc. Revenue (US$ Mn) & Y-o-Y Growth (%), 2014–2016
Figure 56: Barclays Revenue (US$ Mn) & Y-o-Y Growth (%), 2015–2016
Figure 57: Gemalto NV Net Sales, by Region, 2016
Figure 58: Gemalto NV Revenue (US$ Mn) & Y-o-Y Growth (%), 2014–2016
Figure 59: Giesecke & Devrient GmbH Revenue (US$ Mn) & Y-o-Y Growth (%), 2014–2016
Figure 60: Heartland Payment Systems, Inc. Revenue (US$ Mn) & Y-o-Y Growth (%), 2013–2015
Figure 61: Ingenico Group Revenue (US$ Mn) & Y-o-Y Growth (%), 2014–2016
Figure 62: Inside Secure Revenue (US$ Mn) & Y-o-Y Growth (%), 2014–2016
Figure 63: On Track Innovations LTD. Net Sales, by Region, 2016
Figure 64: On Track Innovations LTD. Revenue (US$ Mn) & Y-o-Y Growth (%), 2014–2016
Figure 65: Samsung Electronics Ltd. Net Sales, by Region, 2015
Figure 66: Samsung Electronics Ltd. Revenue (US$ Mn) & Y-o-Y Growth (%), 2013–2015
Figure 67: VeriFone Systems, Inc. Net Sales, by Region, 2016
Figure 68: VeriFone Systems, Inc. Revenue (US$ Mn) & Y-o-Y Growth (%), 2014–2016
Figure 69: Wirecard AG Revenue (US$ Mn) & Y-o-Y Growth (%), 2014–2016
Copyright © Transparency Market Research, Inc. All Rights reserved
Trust Online

Contactless Payment Transaction Market Outlook, Trends, Analysis