
In the current day and age, due to advancements in digital technologies and high adoption of electronic devices, computer graphics have gradually gained considerable attention over the past couple of decades. In addition, evolving consumer trends and growing demand for improved graphical representation of characters, objects, etc. in films, animated movies, and among others, has accelerated innovations in the computer graphics market over the past decade– a trend that is expected to continue during the forecast period. Another factor that is likely to play a key role in boosting the overall prospects of the global computer graphics market is the surge in the number of smartphone, tablet, and computer users across the world, particularly in the Asia Pacific region.
The growing dependency on computers in practically all the core industrial domains, including automotive, building & construction, aerospace, defense, packaging, oil & gas is expected to provide abundant opportunities for players operating in the current computer graphics landscape during the assessment period. Advancements in computer programming and widening applications of computer graphics are projected to lay a solid foundation for market growth in the upcoming years. The demand for both, interactive as well as non-interactive computer graphics has witnessed consistent growth over the past few years and as per current estimates, the trend is expected to continue in the forthcoming years.
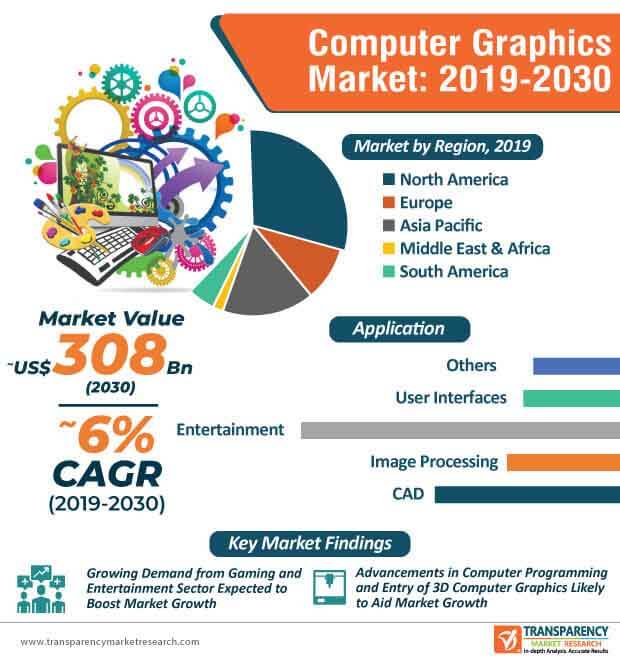
At the back of these factors, the global computer graphics market is expected attain a market value of US$ 308.6 Bn by the end of 2030.
Request a sample to get extensive insights into the Computer Graphics Market
At present, computer-generated imagery (CGI) is increasingly being used to develop animated visual content in sci-fi movies, animated films, games, etc. The advent of 3D computer graphics has played an essential role in revolutionizing the computer graphics market, which has entered a new era. Computer graphics is extensively used in an array of applications across the film making sector such as character creation, adding special effects, etc. Advancements in computer hardware is another major factor that is expected to augment the demand for computer graphics in the entertainment sector to create production-ready imagery models.
In addition, as computer graphics are comparatively more cost-effective than creating real physical effects, the demand for computer graphics is projected to witness a substantial growth during the forecast period.
To understand how our report can bring difference to your business strategy, Ask for a brochure
The advent of 3D computer graphics has played a pivotal role in transforming the gaming sector, as game developers are increasingly focusing on the development of realistic games to fulfil the consumer demands. Over the past few years, game developers are increasingly emphasizing on recreating the computer graphics used in movies– another factor that is anticipated to provide an impetus for the growth of the computer graphics market during the assessment period. The entry of 3D computer graphics has primarily assisted game developers to develop realistic textures, compute physical characteristics, and sanction in-game interactions among objects in an efficient manner. Moreover, the growing popularity of online and multi-players gaming is expected to provide fertile opportunities for players operating in the computer graphics market.
The demand for computer graphics is expected to witness steady growth amid the ongoing novel COVID-19 pandemic. Due to stringent lockdowns imposed by governments as a measure to restrict the transmission of the novel coronavirus, commercial spaces, corporate offices, recreational centers, and other facilities have remained shut for a majority of the year 2020 around the world due to which, online traffic has witnessed an unprecedented surge in the first two quarters of 2020. Furthermore, online gaming has received tremendous boost amid the ongoing COVID-19 pandemic due to which, game developers are under considerable pressure to improve the visual content of their games– a factor that is expected to boost the expansion of the computer graphics market amid the ongoing pandemic. In addition, surge in the consumption of online content on OTT platforms is another factor that is anticipated to boost the overall prospects of the global computer graphics market during the COVID-19 era.
Stuck in a neck-to-neck competition with other brands? Request a custom report on Computer Graphics Market
Analysts’ Viewpoint
The global computer graphics market is expected to expand at a healthy CAGR of ~6% during the forecast period. The market growth can be primarily attributed to a host of factors, including soaring demand from the entertainment sector, rising adoption from the gaming industry, advancements in computer programming, and entry of 3D computer graphics. Market players are projected to tap into opportunities across other industrial sectors to increase their market share and presence in the current market landscape. Market players should focus on capitalizing on the opportunities across the healthcare sector, particularly during the COVID-19 pandemic to gain a competitive edge.
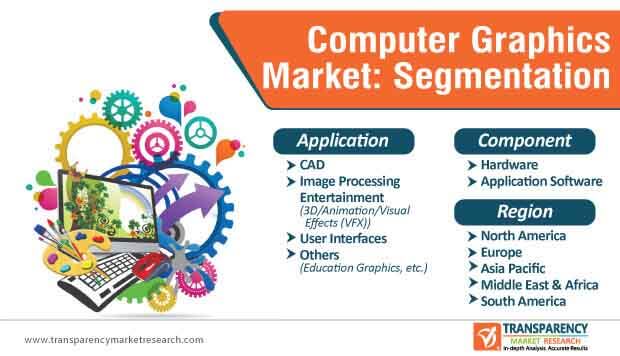
Computer Graphics Market – Segmentation
TMR’s research study assesses the computer graphics market on the basis of component, application, and region. Revenue data is estimated for all the below mentioned segments.
|
Component |
|
|
Application |
|
|
Region |
|
1. Preface
1.1. Market Introduction
1.2. Market Segmentation
1.3. Key Research Objectives
2. Assumptions and Research Methodology
2.1. Research Methodology
2.1.1. List of Primary and Secondary Sources
2.2. Key Assumptions for Data Modelling
3. Executive Summary - Global Computer Graphics Market
4. Market Overview
4.1. Market Definition
4.2. Macroeconomic Factors
4.2.1. World GDP Indicator - For Top Economies
4.2.2. Global ICT Spending (US$ Bn)
4.3. Technology/ Product Roadmap
4.4. Market Factor Analysis
4.4.1. Porter’s Five Force Analysis
4.4.2. Ecosystem/ Value Chain Analysis
4.4.3. Market Dynamics (Growth Influencers)
4.4.3.1. Drivers
4.4.3.2. Restraints
4.4.3.3. Opportunities
4.4.3.4. Impact Analysis of Drivers and Restraints
4.5. Global VFX Industry Analysis
4.5.1. Key Technology Trends
4.5.2. Key Challenges
4.5.3. Opportunities, By Region
4.5.4. Production Cost of VFX
4.5.5. Key VFX Technology Tool Providers
4.5.6. Major Global VFX Players and Gross Earning/Sales
4.6. Market Opportunity Assessment - by Region (North America/ Europe/ Asia Pacific/ Middle East & Africa/ South America)
4.6.1. By Component
4.6.2. By Application
4.7. Competitive Scenario and Trends
4.7.1. Computer Graphics Market Concentration Rate
4.7.1.1. List of Emerging, Prominent and Leading Players
4.7.2. Mergers & Acquisitions, Expansions
4.8. Market Outlook
5. Global Computer Graphics Market Analysis and Forecast
5.1. Market Revenue Analysis (US$ Bn), 2015-2030
5.1.1. Historic Growth Trends, 2015-2019
5.1.2. Forecast Trends, 2020-2030
5.2. Pricing Model Analysis/ Price Trend Analysis
6. Global Computer Graphics Market Analysis, by Component
6.1. Overview and Definitions
6.2. Key Segment Analysis
6.3. Computer Graphics Market Size (US$ Bn) Forecast, by Component, 2018 - 2030
6.3.1. Hardware
6.3.2. Application Software
7. Global Computer Graphics Market Analysis, by Application
7.1. Overview and Definitions
7.2. Key Segment Analysis
7.3. Computer Graphics Market Size (US$ Bn) Forecast, by Application, 2018 - 2030
7.3.1. CAD
7.3.2. Image Processing
7.3.3. Entertainment
7.3.4. User Interfaces
7.3.5. Others (Education Graphics, etc.)
8. Global Computer Graphics Market Analysis and Forecast, By Region
8.1. Key Findings
8.2. Computer Graphics Market Size (US$ Bn) Forecast, by Region, 2018 - 2030
8.2.1. North America
8.2.2. Europe
8.2.3. Asia Pacific
8.2.4. Middle East & Africa
8.2.5. South America
9. North America Computer Graphics Market Analysis
9.1. Regional Outlook
9.2. Computer Graphics Market Size (US$ Bn) Analysis and Forecast (2018 - 2030)
9.2.1. By Component
9.2.2. By Application
9.3. Computer Graphics Market Size (US$ Bn) Forecast, by Country & Sub-region, 2018 - 2030
9.3.1. U.S.
9.3.2. Canada
9.3.3. Rest of North America
10. Europe Computer Graphics Market Analysis and Forecast
10.1. Regional Outlook
10.2. Computer Graphics Market Size (US$ Bn) Analysis and Forecast (2018 - 2030)
10.2.1. By Component
10.2.2. By Application
10.3. Computer Graphics Market Size (US$ Bn) Forecast, by Country & Sub-region, 2018 - 2030
10.3.1. Germany
10.3.2. U.K.
10.3.3. France
10.3.4. Spain
10.3.5. Italy
10.3.6. Rest of Europe
11. APAC Computer Graphics Market Analysis and Forecast
11.1. Regional Outlook
11.2. Computer Graphics Market Size (US$ Bn) Analysis and Forecast (2018 - 2030)
11.2.1. By Component
11.2.2. By Application
11.3. Computer Graphics Market Size (US$ Bn) Forecast, by Country & Sub-region, 2018 - 2030
11.3.1. China
11.3.2. India
11.3.3. Japan
11.3.4. Australia
11.3.5. Rest of Asia Pacific
12. Middle East & Africa (MEA) Computer Graphics Market Analysis and Forecast
12.1. Regional Outlook
12.2. Computer Graphics Market Size (US$ Bn) Analysis and Forecast (2018 - 2030)
12.2.1. By Component
12.2.2. By Application
12.3. Computer Graphics Market Size (US$ Bn) Forecast, by Country & Sub-region, 2018 - 2030
12.3.1. Saudi Arabia
12.3.2. The United Arab Emirates
12.3.3. South Africa
12.3.4. Rest of Middle East & Africa (MEA)
13. South America Computer Graphics Market Analysis and Forecast
13.1. Regional Outlook
13.2. Computer Graphics Market Size (US$ Bn) Analysis and Forecast (2018 - 2030)
13.2.1. By Component
13.2.2. By Application
13.3. Computer Graphics Market Size (US$ Bn) Forecast, by Country & Sub-region, 2018 - 2030
13.3.1. Brazil
13.3.2. Argentina
13.3.3. Rest of South America
14. Competition Landscape
14.1. Market Competition Matrix, by Leading Players
14.2. Market Revenue Share Analysis (%), by Leading Players (2019)
15. Company Profiles
15.1. Advanced Micro Devices (AMD), Inc.
15.1.1. Business Overview
15.1.2. Product Portfolio
15.1.3. Geographical Footprint
15.1.4. Revenue and Strategy
15.2. ARM Ltd.
15.2.1. Business Overview
15.2.2. Product Portfolio
15.2.3. Geographical Footprint
15.2.4. Revenue and Strategy
15.3. Intel Corporation
15.3.1. Business Overview
15.3.2. Product Portfolio
15.3.3. Geographical Footprint
15.3.4. Revenue and Strategy
15.4. Imagination Technologies Limited
15.4.1. Business Overview
15.4.2. Product Portfolio
15.4.3. Geographical Footprint
15.4.4. Revenue and Strategy
15.5. Nvidia Corporation
15.5.1. Business Overview
15.5.2. Product Portfolio
15.5.3. Geographical Footprint
15.5.4. Revenue and Strategy
15.6. Sony Corporation
15.6.1. Business Overview
15.6.2. Product Portfolio
15.6.3. Geographical Footprint
15.6.4. Revenue and Strategy
15.7. Adobe Systems Ltd.
15.7.1. Business Overview
15.7.2. Product Portfolio
15.7.3. Geographical Footprint
15.7.4. Revenue and Strategy
15.8. Siemens PLM Software
15.8.1. Business Overview
15.8.2. Product Portfolio
15.8.3. Geographical Footprint
15.8.4. Revenue and Strategy
15.9. Autodesk Inc.
15.9.1. Business Overview
15.9.2. Product Portfolio
15.9.3. Geographical Footprint
15.9.4. Revenue and Strategy
15.10. Microsoft Corporation
15.10.1. Business Overview
15.10.2. Product Portfolio
15.10.3. Geographical Footprint
15.10.4. Revenue and Strategy
15.11. Dassault Systems SA
15.11.1. Business Overview
15.11.2. Product Portfolio
15.11.3. Geographical Footprint
15.11.4. Revenue and Strategy
16. Key Takeaways
List of Tables
Table 1: Movie - Average Estimated Production Cost/Shot
Table 2: 3D Animated Movie - Average Estimated Production Cost/Second
Table 3: Key VFX Technology Tool Providers - Part A
Table 4: Key VFX Technology Tool Providers - Part B
Table 5: Major Global VFX Players and Gross Earning/Sales
Table 6: Global Computer Graphics Market Revenue (US$ Bn) Forecast and CAGR, by Component, 2018-2030
Table 7: Global Computer Graphics Market Size (US$ Bn) Forecast and CAGR, by Application, 2018 - 2030
Table 8: Global Computer Graphics Market Revenue (US$ Bn) Forecast and CAGR, by Region, 2018-2030
Table 9: North America Computer Graphics Market Revenue (US$ Bn) Forecast and CAGR, by Component, 2018-2030
Table 10: North America Computer Graphics Market Revenue (US$ Bn) Forecast and CAGR, by Application, 2018-2030
Table 11: North America Computer Graphics Market Revenue (US$ Bn) Forecast and CAGR, by Country, 2018 - 2030
Table 12: Europe Computer Graphics Market Revenue (US$ Bn) Forecast and CAGR, by Component, 2018-2030
Table 13: Europe Computer Graphics Market Size (US$ Bn) Forecast and CAGR, by Application, 2018-2030
Table 14: Europe Computer Graphics Market Revenue (US$ Bn) Forecast and CAGR, by Country, 2018 - 2030
Table 15: Asia Pacific Computer Graphics Market Revenue (US$ Bn) Forecast and CAGR, by Component, 2018-2030
Table 16: Asia Pacific Computer Graphics Market Revenue (US$ Bn) Forecast and CAGR, by Application, 2018-2030
Table 17: Asia Pacific Computer Graphics Market Revenue (US$ Bn) Forecast and CAGR, by Country, 2018 - 2030
Table 18: Middle East and Africa Computer Graphics Market Revenue (US$ Bn) Forecast and CAGR, by Component, 2018-2030
Table 19: Middle East and Africa Computer Graphics Market Revenue (US$ Bn) Forecast and CAGR, by Application, 2018-2030
Table 20: Middle East & Africa Computer Graphics Market Revenue (US$ Bn) Forecast and CAGR, by Country, 2018 - 2030
Table 21: South America Computer Graphics Market Revenue (US$ Bn) Forecast and CAGR, by Component, 2018-2030
Table 22: South America Computer Graphics Market Revenue (US$ Bn) Forecast and CAGR, by Application, 2018-2030
Table 23: South America Computer Graphics Market Revenue (US$ Bn) Forecast and CAGR, by Country, 2018 - 2030
Table 24: South America Computer Graphics Market Revenue (US$ Bn) Forecast and CAGR, by Application, 2018-2030
Table 25: South America Computer Graphics Market Revenue (US$ Bn) Forecast and CAGR, by Country, 2018 - 2030
Table 25: South America Computer Graphics Market Revenue (US$ Bn) Forecast and CAGR, by Country, 2018 - 2030
List of Figures
Figure 1: Global Computer Graphics Market Size, Indicative (US$ Bn)
Figure 2: Global Computer Graphics Market - Top Segment
Figure 3: Global Computer Graphics Market - Top Segment, % Share
Figure 4: Global Computer Graphics Market Share, by Region
Figure 5: Global Computer Graphics Market Overview
Figure 6: Global Computer Graphics Market Revenue Projection (US$ Bn), 2018 - 2030
Figure 7: Global Computer Graphics Market Y-o-Y Growth (Value %) Forecast, 2018 - 2030
Figure 8: Global Computer Graphics Market Revenue Projection (US$ Bn), by Region, 2018 - 2030
Figure 9: Global VFX Market Size and CAGR, 2019 & 2030 (US$ Bn and Value %)
Figure 10: Key Steps Involved in Animation/VFX Creation
Figure 11: Ecosystem Analysis
Figure 12: Market Value Share by Component (2019)
Figure 13: Market Value Share by Application (2019)
Figure 14: Market Value Share by Region (2019)
Figure 15: Global Market CAGR by Component (2020 - 2030)
Figure 16: Global Market CAGR by Application (2020 - 2030)
Figure 17: Global Market CAGR by Region (2020 - 2030)
Figure 18: Global Computer Graphics Market Revenue and Y-o-Y Growth, by Component- Hardware, 2018 - 2030, (US$ Bn and Value %)
Figure 19: Global Computer Graphics Market Revenue and Y-o-Y Growth, by Component- Application Software, 2018 - 2030, (US$ Bn and Value %)
Figure 20: Global Computer Graphics Market Component Comparison Matrix
Figure 21: Global Computer Graphics Market Value Share Analysis by Component, 2020 and 2030
Figure 22: Global Computer Graphics Market Attractiveness Analysis by Component
Figure 23: Global Computer Graphics Market Revenue and Y-o-Y Growth, by Application - CAD, 2018 - 2030, (US$ Bn and Value %)
Figure 24: Global Computer Graphics Market Revenue and Y-o-Y Growth, by Application - Image Processing, 2018 - 2030, (US$ Bn and Value %)
Figure 25: Global Computer Graphics Market Revenue and Y-o-Y Growth, by Application - Entertainment, 2018 - 2030, (US$ Bn and Value %)
Figure 26: Global Computer Graphics Market Revenue and Y-o-Y Growth, by Application - User Interfaces, 2018 - 2030, (US$ Bn and Value %)
Figure 27: Global Computer Graphics Market Revenue and Y-o-Y Growth, by Application - Others, 2018 - 2030, (US$ Bn and Value %)
Figure 28: Global Computer Graphics Market Application Comparison Matrix
Figure 29: Global Computer Graphics Market Value Share Analysis by Application, 2020 and 2030
Figure 30: Global Computer Graphics Market Attractiveness Analysis by Application
Figure 31: Global Computer Graphics Market Region Comparison Matrix
Figure 32: Global Computer Graphics Market Value Share Analysis by Region, 2020 and 2030
Figure 33: Global Computer Graphics Market Attractiveness Analysis, by Region
Figure 34: North America Computer Graphics Market Revenue (US$ Bn), 2018 - 2030
Figure 35: North America Computer Graphics Market Y-o-Y Growth, 2018 - 2030
Figure 36: North America Computer Graphics Market Value Share Analysis by Component, 2020 and 2030
Figure 37: North America Computer Graphics Market Value Share Analysis by Application, 2020 and 2030
Figure 38: North America Computer Graphics Market Share Analysis, by Country, 2020 and 2030
Figure 39: North America Computer Graphics Market Attractiveness Analysis, by Country (2019)
Figure 40: North America Computer Graphics Market Attractiveness Analysis, by Component (2019)
Figure 41: North America Computer Graphics Market Attractiveness Analysis, by Application (2019)
Figure 42: Europe Computer Graphics Market Revenue (US$ Bn), 2018 - 2030
Figure 43: Europe Computer Graphics Market Y-o-Y Growth, 2018 - 2030
Figure 44: Europe Computer Graphics Market Value Share Analysis by Component, 2020 and 2030
Figure 45: Europe Computer Graphics Market Value Share Analysis by Application, 2020 and 2030
Figure 46: Europe Computer Graphics Market Value Share Analysis, by Country, 2020 and 2030
Figure 47: Europe Computer Graphics Market Attractiveness Analysis, by Country (2019)
Figure 48: Europe Computer Graphics Market Attractiveness Analysis, by Component (2019)
Figure 49: Europe Computer Graphics Market Attractiveness Analysis, by Application (2019)
Figure 50: Asia Pacific Computer Graphics Market Revenue, 2018 - 2030, (US$ Bn)
Figure 51: Asia Pacific Computer Graphics Market Y-o-Y Growth, 2018 - 2030
Figure 52: Asia Pacific Computer Graphics Market Value Share Analysis by Component, 2020 and 2030
Figure 53: Asia Pacific Computer Graphics Market Value Share Analysis by Application, 2020 and 2030
Figure 54: Asia Pacific Computer Graphics Market Value Share Analysis, by Country, 2016 & 2024
Figure 55: Asia Pacific Computer Graphics Market Attractiveness Analysis, by Country (2019)
Figure 56: Asia Pacific Computer Graphics Market Attractiveness Analysis, by Component (2019)
Figure 57: Asia Pacific Computer Graphics Market Attractiveness Analysis, by Application (2019)
Figure 58: Middle East & Africa Computer Graphics Market Revenue, 2018 - 2030, (US$ Bn)
Figure 59: Middle East & Africa Computer Graphics Market Y-o-Y Growth, 2018 - 2030
Figure 60: Middle East & Africa Computer Graphics Market Value Share Analysis by Component, 2020 and 2030
Figure 61: Middle East & Africa Computer Graphics Market Value Share Analysis by Application, 2020 and 2030
Figure 62: Middle East & Africa Computer Graphics Market Value Share Analysis by Country, 2020 and 2030
Figure 63: Middle East & Africa Computer Graphics Market Attractiveness Analysis, by Country (2019)
Figure 64: Middle East & Africa Computer Graphics Market Attractiveness Analysis, by Component (2019)
Figure 65: Middle East & Africa Computer Graphics Market Attractiveness Analysis, by Application (2019)
Figure 66: South America Computer Graphics Market Revenue, 2018 - 2030, (US$ Bn)
Figure 67: South America Computer Graphics Market Y-o-Y Growth (%), 2018 - 2030
Figure 68: South America Computer Graphics Market Value Share Analysis by Component, 2020 and 2030
Figure 69: South America Computer Graphics Market Value Share Analysis by Application, 2020 and 2030
Figure 70: South America Computer Graphics Market Value Share Analysis, by Country, 2020 and 2030
Figure 71: South America Computer Graphics Market Attractiveness Analysis, by Country (2019)
Figure 72: South America Computer Graphics Market Attractiveness Analysis, by Component (2019)
Figure 73: South America Computer Graphics Market Attractiveness Analysis, by Application (2019)
Figure 74: Global Computer Graphics Market Share Analysis by Company (2019)
Figure 75: South America Computer Graphics Market Attractiveness Analysis, by Component (2019)
Figure 76: South America Computer Graphics Market Attractiveness Analysis, by Application (2019)
Figure 77: Global Computer Graphics Market Share Analysis by Company (2019)
Copyright © Transparency Market Research, Inc. All Rights reserved
Trust Online


Computer Graphics Market