
Reports
Reports
Analysts’ Viewpoint on Combined Heat and Power (CHP) Installation Market Scenario
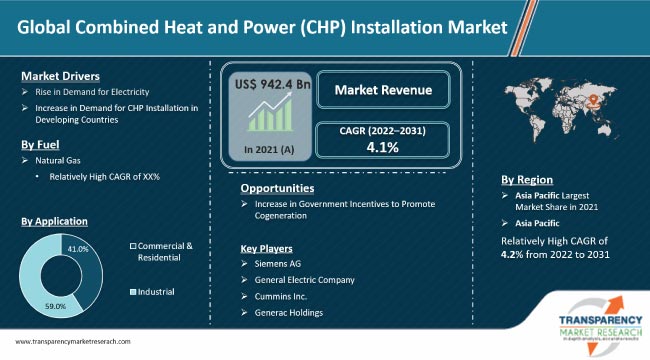
Surge in demand for electricity is driving the global Combined Heat and Power (CHP) installation market. Demand for Combined Heat and Power (CHP) installation is likely to increase owing to the economic prosperity of the population. Environmental benefits and implementation of stringent governmental policies to reduce carbon emissions have led to rapid adoption of autogas as a preferred fuel around the world. Thus, government programs and incentives, particularly in countries such as the U.S., U.K., Germany, and Japan, are estimated to drive the growth prospects for CHP (combined heat and power) market. Higher efficiency of gas turbines and reliable generation capacity give them an edge over other distributed generation technologies for providing backup power capacity and meeting onsite generation needs. Thus, rise in distributed power generation is one of the emerging trends of the CHP (combined heat and power) installation market.
Cogeneration or Combined Heat and Power (CHP) refers to the usage of a heat engine or power station to generate electricity and heat at the same time. The conventional power plant produces electricity through a fairly inefficient process. Fossil fuels such as oil, coal, and natural gas are burned in a giant furnace to release heat energy. The heat is used to boil water and produce steam. The steam drives a turbine, which, in turn, drives the generator. The generator produces electricity.
Combined Heat and Power (CHP) installation is widely used in various applications such as commercial buildings (including office buildings, hotels, and nursing homes); retail; residential—multifamily buildings; co-ops; planned communities; institutions (colleges and universities, hospitals, and prisons); military bases; municipal systems such as district energy systems; wastewater treatment facilities; and industrial facilities.
Of late, industrialization and urbanization have increased significantly across the globe. This has boosted the demand for electricity across the world. Global demand for electricity is expected to increase at 2.1% per year to 2040, i.e. twice the rate of the primary energy demand. Thus, demand for Combined Heat and Power (CHP) installation infrastructure is likely to rise in the near future. Governments of various countries are focusing on renewable energy to cater to the high demand for electricity. This rise in demand for electricity is expected to boost the demand for combined heat and power system across the globe. Thus, increase in demand for electricity is anticipated to drive the global Combined Heat and Power (CHP) installation market during the forecast period.
Significant growth in globalization, industrialization, and urbanization has led to a shift in the flow of investment from developed countries to developing countries. This can be ascribed to lower infrastructure and labor costs in developing countries. Environmental rules and regulations are also not stringent in developing countries. This provides an added advantage to companies. Increase in industrialization and urbanization has led to a rise in household income as well as disposable income of the middle class and lower middle-class population. This has resulted in the adoption of combined heat and power basics in residential and transportation sectors.
Governments of various countries are taking initiatives to promote the usage of Combined Heat and Power (CHP) installation. For instance, increase in awareness about environment-related issues and implementation of stringent rules and regulations by regulatory authorities have compelled companies to seek green solutions. Of late, Combined Heat and Power (CHP) installation is being increasingly used as a substitute for gasoline and diesel. Combined Heat and Power (CHP) Installation is a clean fuel. The usage of Combined Heat and Power (CHP) installation offers a cost-effective solution to companies. Thus, rise in demand for Combined Heat and Power (CHP) installation in developing countries such as China, India, Indonesia, Brazil, Mexico, and Nigeria for commercial & residential and various other industrial uses is projected to drive the market value of the CHP (Combined Heat and Power) installation during the forecast period.
In terms of fuel, the global Combined Heat and Power (CHP) installation market has been segregated into biomass, coal, and natural gas. The natural gas segment held major share of 60% of the global market in 2021. Abundant availability and low pricing of natural gas make it an ideal fuel for usage in CHP systems. Besides, natural gas is perceived as a clean source of energy that helps in curbing carbon emissions. The segment is estimated to dominate the market during the forecast period. Biomass and coal segments are estimated to grow at a steady pace during the forecast period.
In terms of prime mover, the global Combined Heat and Power (CHP) installation market has been divided into the steam turbine, combined cycle, gas turbine, reciprocating engine, and others. The combined cycle segment held significant share of the global market in 2021. It is likely to be the fastest growing market for CHP (combined heat and power) installation during the forecast period due to its high degree of flexibility, high power output, and diverse applications in various industries.
The steam turbine segment accounted for 28.7% share of the market in 2021. Demand for steam turbine is likely to rise at a steady pace during the forecast period due to the increase in environmental concerns regarding diesel emissions across the globe.
In terms of application, the global Combined Heat and Power (CHP) installation market has been bifurcated into commercial & residential and industrial. The industrial segment held larger share of 59% of the global market in 2021, as CHP systems are primarily employed in the industrial sector with high demand for energy such as refining, chemicals, cement, paper and pulp, sugar, and pharmaceuticals. Non-fuel operation, low installation and maintenance costs, thermal output, fuel availability, low emission, and energy efficiency are some of the benefits of CHP installation in industrial applications.
Asia Pacific accounted for prominent share of 55.4% of the global market in 2021. The market in the region is projected to grow at a notable pace during the forecast period. China is a key market for Combined Heat and Power (CHP) installation in Asia Pacific. This Government of China has been promoting Combined Heat and Power (CHP) installation for cooking in rural areas since the last few years. Investments in large new gas-fired cogeneration plants and large coal-fired plants along with rising demand for electricity is expected to drive the CHP installation market in Asia Pacific in the next few years. North America is also a key market for Combined Heat and Power (CHP) installation. The region held 25.7% share of the global market in 2021.
The global Combined Heat and Power (CHP) Installation market is consolidated, with a small number of large-scale vendors controlling majority of the share. Most of the companies are spending significantly in comprehensive research and development activities to develop environmentally-friendly systems. Key players operating in the Combined Heat and Power (CHP) installation market are Siemens Energy AG, 2G Energy Inc., Capstone Turbine Corporation, Aegis Energy Services, Inc., Cummins Inc., Wärtsilä, General Electric Company, Aegis Energy Services Inc., Generac Holdings Inc., Primary Energy Recycling Corporation, and Integral Power.
Each of these players has been profiled in the Combined Heat and Power (CHP) installation market report based on parameters such as company overview, financial overview, business strategies, product portfolio, business segments, and recent developments.
|
Attribute |
Detail |
|
Market Size Value in 2021 |
US$ 942.4 Bn |
|
Market Forecast Value in 2031 |
US$ 1.4 Trn |
|
Growth Rate (CAGR) |
4.1% |
|
Forecast Period |
2022–2031 |
|
Historical Data Available for |
2020 |
|
Quantitative Units |
US$ Bn/Trn for Value and GW for Volume |
|
Market Analysis |
It includes cross segment analysis at global as well as regional level. Furthermore, qualitative analysis includes drivers, restraints, opportunities, key trends, Porter’s Five Forces analysis, value chain analysis, and key trend analysis. |
|
Competition Landscape |
|
|
Format |
Electronic (PDF) + Excel |
|
Market Segmentation |
|
|
Regions Covered |
|
|
Countries Covered |
|
|
Companies Profiled |
|
|
Customization Scope |
Available upon request |
|
Pricing |
Available upon request |
The global Combined Heat and Power (CHP) installation market stood at US$ 942.4 Bn in 2021.
The Combined Heat and Power (CHP) installation market is expected to grow at a CAGR of 4.1% from 2022 to 2031.
Rise in demand for electricity and increase in demand for Combined Heat and Power (CHP) installation in developing countries.
The natural gas segment accounted for a 60% share of the Combined Heat and Power (CHP) installation market in 2021.
Asia Pacific is more attractive for vendors in the Combined Heat and Power (CHP) installation market.
Siemens Energy AG, 2G Energy Inc, Capstone Turbine Corporation, Aegis Energy Services, Inc., Cummins Inc., Wärtsilä, General Electric Company, Aegis Energy Services Inc, Generac Primary Energy Recycling Corporation, and Integral Power.
1. Executive Summary
2. Global Market Outlook
3. Demand Side Trends
4. Key Facts and Figures
5. Trends Impacting Market
6. TMR’s Growth Opportunity Wheel
7. Market Overview
7.1. Market Segmentation
7.2. Market Trends
7.3. Market Dynamics
7.3.1. Drivers
7.3.2. Restraints
7.3.3. Opportunities
7.4. Porter’s Five Forces Analysis
7.5. Regulatory Analysis
7.6. Value Chain Analysis
7.6.1. List of Key Manufacturers
7.6.2. List of Suppliers/Distributors
7.6.3. List of Potential Customers
8. COVID-19 Impact Analysis
8.1.1. Impact on the Supply Chain of Combined Heat and Power (CHP) Installation Market
8.1.2. Impact on the Demand of Combined Heat and Power (CHP) Installation Market – Pre & Post Crisis
9. Production Output Analysis, 2021
9.1.1. North America
9.1.2. Europe
9.1.3. Asia Pacific
9.1.4. Latin America
9.1.5. Middle East
10. Price Trend Analysis
10.1.1. Price Comparison Analysis, by Application
10.1.2. Price Comparison Analysis, by Region
11. Global Combined Heat and Power (CHP) Installation Market Analysis and Forecast, by Fuel, 2020–2031
11.1. Introduction and Definitions
11.2. Global Combined Heat and Power (CHP) Installation Market Volume (GW) and Value (US$ Bn) Forecast, by Fuel, 2020–2031
11.2.1. Biomass
11.2.2. Coal
11.2.3. Natural Gas
11.3. Global Combined Heat and Power (CHP) Installation Market Attractiveness, by Fuel
12. Global Combined Heat and Power (CHP) Installation Market Analysis and Forecast, by Prime Mover, 2020–2031
12.1. Introduction and Definitions
12.2. Global Combined Heat and Power (CHP) Installation Market Volume (GW) and Value (US$ Bn) Forecast, by Prime Mover, 2020–2031
12.2.1. Steam Turbine
12.2.2. Combined Cycle
12.2.3. Gas Turbine
12.2.4. Reciprocating Engine
12.2.5. Others (Stirling Engine and Organic Rankine Cycle)
13. Global Combined Heat and Power (CHP) Installation Market Attractiveness, by Prime Mover
14. Global Combined Heat and Power (CHP) Installation Market Analysis and Forecast, by Application, 2020–2031
14.1. Introduction and Definitions
14.2. Global Combined Heat and Power (CHP) Installation Market Volume (GW) and Value (US$ Bn) Forecast, by Application, 2020–2031
14.2.1. Commercial & Residential
14.2.2. Industrial
14.3. Global Combined Heat and Power (CHP) Installation Market Attractiveness, by Application
15. Global Combined Heat and Power (CHP) Installation Market Analysis and Forecast, by Region, 2020–2031
15.1. Key Findings
15.2. Global Combined Heat and Power (CHP) Installation Market Volume (GW) and Value (US$ Bn) Forecast, by Region, 2020–2031
15.2.1. North America
15.2.2. Europe
15.2.3. Asia Pacific
15.2.4. Middle East & Africa
15.2.5. Latin America
15.3. Global Combined Heat and Power (CHP) Installation Market Attractiveness, by Region
16. North America Combined Heat and Power (CHP) Installation Market Analysis and Forecast, 2020–2031
16.1. Key Findings
16.2. North America Combined Heat and Power (CHP) Installation Market Volume (GW) and Value (US$ Bn) Forecast, by Fuel, 2020–2031
16.3. North America Combined Heat and Power (CHP) Installation Market Volume (GW) and Value (US$ Bn) Forecast, by Prime Mover, 2020–2031
16.4. North America Combined Heat and Power (CHP) Installation Market Volume (GW) and Value (US$ Bn) Forecast, by Application, 2020–2031
16.5. North America Combined Heat and Power (CHP) Installation Market Volume (GW) and Value (US$ Bn) Forecast, by Country, 2020–2031
16.5.1. U.S. Combined Heat and Power (CHP) Installation Market Volume (GW) and Value (US$ Bn) Forecast, by Fuel, 2020–2031
16.5.2. U.S. Combined Heat and Power (CHP) Installation Market Volume (GW) and Value (US$ Bn) Forecast, by Prime Mover, 2020–2031
16.5.3. U.S. Combined Heat and Power (CHP) Installation Market Volume (GW) and Value (US$ Bn) Forecast, by Application, 2020–2031
16.5.4. Canada Combined Heat and Power (CHP) Installation Market Volume (GW) and Value (US$ Bn) Forecast, by Fuel, 2020–2031
16.5.5. Canada Combined Heat and Power (CHP) Installation Market Volume (GW) and Value (US$ Bn) Forecast, by Prime Mover, 2020–2031
16.5.6. Canada Combined Heat and Power (CHP) Installation Market Volume (GW) and Value (US$ Bn) Forecast, by Application, 2020–2031
16.6. North America Combined Heat and Power (CHP) Installation Market Attractiveness Analysis
17. Europe Combined Heat and Power (CHP) Installation Market Analysis and Forecast, 2020–2031
17.1. Key Findings
17.2. Europe Combined Heat and Power (CHP) Installation Market Volume (GW) and Value (US$ Bn) Forecast, by Fuel, 2020–2031
17.3. Europe Combined Heat and Power (CHP) Installation Market Volume (GW) and Value (US$ Bn) Forecast, by Prime Mover, 2020–2031
17.4. Europe Combined Heat and Power (CHP) Installation Market Volume (GW) and Value (US$ Bn) Forecast, by Application, 2020–2031
17.5. Europe Combined Heat and Power (CHP) Installation Market Volume (GW) and Value (US$ Bn) Forecast, by Country and Sub-region, 2020-2031
17.5.1. Germany Combined Heat and Power (CHP) Installation Market Volume (GW) and Value (US$ Bn) Forecast, by Fuel, 2020–2031
17.5.2. Germany Combined Heat and Power (CHP) Installation Market Volume (GW) and Value (US$ Bn) Forecast, by Prime Mover, 2020–2031
17.5.3. Germany Combined Heat and Power (CHP) Installation Market Volume (GW) and Value (US$ Bn) Forecast, by Application, 2020–2031
17.5.4. France Combined Heat and Power (CHP) Installation Market Volume (GW) and Value (US$ Bn) Forecast, by Fuel, 2020–2031
17.5.5. France Combined Heat and Power (CHP) Installation Market Volume (GW) and Value (US$ Bn) Forecast, by Prime Mover, 2020–2031
17.5.6. France Combined Heat and Power (CHP) Installation Market Volume (GW) and Value (US$ Bn) Forecast, by Application, 2020–2031
17.5.7. U.K. Combined Heat and Power (CHP) Installation Market Volume (GW) and Value (US$ Bn) Forecast, by Fuel, 2020–2031
17.5.8. U.K. Combined Heat and Power (CHP) Installation Market Volume (GW) and Value (US$ Bn) Forecast, by Prime Mover, 2020–2031
17.5.9. U.K. Combined Heat and Power (CHP) Installation Market Volume (GW) and Value (US$ Bn) Forecast, by Application, 2020–2031
17.5.10. Spain Combined Heat and Power (CHP) Installation Market Volume (GW) and Value (US$ Bn) Forecast, by Fuel, 2020–2031
17.5.11. Spain Combined Heat and Power (CHP) Installation Market Volume (GW) and Value (US$ Bn) Forecast, by Prime Mover, 2020–2031
17.5.12. Spain Combined Heat and Power (CHP) Installation Market Volume (GW) and Value (US$ Bn) Forecast, by Application, 2020–2031
17.5.13. Italy Combined Heat and Power (CHP) Installation Market Volume (GW) and Value (US$ Bn) Forecast, by Fuel, 2020–2031
17.5.14. Italy. Combined Heat and Power (CHP) Installation Market Volume (GW) and Value (US$ Bn) Forecast, by Prime Mover, 2020–2031
17.5.15. Italy Combined Heat and Power (CHP) Installation Market Volume (GW) and Value (US$ Bn) Forecast, by Application, 2020–2031
17.5.16. Russia & CIS Combined Heat and Power (CHP) Installation Market Volume (GW) and Value (US$ Bn) Forecast, by Fuel, 2020–2031
17.5.17. Russia & CIS Combined Heat and Power (CHP) Installation Market Volume (GW) and Value (US$ Bn) Forecast, by Prime Mover, 2020–2031
17.5.18. Russia & CIS Combined Heat and Power (CHP) Installation Market Volume (GW) and Value (US$ Bn) Forecast, by Application, 2020–2031
17.5.19. Rest of Europe Combined Heat and Power (CHP) Installation Market Volume (GW) and Value (US$ Bn) Forecast, by Fuel, 2020–2031
17.5.20. Rest of Europe Combined Heat and Power (CHP) Installation Market Volume (GW) and Value (US$ Bn) Forecast, by Prime Mover, 2020–2031
17.5.21. Rest of Europe Combined Heat and Power (CHP) Installation Market Volume (GW) and Value (US$ Bn) Forecast, by Application, 2020–2031
17.6. Europe Combined Heat and Power (CHP) Installation Market Attractiveness Analysis
18. Asia Pacific Combined Heat and Power (CHP) Installation Market Analysis and Forecast, 2020–2031
18.1. Key Findings
18.2. Asia Pacific Combined Heat and Power (CHP) Installation Market Volume (GW) and Value (US$ Bn) Forecast, by Fuel
18.3. Asia Pacific Combined Heat and Power (CHP) Installation Market Volume (GW) and Value (US$ Bn) Forecast, by Prime Mover, 2020–2031
18.4. Asia Pacific Combined Heat and Power (CHP) Installation Market Volume (GW) and Value (US$ Bn) Forecast, by Application, 2020–2031
18.5. Asia Pacific Combined Heat and Power (CHP) Installation Market Volume (GW) and Value (US$ Bn) Forecast, by Country and Sub-region, 2020-2031
18.5.1. China Combined Heat and Power (CHP) Installation Market Volume (GW) and Value (US$ Bn) Forecast, by Fuel, 2020–2031
18.5.2. China Combined Heat and Power (CHP) Installation Market Volume (GW) and Value (US$ Bn) Forecast, by Prime Mover, 2020–2031
18.5.3. China Combined Heat and Power (CHP) Installation Market Volume (GW) and Value (US$ Bn) Forecast, by Application, 2020–2031
18.5.4. Japan Combined Heat and Power (CHP) Installation Market Volume (GW) and Value (US$ Bn) Forecast, by Fuel, 2020–2031
18.5.5. Japan Combined Heat and Power (CHP) Installation Market Volume (GW) and Value (US$ Bn) Forecast, by Prime Mover, 2020–2031
18.5.6. Japan Combined Heat and Power (CHP) Installation Market Volume (GW) and Value (US$ Bn) Forecast, by Application, 2020–2031
18.5.7. India Combined Heat and Power (CHP) Installation Market Volume (GW) and Value (US$ Bn) Forecast, by Fuel, 2020–2031
18.5.8. India Combined Heat and Power (CHP) Installation Market Volume (GW) and Value (US$ Bn) Forecast, by Prime Mover, 2020–2031
18.5.9. India Combined Heat and Power (CHP) Installation Market Volume (GW) and Value (US$ Bn) Forecast, by Application, 2020–2031
18.5.10. ASEAN Combined Heat and Power (CHP) Installation Market Volume (GW) and Value (US$ Bn) Forecast, by Fuel, 2020–2031
18.5.11. ASEAN Combined Heat and Power (CHP) Installation Market Volume (GW) and Value (US$ Bn) Forecast, by Prime Mover, 2020–2031
18.5.12. ASEAN Combined Heat and Power (CHP) Installation Market Volume (GW) and Value (US$ Bn) Forecast, by Application, 2020–2031
18.5.13. Rest of Asia Pacific Combined Heat and Power (CHP) Installation Market Volume (GW) and Value (US$ Bn) Forecast, by Fuel, 2020–2031
18.5.14. Rest of Asia Pacific Combined Heat and Power (CHP) Installation Market Volume (GW) and Value (US$ Bn) Forecast, by Prime Mover, 2020–2031
18.5.15. Rest of Asia Pacific Combined Heat and Power (CHP) Installation Market Volume (GW) and Value (US$ Bn) Forecast, by Application, 2020–2031
18.6. Asia Pacific Combined Heat and Power (CHP) Installation Market Attractiveness Analysis
19. Latin America Combined Heat and Power (CHP) Installation Market Analysis and Forecast, 2020–2031
19.1. Key Findings
19.2. Latin America Combined Heat and Power (CHP) Installation Market Volume (GW) and Value (US$ Bn) Forecast, by Fuel, 2020–2031
19.3. Latin America Combined Heat and Power (CHP) Installation Market Volume (GW) and Value (US$ Bn) Forecast, by Prime Mover, 2020–2031
19.4. Latin America Combined Heat and Power (CHP) Installation Market Volume (GW) and Value (US$ Bn) Forecast, by Application, 2020–2031
19.5. Latin America Combined Heat and Power (CHP) Installation Market Volume (GW) and Value (US$ Bn) Forecast, by Country and Sub-region, 2020-2031
19.5.1. Brazil Combined Heat and Power (CHP) Installation Market Volume (GW) and Value (US$ Bn) Forecast, by Fuel, 2020–2031
19.5.2. Brazil Combined Heat and Power (CHP) Installation Market Volume (GW) and Value (US$ Bn) Forecast, by Prime Mover, 2020–2031
19.5.3. Brazil Combined Heat and Power (CHP) Installation Market Volume (GW) and Value (US$ Bn) Forecast, by Application, 2020–2031
19.5.4. Mexico Combined Heat and Power (CHP) Installation Market Volume (GW) and Value (US$ Bn) Forecast, by Fuel, 2020–2031
19.5.5. Mexico Combined Heat and Power (CHP) Installation Market Volume (GW) and Value (US$ Bn) Forecast, by Prime Mover, 2020–2031
19.5.6. Mexico Combined Heat and Power (CHP) Installation Market Volume (GW) and Value (US$ Bn) Forecast, by Application, 2020–2031
19.5.7. Rest of Latin America Combined Heat and Power (CHP) Installation Market Volume (GW) and Value (US$ Bn) Forecast, by Fuel, 2020–2031
19.5.8. Rest of Latin America Combined Heat and Power (CHP) Installation Market Volume (GW) and Value (US$ Bn) Forecast, by Prime Mover, 2020–2031
19.5.9. Rest of Latin America Combined Heat and Power (CHP) Installation Market Volume (GW) and Value (US$ Bn) Forecast, by Application, 2020–2031
19.6. Latin America Combined Heat and Power (CHP) Installation Market Attractiveness Analysis
20. Middle East & Africa Combined Heat and Power (CHP) Installation Market Analysis and Forecast, 2020–2031
20.1. Key Findings
20.2. Middle East & Africa Combined Heat and Power (CHP) Installation Market Volume (GW) and Value (US$ Bn) Forecast, by Fuel, 2020–2031
20.3. Middle East & Africa Combined Heat and Power (CHP) Installation Market Volume (GW) and Value (US$ Bn) Forecast, by Prime Mover, 2020–2031
20.4. Middle East & Africa Combined Heat and Power (CHP) Installation Market Volume (GW) and Value (US$ Bn) Forecast, by Application, 2020–2031
20.5. Middle East & Africa Combined Heat and Power (CHP) Installation Market Volume (GW) and Value (US$ Bn) Forecast, by Country and Sub-region, 2020-2031
20.5.1. GCC Combined Heat and Power (CHP) Installation Market Volume (GW) and Value (US$ Bn) Forecast, by Fuel, 2020–2031
20.5.2. GCC Combined Heat and Power (CHP) Installation Market Volume (GW) and Value (US$ Bn) Forecast, by Prime Mover, 2020–2031
20.5.3. GCC Combined Heat and Power (CHP) Installation Market Volume (GW) and Value (US$ Bn) Forecast, by Application, 2020–2031
20.5.4. South Africa Combined Heat and Power (CHP) Installation Market Volume (GW) and Value (US$ Bn) Forecast, by Fuel, 2020–2031
20.5.5. South Africa Combined Heat and Power (CHP) Installation Market Volume (GW) and Value (US$ Bn) Forecast, by Prime Mover, 2020–2031
20.5.6. South Africa Combined Heat and Power (CHP) Installation Market Volume (GW) and Value (US$ Bn) Forecast, by Application, 2020–2031
20.5.7. Rest of Middle East & Africa Combined Heat and Power (CHP) Installation Market Volume (GW) and Value (US$ Bn) Forecast, by Fuel, 2020–2031
20.5.8. Rest of Middle East & Africa Combined Heat and Power (CHP) Installation Market Volume (GW) and Value (US$ Bn) Forecast, by Prime Mover, 2020–2031
20.5.9. Rest of Middle East & Africa Combined Heat and Power (CHP) Installation Market Volume (GW) and Value (US$ Bn) Forecast, by Application, 2020–2031
20.6. Middle East & Africa Combined Heat and Power (CHP) Installation Market Attractiveness Analysis
21. Competition Landscape
21.1. Global Combined Heat and Power (CHP) Installation Company Market Share Analysis, 2020
21.2. Company Profiles (Details – Overview, Financials, Recent Developments, and Strategy)
21.2.1. Siemens Energy AG
21.2.1.1. Company Description
21.2.1.2. Business Overview
21.2.1.3. Financial Overview
21.2.1.4. Strategic Overview
21.2.2. 2G Energy Inc.
21.2.2.1. Company Description
21.2.2.2. Business Overview
21.2.2.3. Financial Overview
21.2.2.4. Strategic Overview
21.2.3. Capstone Turbine Corporation
21.2.3.1. Company Description
21.2.3.2. Business Overview
21.2.3.3. Financial Overview
21.2.3.4. Strategic Overview
21.2.4. Aegis Energy Services, Inc.
21.2.4.1. Company Description
21.2.4.2. Business Overview
21.2.4.3. Financial Overview
21.2.4.4. Strategic Overview
21.2.5. Cummins Inc.,
21.2.5.1. Company Description
21.2.5.2. Business Overview
21.2.5.3. Financial Overview
21.2.5.4. Strategic Overview
21.2.6. Wärtsilä
21.2.6.1. Company Description
21.2.6.2. Business Overview
21.2.6.3. Financial Overview
21.2.6.4. Strategic Overview
21.2.7. General Electric Company
21.2.7.1. Company Description
21.2.7.2. Business Overview
21.2.7.3. Financial Overview
21.2.7.4. Strategic Overview
21.2.8. Aegis Energy Services Inc.,
21.2.8.1. Company Description
21.2.8.2. Business Overview
21.2.8.3. Financial Overview
21.2.8.4. Strategic Overview
21.2.9. Generac Holdings Inc.
21.2.9.1. Company Description
21.2.9.2. Business Overview
21.2.9.3. Financial Overview
21.2.9.4. Strategic Overview
21.2.10. Primary Energy Recycling Corporation
21.2.10.1. Company Description
21.2.10.2. Business Overview
21.2.10.3. Financial Overview
21.2.10.4. Strategic Overview
21.2.11. Integral Power
21.2.11.1. Company Description
21.2.11.2. Business Overview
21.2.11.3. Financial Overview
21.2.11.4. Strategic Overview
22. Primary Research: Key Insights
23. Appendix
List of Tables
Table 1: Global Combined Heat and Power (CHP) Installation Market Volume (GW) Forecast, by Fuel, 2020–2031
Table 2: Global Combined Heat and Power (CHP) Installation Market Value (US$ Bn) Forecast, by Fuel, 2020–2031
Table 3: Global Combined Heat and Power (CHP) Installation Market Volume (GW) Forecast, by Prime Mover, 2020–2031
Table 4: Global Combined Heat and Power (CHP) Installation Market Value (US$ Bn) Forecast, by Prime Mover, 2020–2031
Table 5: Global Combined Heat and Power (CHP) Installation Market Volume (GW) Forecast, by Application, 2020–2031
Table 6: Global Combined Heat and Power (CHP) Installation Market Value (US$ Bn) Forecast, by Application, 2020–2031
Table 7: Global Combined Heat and Power (CHP) Installation Market Volume (GW) Forecast, by Region, 2020–2031
Table 8: Global Combined Heat and Power (CHP) Installation Market Value (US$ Bn) Forecast, by Region, 2020–2031
Table 9: North America Combined Heat and Power (CHP) Installation Market Volume (GW) Forecast, by Fuel, 2020–2031
Table 10: North America Combined Heat and Power (CHP) Installation Market Value (US$ Bn) Forecast, by Fuel, 2020–2031
Table 11: North America Combined Heat and Power (CHP) Installation Market Volume (GW) Forecast, by Prime Mover, 2020–2031
Table 12: North America Combined Heat and Power (CHP) Installation Market Value (US$ Bn) Forecast, by Prime Mover, 2020–2031
Table 13: North America Combined Heat and Power (CHP) Installation Market Volume (GW) Forecast, by Application, 2020–2031
Table 14: North America Combined Heat and Power (CHP) Installation Market Value (US$ Bn) Forecast, by Application, 2020–2031
Table 15: North America Combined Heat and Power (CHP) Installation Market Volume (GW) Forecast, by Country, 2020–2031
Table 16: North America Combined Heat and Power (CHP) Installation Market Value (US$ Bn) Forecast, by Country, 2020–2031
Table 17: U.S. Combined Heat and Power (CHP) Installation Market Volume (GW) Forecast, by Fuel, 2020–2031
Table 18: U.S. Combined Heat and Power (CHP) Installation Market Value (US$ Bn) Forecast, by Fuel, 2020–2031
Table 19: U.S. Combined Heat and Power (CHP) Installation Market Volume (GW) Forecast, by Prime Mover, 2020–2031
Table 20: U.S. Combined Heat and Power (CHP) Installation Market Value (US$ Bn) Forecast, by Prime Mover, 2020–2031
Table 21: U.S. Combined Heat and Power (CHP) Installation Market Volume (GW) Forecast, by Application, 2020–2031
Table 22: U.S. Combined Heat and Power (CHP) Installation Market Value (US$ Bn) Forecast, by Application, 2020–2031
Table 23: Canada Combined Heat and Power (CHP) Installation Market Volume (GW) Forecast, by Fuel, 2020–2031
Table 24: Canada Combined Heat and Power (CHP) Installation Market Value (US$ Bn) Forecast, by Fuel, 2020–2031
Table 25: Canada Combined Heat and Power (CHP) Installation Market Volume (GW) Forecast, by Prime Mover, 2020–2031
Table 26: Canada Combined Heat and Power (CHP) Installation Market Value (US$ Bn) Forecast, by Prime Mover, 2020–2031
Table 27: Canada Combined Heat and Power (CHP) Installation Market Volume (GW) Forecast, by Application, 2020–2031
Table 28: Canada Combined Heat and Power (CHP) Installation Market Value (US$ Bn) Forecast, by Application, 2020–2031
Table 29: Europe Combined Heat and Power (CHP) Installation Market Volume (GW) Forecast, by Fuel, 2020–2031
Table 30: Europe Combined Heat and Power (CHP) Installation Market Value (US$ Bn) Forecast, by Fuel, 2020–2031
Table 31: Europe Combined Heat and Power (CHP) Installation Market Volume (GW) Forecast, by Prime Mover, 2020–2031
Table 32: Europe Combined Heat and Power (CHP) Installation Market Value (US$ Bn) Forecast, by Prime Mover, 2020–2031
Table 33: Europe Combined Heat and Power (CHP) Installation Market Volume (GW) Forecast, by Application, 2020–2031
Table 34: Europe Combined Heat and Power (CHP) Installation Market Value (US$ Bn) Forecast, by Application, 2020–2031
Table 35: Europe Combined Heat and Power (CHP) Installation Market Volume (GW) Forecast, by Country and Sub-region, 2020–2031
Table 36: Europe Combined Heat and Power (CHP) Installation Market Value (US$ Bn) Forecast, by Country and Sub-region, 2020–2031
Table 37: Germany Combined Heat and Power (CHP) Installation Market Volume (GW) Forecast, by Fuel, 2020–2031
Table 38: Germany Combined Heat and Power (CHP) Installation Market Value (US$ Bn) Forecast, by Fuel, 2020–2031
Table 39: Germany Combined Heat and Power (CHP) Installation Market Volume (GW) Forecast, by Prime Mover, 2020–2031
Table 40: Germany Combined Heat and Power (CHP) Installation Market Value (US$ Bn) Forecast, by Prime Mover, 2020–2031
Table 41: Germany Combined Heat and Power (CHP) Installation Market Volume (GW) Forecast, by Application, 2020–2031
Table 42: Germany Combined Heat and Power (CHP) Installation Market Value (US$ Bn) Forecast, by Application, 2020–2031
Table 43: France Combined Heat and Power (CHP) Installation Market Volume (GW) Forecast, by Fuel, 2020–2031
Table 44: France Combined Heat and Power (CHP) Installation Market Value (US$ Bn) Forecast, by Fuel, 2020–2031
Table 45: France Combined Heat and Power (CHP) Installation Market Volume (GW) Forecast, by Prime Mover, 2020–2031
Table 46: France Combined Heat and Power (CHP) Installation Market Value (US$ Bn) Forecast, by Prime Mover, 2020–2031
Table 47: France Combined Heat and Power (CHP) Installation Market Volume (GW) Forecast, by Application, 2020–2031
Table 48: France Combined Heat and Power (CHP) Installation Market Value (US$ Bn) Forecast, by Application, 2020–2031
Table 49: U.K. Combined Heat and Power (CHP) Installation Market Volume (GW) Forecast, by Fuel, 2020–2031
Table 50: U.K. Combined Heat and Power (CHP) Installation Market Value (US$ Bn) Forecast, by Fuel, 2020–2031
Table 51: U.K. Combined Heat and Power (CHP) Installation Market Volume (GW) Forecast, by Prime Mover, 2020–2031
Table 52: U.K. Combined Heat and Power (CHP) Installation Market Value (US$ Bn) Forecast, by Prime Mover, 2020–2031
Table 53: U.K. Combined Heat and Power (CHP) Installation Market Volume (GW) Forecast, by Application, 2020–2031
Table 54: Spain Combined Heat and Power (CHP) Installation Market Volume (GW) Forecast, by Fuel, 2020–2031
Table 55: Spain Combined Heat and Power (CHP) Installation Market Value (US$ Bn) Forecast, by Fuel, 2020–2031
Table 56: Spain Combined Heat and Power (CHP) Installation Market Volume (GW) Forecast, by Prime Mover, 2020–2031
Table 57: Spain Combined Heat and Power (CHP) Installation Market Value (US$ Bn) Forecast, by Prime Mover, 2020–2031
Table 58: Spain Combined Heat and Power (CHP) Installation Market Volume (GW) Forecast, by Application, 2020–2031
Table 59: Spain Combined Heat and Power (CHP) Installation Market Value (US$ Bn) Forecast, by Application, 2020–2031
Table 60: Italy Combined Heat and Power (CHP) Installation Market Value (US$ Bn) Forecast, by Application, 2020–2031
Table 61: Spain Combined Heat and Power (CHP) Installation Market Volume (GW) Forecast, by Fuel, 2020–2031
Table 62: Spain Combined Heat and Power (CHP) Installation Market Value (US$ Bn) Forecast, by Fuel, 2020–2031
Table 63: Spain Combined Heat and Power (CHP) Installation Market Volume (GW) Forecast, by Prime Mover, 2020–2031
Table 64: Spain Combined Heat and Power (CHP) Installation Market Value (US$ Bn) Forecast, by Prime Mover, 2020–2031
Table 65: Spain Combined Heat and Power (CHP) Installation Market Volume (GW) Forecast, by Application, 2020–2031
Table 66: Spain Combined Heat and Power (CHP) Installation Market Value (US$ Bn) Forecast, by Application, 2020–2031
Table 67: Russia & CIS Combined Heat and Power (CHP) Installation Market Volume (GW) Forecast, by Fuel, 2020–2031
Table 68: Russia & CIS Combined Heat and Power (CHP) Installation Market Value (US$ Bn) Forecast, by Fuel, 2020–2031
Table 69: Russia & CIS Combined Heat and Power (CHP) Installation Market Volume (GW) Forecast, by Prime Mover, 2020–2031
Table 70: Russia & CIS Combined Heat and Power (CHP) Installation Market Value (US$ Bn) Forecast, by Prime Mover, 2020–2031
Table 71: Russia & CIS Combined Heat and Power (CHP) Installation Market Volume (GW) Forecast, by Application, 2020–2031
Table 72: Russia & CIS Combined Heat and Power (CHP) Installation Market Value (US$ Bn) Forecast, by Application, 2020–2031
Table 73: Rest of Europe Combined Heat and Power (CHP) Installation Market Volume (GW) Forecast, by Fuel, 2020–2031
Table 74: Rest of Europe Combined Heat and Power (CHP) Installation Market Value (US$ Bn) Forecast, by Fuel, 2020–2031
Table 75: Rest of Europe Combined Heat and Power (CHP) Installation Market Volume (GW) Forecast, by Prime Mover, 2020–2031
Table 76: Rest of Europe Combined Heat and Power (CHP) Installation Market Value (US$ Bn) Forecast, by Prime Mover, 2020–2031
Table 77: Rest of Europe Combined Heat and Power (CHP) Installation Market Volume (GW) Forecast, by Application, 2020–2031
Table 78: Rest of Europe Combined Heat and Power (CHP) Installation Market Value (US$ Bn) Forecast, by Application, 2020–2031
Table 79: Asia Pacific Combined Heat and Power (CHP) Installation Market Volume (GW) Forecast, by Fuel, 2020–2031
Table 80: Asia Pacific Combined Heat and Power (CHP) Installation Market Value (US$ Bn) Forecast, by Fuel, 2020–2031
Table 81: Asia Pacific Combined Heat and Power (CHP) Installation Market Volume (GW) Forecast, by Prime Mover, 2020–2031
Table 82: Asia Pacific Combined Heat and Power (CHP) Installation Market Value (US$ Bn) Forecast, by Prime Mover, 2020–2031
Table 83: Asia Pacific Combined Heat and Power (CHP) Installation Market Volume (GW) Forecast, by Application, 2020–2031
Table 84: Asia Pacific Combined Heat and Power (CHP) Installation Market Value (US$ Bn) Forecast, by Application, 2020–2031
Table 85: Asia Pacific Combined Heat and Power (CHP) Installation Market Volume (GW) Forecast, by Country and Sub-region, 2020–2031
Table 86: Asia Pacific Combined Heat and Power (CHP) Installation Market Value (US$ Bn) Forecast, by Country and Sub-region, 2020–2031
Table 87: China Combined Heat and Power (CHP) Installation Market Volume (GW) Forecast, by Fuel, 2020–2031
Table 88: China Combined Heat and Power (CHP) Installation Market Value (US$ Bn) Forecast, by Fuel 2020–2031
Table 89: China Combined Heat and Power (CHP) Installation Market Volume (GW) Forecast, by Prime Mover, 2020–2031
Table 90: China Combined Heat and Power (CHP) Installation Market Value (US$ Bn) Forecast, by Prime Mover, 2020–2031
Table 91: China Combined Heat and Power (CHP) Installation Market Volume (GW) Forecast, by Application, 2020–2031
Table 92: China Combined Heat and Power (CHP) Installation Market Value (US$ Bn) Forecast, by Application, 2020–2031
Table 93: Japan Combined Heat and Power (CHP) Installation Market Volume (GW) Forecast, by Fuel, 2020–2031
Table 94: Japan Combined Heat and Power (CHP) Installation Market Value (US$ Bn) Forecast, by Fuel, 2020–2031
Table 95: Japan Combined Heat and Power (CHP) Installation Market Volume (GW) Forecast, by Prime Mover, 2020–2031
Table 96: Japan Combined Heat and Power (CHP) Installation Market Value (US$ Bn) Forecast, by Prime Mover, 2020–2031
Table 97: Japan Combined Heat and Power (CHP) Installation Market Volume (GW) Forecast, by Application, 2020–2031
Table 98: Japan Combined Heat and Power (CHP) Installation Market Value (US$ Bn) Forecast, by Application, 2020–2031
Table 99: India Combined Heat and Power (CHP) Installation Market Volume (GW) Forecast, by Fuel, 2020–2031
Table 100: India Combined Heat and Power (CHP) Installation Market Value (US$ Bn) Forecast, by Fuel, 2020–2031
Table 101: India Combined Heat and Power (CHP) Installation Market Volume (GW) Forecast, by Prime Mover, 2020–2031
Table 102: India Combined Heat and Power (CHP) Installation Market Value (US$ Bn) Forecast, by Prime Mover, 2020–2031
Table 103: India Combined Heat and Power (CHP) Installation Market Volume (GW) Forecast, by Application, 2020–2031
Table 104: India Combined Heat and Power (CHP) Installation Market Value (US$ Bn) Forecast, by Application, 2020–2031
Table 105: India Combined Heat and Power (CHP) Installation Market Volume (GW) Forecast, by Application, 2020–2031
Table 106: India Combined Heat and Power (CHP) Installation Market Value (US$ Bn) Forecast, by Application 2020–2031
Table 107: ASEAN Combined Heat and Power (CHP) Installation Market Volume (GW) Forecast, by Fuel, 2020–2031
Table 108: ASEAN Combined Heat and Power (CHP) Installation Market Value (US$ Bn) Forecast, by Fuel, 2020–2031
Table 109: ASEAN Combined Heat and Power (CHP) Installation Market Volume (GW) Forecast, by Prime Mover, 2020–2031
Table 110: ASEAN Combined Heat and Power (CHP) Installation Market Value (US$ Bn) Forecast, by Prime Mover, 2020–2031
Table 111: ASEAN Combined Heat and Power (CHP) Installation Market Volume (GW) Forecast, by Application, 2020–2031
Table 112: ASEAN Combined Heat and Power (CHP) Installation Market Value (US$ Bn) Forecast, by Application, 2020–2031
Table 113: Rest of Asia Pacific Combined Heat and Power (CHP) Installation Market Volume (GW) Forecast, by Fuel, 2020–2031
Table 114: Rest of Asia Pacific Combined Heat and Power (CHP) Installation Market Value (US$ Bn) Forecast, by Fuel, 2020–2031
Table 115: Rest of Asia Pacific Combined Heat and Power (CHP) Installation Market Volume (GW) Forecast, by Prime Mover, 2020–2031
Table 116: Rest of Asia Pacific Combined Heat and Power (CHP) Installation Market Value (US$ Bn) Forecast, by Prime Mover, 2020–2031
Table 117: Rest of Asia Pacific Combined Heat and Power (CHP) Installation Market Volume (GW) Forecast, by Application, 2020–2031
Table 118: Rest of Asia Pacific Combined Heat and Power (CHP) Installation Market Value (US$ Bn) Forecast, by Application, 2020–2031
Table 119: Latin America Combined Heat and Power (CHP) Installation Market Volume (GW) Forecast, by Fuel, 2020–2031
Table 120: Latin America Combined Heat and Power (CHP) Installation Market Value (US$ Bn) Forecast, by Fuel, 2020–2031
Table 121: Latin America Combined Heat and Power (CHP) Installation Market Volume (GW) Forecast, by Prime Mover, 2020–2031
Table 122: Latin America Combined Heat and Power (CHP) Installation Market Value (US$ Bn) Forecast, by Prime Mover, 2020–2031
Table 123: Latin America Combined Heat and Power (CHP) Installation Market Volume (GW) Forecast, by Application, 2020–2031
Table 124: Latin America Combined Heat and Power (CHP) Installation Market Value (US$ Bn) Forecast, by Application, 2020–2031
Table 125: Latin America Combined Heat and Power (CHP) Installation Market Volume (GW) Forecast, by Country and Sub-region, 2020–2031
Table 126: Latin America Combined Heat and Power (CHP) Installation Market Value (US$ Bn) Forecast, by Country and Sub-region, 2020–2031
Table 127: Brazil Combined Heat and Power (CHP) Installation Market Volume (GW) Forecast, by Fuel, 2020–2031
Table 128: Brazil Combined Heat and Power (CHP) Installation Market Value (US$ Bn) Forecast, by Fuel, 2020–2031
Table 129: Brazil Combined Heat and Power (CHP) Installation Market Volume (GW) Forecast, by Prime Mover, 2020–2031
Table 130: Brazil Combined Heat and Power (CHP) Installation Market Value (US$ Bn) Forecast, by Prime Mover, 2020–2031
Table 131: Brazil Combined Heat and Power (CHP) Installation Market Volume (GW) Forecast, by Application, 2020–2031
Table 132: Brazil Combined Heat and Power (CHP) Installation Market Value (US$ Bn) Forecast, by Application, 2020–2031
Table 133: Mexico Combined Heat and Power (CHP) Installation Market Volume (GW) Forecast, by Fuel, 2020–2031
Table 134: Mexico Combined Heat and Power (CHP) Installation Market Value (US$ Bn) Forecast, by Fuel, 2020–2031
Table 135: Mexico Combined Heat and Power (CHP) Installation Market Volume (GW) Forecast, by Prime Mover, 2020–2031
Table 136: Mexico Combined Heat and Power (CHP) Installation Market Value (US$ Bn) Forecast, by Prime Mover, 2020–2031
Table 137: Mexico Combined Heat and Power (CHP) Installation Market Volume (GW) Forecast, by Application, 2020–2031
Table 138: Mexico Combined Heat and Power (CHP) Installation Market Value (US$ Bn) Forecast, by Application, 2020–2031
Table 139: Rest of Latin America Combined Heat and Power (CHP) Installation Market Volume (GW) Forecast, by Fuel, 2020–2031
Table 140: Rest of Latin America Combined Heat and Power (CHP) Installation Market Value (US$ Bn) Forecast, by Fuel, 2020–2031
Table 141: Rest of Latin America Combined Heat and Power (CHP) Installation Market Volume (GW) Forecast, by Prime Mover, 2020–2031
Table 142: Rest of Latin America Combined Heat and Power (CHP) Installation Market Value (US$ Bn) Forecast, by Prime Mover, 2020–2031
Table 143: Rest of Latin America Combined Heat and Power (CHP) Installation Market Volume (GW) Forecast, by Application, 2020–2031
Table 144: Rest of Latin America Combined Heat and Power (CHP) Installation Market Value (US$ Bn) Forecast, by Application, 2020–2031
Table 145: Middle East & Africa Combined Heat and Power (CHP) Installation Market Volume (GW) Forecast, by Fuel, 2020–2031
Table 146: Middle East & Africa Combined Heat and Power (CHP) Installation Market Value (US$ Bn) Forecast, by Fuel, 2020–2031
Table 147: Middle East & Africa Combined Heat and Power (CHP) Installation Market Volume (GW) Forecast, by Prime Mover, 2020–2031
Table 148: Middle East & Africa Combined Heat and Power (CHP) Installation Market Value (US$ Bn) Forecast, by Prime Mover, 2020–2031
Table 149: Middle East & Africa Combined Heat and Power (CHP) Installation Market Volume (GW) Forecast, by Application, 2020–2031
Table 150: Middle East & Africa Combined Heat and Power (CHP) Installation Market Value (US$ Bn) Forecast, by Application, 2020–2031
Table 151: Middle East & Africa Combined Heat and Power (CHP) Installation Market Volume (GW) Forecast, by Country and Sub-region, 2020–2031
Table 152: Middle East & Africa Combined Heat and Power (CHP) Installation Market Value (US$ Bn) Forecast, by Country and Sub-region, 2020–2031
Table 153: GCC Combined Heat and Power (CHP) Installation Market Volume (GW) Forecast, by Fuel, 2020–2031
Table 154: GCC Combined Heat and Power (CHP) Installation Market Value (US$ Bn) Forecast, by Fuel, 2020–2031
Table 155: GCC Combined Heat and Power (CHP) Installation Market Volume (GW) Forecast, by Prime Mover, 2020–2031
Table 156: GCC Combined Heat and Power (CHP) Installation Market Value (US$ Bn) Forecast, by Prime Mover, 2020–2031
Table 157: GCC Combined Heat and Power (CHP) Installation Market Volume (GW) Forecast, by Application, 2020–2031
Table 158: GCC Combined Heat and Power (CHP) Installation Market Value (US$ Bn) Forecast, by Application, 2020–2031
Table 159: South Africa Combined Heat and Power (CHP) Installation Market Volume (GW) Forecast, by Fuel, 2020–2031
Table 160: South Africa Combined Heat and Power (CHP) Installation Market Value (US$ Bn) Forecast, by Fuel, 2020–2031
Table 161: South Africa Combined Heat and Power (CHP) Installation Market Volume (GW) Forecast, by Prime Mover, 2020–2031
Table 162: South Africa Combined Heat and Power (CHP) Installation Market Value (US$ Bn) Forecast, by Prime Mover, 2020–2031
Table 163: South Africa Combined Heat and Power (CHP) Installation Market Volume (GW) Forecast, by Application, 2020–2031
Table 164: South Africa Combined Heat and Power (CHP) Installation Market Value (US$ Bn) Forecast, by Application, 2020–2031
Table 165: Rest of Middle East & Africa Combined Heat and Power (CHP) Installation Market Volume (GW) Forecast, by Fuel, 2020–2031
Table 166: Rest of Middle East & Africa Combined Heat and Power (CHP) Installation Market Value (US$ Bn) Forecast, by Fuel, 2020–2031
Table 167: Rest of Middle East & Africa Combined Heat and Power (CHP) Installation Market Volume (GW) Forecast, by Prime Mover, 2020–2031
Table 168: Rest of Middle East & Africa Combined Heat and Power (CHP) Installation Market Value (US$ Bn) Forecast, by Prime Mover, 2020–2031
Table 169: Rest of Middle East & Africa Combined Heat and Power (CHP) Installation Market Volume (GW) Forecast, by Application, 2020–2031
Table 170: Rest of Middle East & Africa Combined Heat and Power (CHP) Installation Market Value (US$ Bn) Forecast, by Application, 2020–2031
List of Figures
Figure 1: Global Combined Heat and Power (CHP) Installation Market Volume Share Analysis, by Fuel, 2020, 2025, and 2031
Figure 2: Global Combined Heat and Power (CHP) Installation Market Attractiveness, by Fuel
Figure 3: Global Combined Heat and Power (CHP) Installation Market Volume Share Analysis, by Prime Mover, 2020, 2025, and 2031
Figure 4: Global Combined Heat and Power (CHP) Installation Market Attractiveness, by Prime Mover
Figure 5: Global Combined Heat and Power (CHP) Installation Market Volume Share Analysis, by Application, 2020, 2025, and 2031
Figure 6: Global Combined Heat and Power (CHP) Installation Market Attractiveness, by Application
Figure 7: Global Combined Heat and Power (CHP) Installation Market Volume Share Analysis, by Region, 2020, 2025, and 2031
Figure 8: Global Combined Heat and Power (CHP) Installation Market Attractiveness, by Region
Figure 9: North America Combined Heat and Power (CHP) Installation Market Volume Share Analysis, by Fuel, 2020, 2025, and 2031
Figure 10: North America Combined Heat and Power (CHP) Installation Market Attractiveness, by Fuel
Figure 11: North America Combined Heat and Power (CHP) Installation Market Attractiveness, by Fuel
Figure 12: North America Combined Heat and Power (CHP) Installation Market Volume Share Analysis, by Prime Mover, 2020, 2025, and 2031
Figure 13: North America Combined Heat and Power (CHP) Installation Market Attractiveness, by Prime Mover
Figure 14: North America Combined Heat and Power (CHP) Installation Market Volume Share Analysis, by Application, 2020, 2025, and 2031
Figure 15: North America Combined Heat and Power (CHP) Installation Market Attractiveness, by Application
Figure 16: North America Combined Heat and Power (CHP) Installation Market Attractiveness, by Country
Figure 17: Europe Combined Heat and Power (CHP) Installation Market Volume Share Analysis, by Fuel, 2020, 2025, and 2031
Figure 18: Europe Combined Heat and Power (CHP) Installation Market Attractiveness, by Fuel
Figure 19: Europe Combined Heat and Power (CHP) Installation Market Volume Share Analysis, by Prime Mover, 2020, 2025, and 2031
Figure 20: Europe Combined Heat and Power (CHP) Installation Market Attractiveness, by Prime Mover
Figure 21: Europe Combined Heat and Power (CHP) Installation Market Volume Share Analysis, by Application, 2020, 2025, and 2031
Figure 22: Europe Combined Heat and Power (CHP) Installation Market Attractiveness, by Application
Figure 23: Europe Combined Heat and Power (CHP) Installation Market Volume Share Analysis, by Country and Sub-region, 2020, 2025, and 2031
Figure 24: Europe Combined Heat and Power (CHP) Installation Market Attractiveness, by Country and Sub-region
Figure 25: Asia Pacific Combined Heat and Power (CHP) Installation Market Volume Share Analysis, by Fuel, 2020, 2025, and 2031
Figure 26: Asia Pacific Combined Heat and Power (CHP) Installation Market Attractiveness, by Fuel
Figure 27: Asia Pacific Combined Heat and Power (CHP) Installation Market Volume Share Analysis, by Prime Mover, 2020, 2025, and 2031
Figure 28: Asia Pacific Combined Heat and Power (CHP) Installation Market Attractiveness, by Prime Mover
Figure 29: Asia Pacific Combined Heat and Power (CHP) Installation Market Volume Share Analysis, by Application, 2020, 2025, and 2031
Figure 30: Asia Pacific Combined Heat and Power (CHP) Installation Market Attractiveness, by Application
Figure 31: Asia Pacific Combined Heat and Power (CHP) Installation Market Volume Share Analysis, by Country and Sub-region, 2020, 2025, and 2031
Figure 32: Asia Pacific Combined Heat and Power (CHP) Installation Market Attractiveness, by Country and Sub-region
Figure 33: Latin America Combined Heat and Power (CHP) Installation Market Volume Share Analysis, by Fuel, 2020, 2025, and 2031
Figure 34: Latin America Combined Heat and Power (CHP) Installation Market Attractiveness, by Fuel
Figure 35: Latin America Combined Heat and Power (CHP) Installation Market Volume Share Analysis, by Prime Mover, 2020, 2025, and 2031
Figure 36: Latin America Combined Heat and Power (CHP) Installation Market Attractiveness, by Prime Mover
Figure 37: Latin America Combined Heat and Power (CHP) Installation Market Volume Share Analysis, by Application, 2020, 2025, and 2031
Figure 38: Latin America Combined Heat and Power (CHP) Installation Market Attractiveness, by Application
Figure 39: Latin America Combined Heat and Power (CHP) Installation Market Volume Share Analysis, by Country and Sub-region, 2020, 2025, and 2031
Figure 40: Latin America Combined Heat and Power (CHP) Installation Market Attractiveness, by Country and Sub-region
Figure 41: Middle East & Africa Combined Heat and Power (CHP) Installation Market Volume Share Analysis, by Fuel, 2020, 2025, and 2031
Figure 42: Middle East & Africa Combined Heat and Power (CHP) Installation Market Attractiveness, by Fuel
Figure 43: Middle East & Africa Combined Heat and Power (CHP) Installation Market Volume Share Analysis, by Prime Mover, 2020, 2025, and 2031
Figure 44: Middle East & Africa Combined Heat and Power (CHP) Installation Market Attractiveness, by Prime Mover
Figure 45: Middle East & Africa Combined Heat and Power (CHP) Installation Market Volume Share Analysis, by Application, 2020, 2025, and 2031
Figure 46: Middle East & Africa Combined Heat and Power (CHP) Installation Market Attractiveness, by Application
Figure 47: Middle East & Africa Combined Heat and Power (CHP) Installation Market Volume Share Analysis, by Country and Sub-region, 2020, 2025, and 2031
Figure 48: Middle East & Africa Combined Heat and Power (CHP) Installation Market Attractiveness, by Country and Sub-region
Copyright © Transparency Market Research, Inc. All Rights reserved
Trust Online

Combined Heat and Power [CHP] Installation Market