
Reports
Reports
Cell surface markers are unique to cell types and have vital functional role in immunology. These are generally antigens or molecules present within the plasma membrane of the cell. Such markers serve as the prime component in identification and categorization of cells such as lymphocytes, macrophages, monocytes, tumor cells and other cells majorly related to immunology. Cell surface marker analysis is performed through the use of technologies namely, flow cytometry and hematology analyzers and can be carried out on various samples such as lymph nodes, blood, bone marrow and other tissues. Such analysis may allow simplification of disease diagnosis and identification, sample preparation and drug discovery. Identification of specific types of molecules through cell surface marker analysis helps in efficient disease diagnosis and thereby assists in determination of disease treatment and drugs.
Cell surface markers analysis enables the quantification of the scope of new drugs reaching the intended target and are also responsible for achieving the clinical outcomes by altering the proposed pathophysiological mechanisms. Disease diagnosis by detection or use of cell surface markers has been beneficial and critical in developing innovative and reliable indicators with high specificity for the diagnosis and prognosis of different types of diseases, majorly cancer.
High-throughput tools and techniques in addition to miniature and robust instruments with manifold applications have been the recent need to meet requirements of both research and clinical sectors. Companies investing heavily in developing automated systems with improved sample processing and analysis may gain greater benefits in the near future. Introduction of new and cost-effective instruments is further facilitating the growth of new market entrants and is also being achieved via showcasing advantages of the software and technical capabilities of their instruments at various conferences, laboratories, trade shows, web casting and electronic newsletters.
At present, a broad range of assay technologies and solutions for cell surface marker research are available in the market to enable the analysis of gene expression and regulation, genotyping, signal transduction and epigenetic modifications. Some of the most common solutions available for cell surface marker analysis are PCR array, miRNA, pathway reporter, mutation analysis, DNA methylation and protein expression. Complexity of high-end flow cytometers and expensive reagents, controls and analysis systems results into lowering the adoption of sophisticated cell marker analysis solutions, particularly in economically lagged countries. Thus rising preference for lowering healthcare spending by cost containment in diagnosis procedures coupled with rapid and efficient decision making for therapies of specific diseases will further aid in sustaining the growing acceptance of cell surface marker analysis worldwide.
Geographically, North America dominates the global cell surface markers market. As majority of the prime players in the market are domiciled in North America, many technological advancements first are introduced in this region. Growing acceptance of cell surface markers analysis by major industries and verified efficiency in clinical laboratories drives the market for cell surface markers in North America. In addition, factors such as increased market consolidation, simplification of analysis process, cost containment of instruments and reagents and introduction of cheaper products will result in rapid adoption of research in cell surface markers field in the emerging markets. Furthermore, increase in healthcare awareness, affordability, better patient rehabilitation, growth in medical tourism and less competition levels than developed markets will result in growth in demand for identification of cell surface markers and associated disease diagnosis and treatment in emerging economies.
1. Introduction
1.1. Report Description
1.2. Market Segmentation
1.3. Research Methodology
1.4. List of Abbreviations
2. Executive Summary
3. Market Overview
3.1. Market Trends and Future Outlook
3.2. Global Cell Surface Markers Market Revenues, by Instruments and Reagents, 2011-2019 (USD Million)
3.3. Drivers
3.3.1. Growing Automation in Laboratories
3.3.2. Discovery of New Markers will Need New Antibodies
3.3.3. Increased Use of In Vitro Diagnostics
3.3.4. Need for Lowering Healthcare Expenditure
3.4. Restraints
3.4.1. Reluctance for High Investment in Sophisticated Models
3.4.2. Complexity in the Use of Flow Cytometers
3.5. Opportunities
3.5.1. Growth in Expertise for Operation of Cell Marking Tools
3.5.2. Targeted Therapy and Personalized Medicine
3.6. Porter’s Five Force Analysis for the Global Cell Surface Markers Market
3.6.1. Bargaining Power of Suppliers
3.6.2. Bargaining Power of Buyers
3.6.3. Threat of New Entrants
3.6.4. Threat of Substitutes
3.6.5. Competitive Rivalry
3.7. Market Attractiveness Analysis of Global Cell Surface Markers Market, by Instruments and Reagents, 2012
4. Global Cell Surface Markers Market, by Instruments and Reagents
4.1. Overview – Current Market Scenario and Future Market Trends
4.1.1. Global Cell Surface Markers Market Revenues, 2011-2019 (USD Million)
4.2. Flow Cytometry
4.2.1. Global Flow Cytometers Market Revenues, 2013-2019 (USD Million)
4.2.2. Global Flow Cytometers Market Volume, 2013-2019 (Number of Units Installed)
4.3. Hematology Analyzers
4.3.1. Global Hematology Analyzers Market Revenues, 2011-2019 (USD Million)
4.3.2. Global Hematology Analyzers Market Volume, 2013-2019 (Number of Units Installed)
4.4. Reagents and Kits
4.4.1. Global Reagent and Kits Market Revenues, 2011-2019 (USD Million)
5. Global Cell Surface Markers Market, by Applications
5.1. Disease Diagnosis
5.1.1. Global Cell Surface Markers Market Revenues, by Disease Diagnosis and Identification, 2011-2019 (USD Million)
5.2. Research and Drug Discovery
5.2.1. Global Cell Surface Markers Market Revenues, by Research and Drug Discovery, 2011-2019 (USD Million)
6. Global Cell Surface Markers Market, by Geography
6.1. Introduction
6.2. North America
6.2.1. North America Cell Surface Markers Market Revenues, 2011-2019 (USD Million)
6.3. Europe
6.3.1. Europe Cell Surface Markers Market Revenues, Size and Forecast, 2011-2019 (USD Million)
6.4. Asia-Pacific
6.4.1. Asia-Pacific Cell Surface Markers Market Revenues, 2011-2019 (USD Million)
6.5. Rest of the World (RoW)
6.5.1. Rest of the World (RoW) Cell Surface Markers Market Revenues, Size and Forecast, 2011-2019 (USD Million)
7. Recommendations
8. Company Profiles
8.1. Abbott Laboratories, Inc.
8.1.1. Company Overview
8.1.2. Strategic Overview
8.1.3. Financial Overview
8.1.4. Product Portfolio
8.1.5. Recent Developments
8.2. Beckman Coulter, Inc.
8.2.1. Company Overview
8.2.2. Strategic Overview
8.2.3. Financial Overview
8.2.4. Product Portfolio
8.2.5. Recent Developments
8.3. BD Biosciences
8.3.1. Company Overview
8.3.2. Strategic Overview
8.3.3. Financial Overview
8.3.4. Product Portfolio
8.3.5. Recent Development
8.4. Bio-Rad Laboratories, Inc.
8.4.1. Company Overview
8.4.2. Strategic Overview
8.4.3. Financial Overview
8.4.4. Product Portfolio
8.4.5. Recent Development
8.5. Grifols SA
8.5.1. Company Overview
8.5.2. Strategic Overview
8.5.3. Financial Overview
8.5.4. Product Portfolio
8.5.5. Recent Development
8.6. Immucor, Inc.
8.6.1. Company Overview
8.6.2. Strategic Overview
8.6.3. Financial Overview
8.6.4. Product Portfolio
8.6.5. Recent Developments
8.7. Janssen Diagnostics, Inc.
8.7.1. Company Overview
8.7.2. Strategic Overview
8.7.3. Financial Overview
8.7.4. Product Portfolio
8.7.5. Recent development
8.8. Nihon Kohden Corporation
8.8.1. Company Overview
8.8.2. Strategic Overview
8.8.3. Financial Overview
8.8.4. Product Portfolio
8.8.5. Recent developments
8.9. F. Hoffmann-La Roche Ltd.
8.9.1. Company Overview
8.9.2. Strategic Overview
8.9.3. Financial Overview
8.9.4. Product Portfolio
8.9.5. Recent Developments
8.10. Siemens Healthcare
8.10.1. Company Overview
8.10.2. Strategic Overview
8.10.3. Financial Overview
8.10.4. Product Portfolio
8.10.5. Recent Developments
8.11. Sysmex Corporation
8.11.1. Company Overview
8.11.2. Strategic Overview
8.11.3. Financial Overview
8.11.4. Product Portfolio
8.11.5. Recent Development
8.12. Thermo Fischer Scientific, Inc.
8.12.1. Company Overview
8.12.2. Strategic Overview
8.12.3. Financial Overview
8.12.4. Product Portfolio
8.12.5. Recent Development
LIST OF TABLE
TABLE 1: Market Snapshot: Global Cell Surface Markers Market
TABLE 2: Global Cell Surface Markers Market Revenues, by Instruments and Reagents, 2011-2019 (USD Million)
TABLE 3: Global Cell Surface Markers Market Revenues, by Geography, Size and Forecast, 2013-2019 (USD Million)
TABLE 4: North America Cell Surface Markers Market Revenues, by Instruments and Reagents, 2011-2019 (USD Million)
TABLE 5: Europe Cell Surface Markers Market Revenues, By Instruments and Reagents, 2011-2019 (USD Million)
TABLE 6: Asia-Pacific Cell Surface Markers Market Revenues, By Instruments and Reagents, 2011-2019 (USD Million)
TABLE 7: RoW Cell Surface Markers Market Revenues, By Instruments and Reagents, 2011-2019 (USD Million)
LIST OF FIGURE
FIG. 1: Cell Surface Markers: Market Segmentation
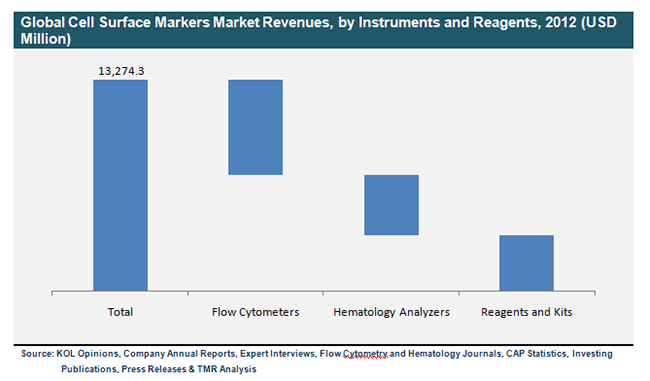
FIG. 2: Global Cell Surface Markers Market Revenues, by Instruments and Reagents, 2012 (USD Million)
FIG. 3: Global Cell Surface Markers Market Revenues, by Geography, 2012 (USD Million)
FIG. 4: Porter’s Five Force Analysis: Global Cell Surface Markers Market
FIG. 5: Market Attractive Analysis: Global Cell Surface Markers Market, by Instruments and Reagents, 2012
FIG. 6: Global Cell Surface Markers Market Revenues, 2011-2019 (USD Million)
FIG. 7: Global Flow Cytometers Market Revenues, 2011-2019 (USD Million)
FIG. 8: Global Flow Cytometers Market Volume, 2011-2019 (Number of Units Installed)
FIG. 9: Global Hematology Analyzers Market Revenues, 2011-2019 (USD Million)
FIG. 10: Global Hematology Analyzers Market Volume, 2011-2019 (Number of Units Installed)
FIG. 11: Global Reagents and Kits Market Revenues, 2011-2019 (USD Million)
FIG. 12: Global Cell Surface Markers Market Revenues, by Disease Diagnosis and Identification, 2011-2019 (USD Million)
FIG. 13: Global Cell Surface Markers Market Revenues, by Research and Drug Discovery, 2011-2019 (USD Million)
FIG. 14: North America Cell Surface Markers Market Revenues, 2011-2019 (USD Million)
FIG. 15: Europe Cell Surface Markers Market Revenues, 2011-2019 (USD Million)
FIG. 16: Asia-Pacific Cell Surface Markers Market Revenues, 2011-2019(USD Million)
FIG. 17: Rest of the World (RoW) Cell Surface Markers Market Revenues, 2011-2019 (USD Million)
FIG. 18: Annual Revenues of Abbott Laboratories, Inc., 2010-2012 (USD Million)
FIG. 19: Annual Revenues of Bio-Rad Laboratories, Inc., 2010-2012 (USD Million)
FIG. 20: Annual Revenues of Grifols SA, 2010-2012 (USD Million)
FIG. 21: Annual Revenues of Immucor, Inc., 2010-2012 (USD Million)
FIG. 22: Annual Revenues of Nihon Kohden Corp., 2010-2012 (USD Million)
FIG. 23: Annual Revenues of Hoffmann-La Roche Ltd., 2010-2012 (USD Million)
FIG. 24: Annual Revenues of Siemens Healthcare, 2010-2012 (USD Million)
FIG. 25: Annual Revenues of Sysmex Corporation, 2010-2012 (USD Million)
FIG. 26: Annual Revenues of Thermo Fischer Scientific, Inc., 2010-2012 (USD Million)
Copyright © Transparency Market Research, Inc. All Rights reserved
Trust Online

Cell Surface Markers (Flow Cytometers, Hematology Analyzers, Reagents and Kits) Market