
Reports
Reports
Analysts’ Viewpoint on Global Caustic Soda Market Scenario
Companies in the caustic soda market are focusing on high-demand applications, such as alumina, pulp & paper, and soaps & detergents. The caustic soda market is rapidly growing, due to increased use in chemical production and petroleum products. Moreover, the increasing application of caustic soda in industries such as water treatment, metal processing, mining, glass production, food, and textiles is also boosting the caustic soda market. Key players in the caustic soda market are emphasizing on capacity growth and joint ventures in emerging markets, such as India and China, to cater to the augmented demand. Manufacturers should focus on understanding the winning imperatives of leading players, such as innovation of new products and production processes, in order to increase their market share. Manufacturers of caustic soda are also focusing on competitive pricing strategies in order to generate more business volume.
Caustic soda is a solid white pearl product. It is highly soluble in water. Caustic soda rapidly absorbs moisture and carbon dioxide from the atmosphere. It produces a sequence of hydrates known as NaOHnH2O. Caustic soda can be used to unclog drains and create soaps. Caustic soda is commonly utilized as a drain pipe cleaner to unclog drains. It is also used to remove grease buildup from ovens, and in the manufacture of soaps and detergents.
Caustic soda is industrially produced through the electrolysis of brine solution. Large electrolytic production processes use membrane cells and diaphragm cells. Caustic soda is an inorganic compound that is used in various end-use industries due to its strong alkaline property. It is prepared by using three processes: Castner-Kellner process, Nelson Diaphragm cell, and Loewig’s process. The Castner-Kellner method is one of the most commonly used processes for manufacturing caustic soda. In the Castner-Kellner method, electrolysis of brine solution is carried out to obtain sodium hydroxide. The caustic soda obtained after this process is employed as a cleansing agent and in the manufacture of washing soda.
Caustic soda is widely used to extract alumina, the most common oxides of aluminum, from breaking down the sedimentary rock of naturally occurring minerals. Caustic soda lye is extensively employed in diverse applications in several end-use industries, including automotive, construction materials, and consumer goods, such as soda cans and food packaging. The demand for aluminum oxide, or alumina, has been prominent in the automotive industry, as it offers various benefits such as a rapid, safe, environment-friendly and cost-effective way of boosting performance, fuel economy, and reducing emissions, without compromising on safety and long-life in cars and other commercial vehicles. Aluminum is the most used non-ferrous material in automotive, as new aluminum alloys are developed to deliver more value than steel.
Aluminum is ideal for transporting energy over longer distances due to its lightweight and durability. Aluminum can be rolled through a continuous process of casting and cold rolling and can take the desired shape and thickness. It is also used to make sheets and utensils, which are not only used to cook food but also to keep it fresh. In the building & construction industry, aluminum is used to make frames for doors and windows, staircases, heating systems, roofs, furniture, and others.
Consistent rise in the demand for aluminum is likely to drive the production of alumina, which is further expected to propel the demand for caustic soda during the forecast period.
Caustic soda (also known as Sodium Hydroxide) is an essential ingredient in the manufacture of soaps, cleaners, and detergents. Sodium hydroxide flakes are widely used due to their ability to dissolve oils, grease, fat, and protein-based deposits. Caustic soda flakes are used in the saponification process, which converts vegetable oils into soap. They are utilized to manufacture anionic surfactants, a crucial component in most detergent and cleaning products.
In terms of ionic properties, detergents are classified into anionic, cationic, and non-ionic. Key applications of detergents are reflected in household cleaning and fuel additives. Soaps and detergents are widely utilized for proper sanitation of homes, offices, manufacturing plants, and others. Chlorine bleach, for instance, combines chlorine and sodium hydroxide to create a powerful disinfectant.
Detergent was an effective disinfecting agent for the novel COVID-19 pandemic. Clothes, unlike other hard surfaces had layers, on which, the virus can easily settle down. Researchers suggested leaving the cloths soaked in detergent for some time before washing may help get rid of the virus. This, in turn, is increasing the demand for detergents in households. However, manufacturers across the globe are witnessing a boom in the demand for soaps and detergents due to the COVID-19 crisis. Therefore, the market for caustic soda is estimated to grow at a considerable pace during forecast period due to the increased usage of detergents and soaps across the world.
In terms of volume, Asia Pacific leads the global caustic soda market, and the region accounted for more than 50% share of the global caustic soda market in 2021. China is a key country of the caustic soda market in Asia Pacific. China is the largest pulp and paper producing country in the world, due to its large forest reserves (22.5% of its land area). The country is also a hub for chemical processing, accounting for a notable share of all chemicals produced globally.
Rise in demand for organic and inorganic chemicals around the world is projected to boost the demand for caustic soda in the region during the forecast period. Asia Pacific is estimated to maintain its dominant position in the global market during the forecast period.
In terms of volume, North America and Europe are also key markets for caustic soda. These regions accounted for 17.1% and 28.6% value share, respectively, of the global market in 2021.
Middle East & Africa is a larger market for caustic soda than the market in Latin America; however, the market in Latin America is likely to grow at a higher growth rate during the forecast period.
The global caustic soda market is highly fragmented, with a larger number of small and medium players operating in the market. Most companies are investing considerably in comprehensive research and development activities, primarily to create environment-friendly products. The growth of product portfolios and mergers & acquisitions are key strategies adopted by prominent players. Occidental Petroleum Corporation, Reliance Industries Limited, AkzoNobel N.V., Olin Corporation, and The Dow Chemical Company are the key entities operating in the market.
Each of these players has been profiled in the caustic soda market report based on parameters such as company overview, financial overview, business strategies, product portfolio, business segments, and recent developments.
|
Attribute |
Detail |
|
Market Size Value in 2021 |
US$ 39.8 Bn |
|
Market Forecast Value in 2031 |
US$ 59.3 Bn |
|
Growth Rate (CAGR) |
3.7% |
|
Forecast Period |
2022–2031 |
|
Historical Data Available for |
2020 |
|
Quantitative Units |
US$ Bn for Value and Kilo Tons for Volume |
|
Market Analysis |
It includes cross-segment analysis at the global as well as regional level. Furthermore, the qualitative analysis includes drivers, restraints, opportunities, key trends, Porter’s Five Forces analysis, value chain analysis, and key trend analysis. |
|
Competition Landscape |
|
|
Format |
Electronic (PDF) + Excel |
|
Market Segmentation |
|
|
Regions Covered |
|
|
Countries Covered |
|
|
Companies Profiled |
|
|
Customization Scope |
Available upon request |
|
Pricing |
Available upon request |
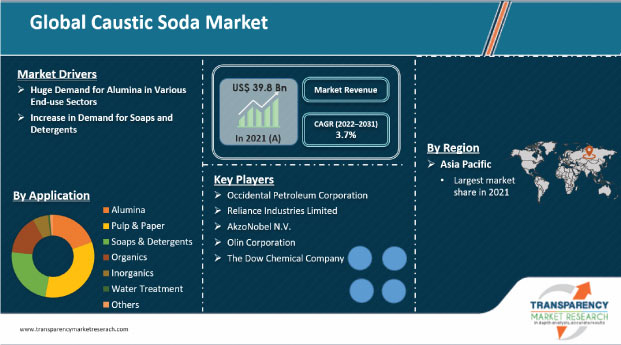
The caustic soda market stood at US$ 39.8 Bn in 2021.
The caustic soda market is expected to grow at a CAGR of 3.7% from 2022 to 2031.
High demand for alumina in various end-use sectors and increase in demand for soaps & detergents are key drivers of the caustic soda market.
Alumina was the largest application segment that held more than 32% value share in 2021.
Asia Pacific was the most lucrative region of the caustic soda market in 2021.
Occidental Petroleum Corporation, Reliance Industries Limited, AkzoNobel N.V., Olin Corporation, and The Dow Chemical Company
1. Executive Summary
1.1. Caustic Soda Market Snapshot
1.2. Current Market and Future Potential
2. Market Overview
2.1. Market Segmentation
2.2. Market Trends
2.3. Market Dynamics
2.3.1. Drivers
2.3.2. Restraints
2.3.3. Opportunities
2.4. Porter’s Five Forces Analysis
2.5. Regulatory Analysis
2.6. Value Chain Analysis
2.6.1. List of Raw Materials Providers
2.6.2. List of Caustic Soda Manufacturers
2.6.3. List of Dealers/Distributors
2.6.4. List of Potential Customer
3. COVID-19 Impact Analysis
4. Caustic Soda Market Analysis and Forecast, by Application, 2022-2031
4.1. Introduction and Definitions
4.2. Global Caustic Soda Market Volume (Kilo Tons) and Value (US$ Bn) Forecast, by Application, 2022-2031
4.2.1. Alumina
4.2.2. Pulp & Paper
4.2.3. Soaps & Detergents
4.2.4. Organics
4.2.5. Inorganics
4.2.6. Water Treatment
4.2.7. Others (including Textiles, Petroleum Processing, and Food Processing)
4.3. Global Caustic Soda Market Attractiveness, by Application
5. Global Caustic Soda Market Analysis and Forecast, by Region, 2022-2031
5.1. Key Findings
5.2. Global Caustic Soda Market Volume (Kilo Tons) and Value (US$ Bn) Forecast, by Region, 2022-2031
5.2.1. North America
5.2.2. Europe
5.2.3. Asia Pacific
5.2.4. Latin America
5.2.5. Middle East & Africa
5.3. Global Caustic Soda Market Attractiveness, by Region
6. North America Caustic Soda Market Analysis and Forecast, 2022-2031
6.1. Key Findings
6.2. North America Caustic Soda Market Volume (Kilo Tons) and Value (US$ Bn) Forecast, by Application, 2022-2031
6.3. North America Caustic Soda Market Volume (Kilo Tons) and Value (US$ Bn) Forecast, by Country, 2022-2031
6.3.1. U.S. Caustic Soda Market Volume (Kilo Tons) and Value (US$ Bn) Forecast, by Application, 2022-2031
6.3.2. Canada Caustic Soda Market Volume (Kilo Tons) and Value (US$ Bn) Forecast, by Application, 2022-2031
6.4. North America Caustic Soda Market Attractiveness Analysis
7. Europe Caustic Soda Market Analysis and Forecast, 2022-2031
7.1. Key Findings
7.2. Europe Caustic Soda Market Volume (Kilo Tons) and Value (US$ Bn) Forecast, by Application, 2022-2031
7.3. Europe Caustic Soda Market Volume (Kilo Tons) and Value (US$ Bn) Forecast, by Country and Sub-region, 2022-2031
7.3.1. Germany Caustic Soda Market Volume (Kilo Tons) and Value (US$ Bn) Forecast, by Application, 2022-2031
7.3.2. France Caustic Soda Market Volume (Kilo Tons) and Value (US$ Bn) Forecast, by Application, 2022-2031
7.3.3. U.K. Caustic Soda Market Volume (Kilo Tons) and Value (US$ Bn) Forecast, by Application, 2022-2031
7.3.4. Italy Caustic Soda Market Volume (Kilo Tons) and Value (US$ Bn) Forecast, by Application, 2022-2031
7.3.5. Russia & CIS Caustic Soda Market Volume (Kilo Tons) and Value (US$ Bn) Forecast, by Application, 2022-2031
7.3.6. Rest of Europe Caustic Soda Market Volume (Kilo Tons) and Value (US$ Bn) Forecast, by Application, 2022-2031
7.4. Europe Caustic Soda Market Attractiveness Analysis
8. Asia Pacific Caustic Soda Market Analysis and Forecast, 2022-2031
8.1. Key Findings
8.2. Asia Pacific Caustic Soda Market Volume (Kilo Tons) and Value (US$ Bn) Forecast, by Application
8.3. Asia Pacific Caustic Soda Market Volume (Kilo Tons) and Value (US$ Bn) Forecast, by Country and Sub-region, 2022-2031
8.3.1. China Caustic Soda Market Volume (Kilo Tons) and Value (US$ Bn) Forecast, by Application, 2022-2031
8.3.2. Japan Caustic Soda Market Volume (Kilo Tons) and Value (US$ Bn) Forecast, by Application, 2022-2031
8.3.3. India Caustic Soda Market Volume (Kilo Tons) and Value (US$ Bn) Forecast, by Application, 2022-2031
8.3.4. ASEAN Caustic Soda Market Volume (Kilo Tons) and Value (US$ Bn) Forecast, by Application, 2022-2031
8.3.5. Rest of Asia Pacific Caustic Soda Market Volume (Kilo Tons) and Value (US$ Bn) Forecast, by Application, 2022-2031
8.4. Asia Pacific Caustic Soda Market Attractiveness Analysis
9. Latin America Caustic Soda Market Analysis and Forecast, 2022-2031
9.1. Key Findings
9.2. Latin America Caustic Soda Market Volume (Kilo Tons) and Value (US$ Bn) Forecast, by Application, 2022-2031
9.3. Latin America Caustic Soda Market Volume (Kilo Tons) and Value (US$ Bn) Forecast, by Country and Sub-region, 2022-2031
9.3.1. Brazil Caustic Soda Market Volume (Kilo Tons) and Value (US$ Bn) Forecast, by Application, 2022-2031
9.3.2. Mexico Caustic Soda Market Volume (Kilo Tons) and Value (US$ Bn) Forecast, by Application, 2022-2031
9.3.3. Rest of Latin America Caustic Soda Market Volume (Kilo Tons) and Value (US$ Bn) Forecast, by Application, 2022-2031
9.4. Latin America Caustic Soda Market Attractiveness Analysis
10. Middle East & Africa Caustic Soda Market Analysis and Forecast, 2022-2031
10.1. Key Findings
10.2. Middle East & Africa Caustic Soda Market Volume (Kilo Tons) and Value (US$ Bn) Forecast, by Application, 2022-2031
10.3. Middle East & Africa Caustic Soda Market Volume (Kilo Tons) and Value (US$ Bn) Forecast, by Country and Sub-region, 2022-2031
10.3.1. GCC Caustic Soda Market Volume (Kilo Tons) and Value (US$ Bn) Forecast, by Application, 2022-2031
10.3.2. South Africa Caustic Soda Market Volume (Kilo Tons) and Value (US$ Bn) Forecast, by Application, 2022-2031
10.3.3. Rest of Middle East & Africa Caustic Soda Market Volume (Kilo Tons) and Value (US$ Bn) Forecast, by Application, 2022-2031
10.4. Middle East & Africa Caustic Soda Market Attractiveness Analysis
11. Competition Landscape
11.1. Global Caustic Soda Company Market Share Analysis, 2021
11.2. Company Profiles (Details – Overview, Financials, Recent Developments, and Strategy)
11.2.1. The Dow Chemical Company (Dow)
11.2.1.1. Company Description
11.2.1.2. Business Overview
11.2.1.3. Financial Overview
11.2.1.4. Strategic Overview
11.2.2. Olin Corporation
11.2.2.1. Company Description
11.2.2.2. Business Overview
11.2.2.3. Financial Overview
11.2.2.4. Strategic Overview
11.2.3. AkzoNobel N.V.
11.2.3.1. Company Description
11.2.3.2. Business Overview
11.2.3.3. Financial Overview
11.2.3.4. Strategic Overview
11.2.4. Reliance Industries Limited (RIL)
11.2.4.1. Company Description
11.2.4.2. Business Overview
11.2.4.3. Financial Overview
11.2.4.4. Strategic Overview
11.2.5. Occidental Petroleum Corporation (Oxy)
11.2.5.1. Company Description
11.2.5.2. Business Overview
11.2.5.3. Financial Overview
11.2.5.4. Strategic Overview
11.2.6. Formosa Plastics Group (FPG)
11.2.6.1. Company Description
11.2.6.2. Business Overview
11.2.6.3. Financial Overview
11.2.6.4. Strategic Overview
11.2.7. Shin-Etsu Chemicals Co., Ltd. (Shin-Etsu)
11.2.7.1. Company Description
11.2.7.2. Business Overview
11.2.7.3. Financial Overview
11.2.7.4. Strategic Overview
11.2.8. Axiall Corporation
11.2.8.1. Company Description
11.2.8.2. Business Overview
11.2.8.3. Financial Overview
11.2.8.4. Strategic Overview
11.2.9. INEOS ChlorVinyls
11.2.9.1. Company Description
11.2.9.2. Business Overview
11.2.9.3. Financial Overview
11.2.9.4. Strategic Overview
11.2.10. Bayer MaterialScience AG
11.2.10.1. Company Description
11.2.10.2. Business Overview
11.2.10.3. Financial Overview
11.2.10.4. Strategic Overview
11.2.11. Meghmani Finechem Limited
11.2.11.1. Company Description
11.2.11.2. Business Overview
11.2.11.3. Financial Overview
11.2.11.4. Strategic Overview
11.2.12. BorsodChem
11.2.12.1. Company Description
11.2.12.2. Business Overview
11.2.12.3. Financial Overview
11.2.12.4. Strategic Overview
12. Primary Research: Key Insights
13. Appendix
List of Tables
Table 1: Global Caustic Soda Market Volume (Kilo Tons) Forecast, by Application, 2022-2031
Table 2: Global Caustic Soda Market Value (US$ Bn) Forecast, by Application, 2022-2031
Table 3: Global Caustic Soda Market Volume (Kilo Tons) Forecast, by Region, 2022-2031
Table 4: Global Caustic Soda Market Value (US$ Bn) Forecast, by Region, 2022-2031
Table 5: North America Caustic Soda Market Volume (Kilo Tons) Forecast, by Application, 2022-2031
Table 6: North America Caustic Soda Market Value (US$ Bn) Forecast, by Application, 2022-2031
Table 7: North America Caustic Soda Market Volume (Kilo Tons) Forecast, by Country, 2022-2031
Table 8: North America Caustic Soda Market Value (US$ Bn) Forecast, by Country, 2022-2031
Table 9: U.S. Caustic Soda Market Volume (Kilo Tons) Forecast, by Application, 2022-2031
Table 10: U.S. Caustic Soda Market Value (US$ Bn) Forecast, by Application, 2022-2031
Table 11: Canada Caustic Soda Market Volume (Kilo Tons) Forecast, by Application, 2022-2031
Table 12: Canada Caustic Soda Market Value (US$ Bn) Forecast, by Application, 2022-2031
Table 13: Europe Caustic Soda Market Volume (Kilo Tons) Forecast, by Application, 2022-2031
Table 14: Europe Caustic Soda Market Value (US$ Bn) Forecast, by Application, 2022-2031
Table 15: Europe Caustic Soda Market Volume (Kilo Tons) Forecast, by Country and Sub-region, 2022-2031
Table 16: Europe Caustic Soda Market Value (US$ Bn) Forecast, by Country and Sub-region, 2022-2031
Table 17: Germany Caustic Soda Market Volume (Kilo Tons) Forecast, by Application, 2022-2031
Table 18: Germany Caustic Soda Market Value (US$ Bn) Forecast, by Application, 2022-2031
Table 19: France Caustic Soda Market Volume (Kilo Tons) Forecast, by Application, 2022-2031
Table 20: France Caustic Soda Market Value (US$ Bn) Forecast, by Application, 2022-2031
Table 21: U.K. Caustic Soda Market Volume (Kilo Tons) Forecast, by Application, 2022-2031
Table 22: U.K. Caustic Soda Market Value (US$ Bn) Forecast, by Application, 2022-2031
Table 23: Italy Caustic Soda Market Volume (Kilo Tons) Forecast, by Application, 2022-2031
Table 24: Italy Caustic Soda Market Value (US$ Bn) Forecast, by Application, 2022-2031
Table 25: Spain Caustic Soda Market Volume (Kilo Tons) Forecast, by Application, 2022-2031
Table 26: Spain Caustic Soda Market Value (US$ Bn) Forecast, by Application, 2022-2031
Table 27: Russia & CIS Caustic Soda Market Volume (Kilo Tons) Forecast, by Application, 2022-2031
Table 28: Russia & CIS Caustic Soda Market Value (US$ Bn) Forecast, by Application, 2022-2031
Table 29: Rest of Europe Caustic Soda Market Volume (Kilo Tons) Forecast, by Application, 2022-2031
Table 30: Rest of Europe Caustic Soda Market Value (US$ Bn) Forecast, by Application, 2022-2031
Table 31: Asia Pacific Caustic Soda Market Volume (Kilo Tons) Forecast, by Application, 2022-2031
Table 32: Asia Pacific Caustic Soda Market Value (US$ Bn) Forecast, by Application, 2022-2031
Table 33: Asia Pacific Caustic Soda Market Volume (Kilo Tons) Forecast, by Country and Sub-region, 2022-2031
Table 34: Asia Pacific Caustic Soda Market Value (US$ Bn) Forecast, by Country and Sub-region, 2022-2031
Table 35: China Caustic Soda Market Volume (Kilo Tons) Forecast, by Application, 2022-2031
Table 36: China Caustic Soda Market Value (US$ Bn) Forecast, by Application 2022-2031
Table 37: Japan Caustic Soda Market Volume (Kilo Tons) Forecast, by Application, 2022-2031
Table 38: Japan Caustic Soda Market Value (US$ Bn) Forecast, by Application, 2022-2031
Table 39: India Caustic Soda Market Volume (Kilo Tons) Forecast, by Application, 2022-2031
Table 40: India Caustic Soda Market Value (US$ Bn) Forecast, by Application, 2022-2031
Table 41: ASEAN Caustic Soda Market Volume (Kilo Tons) Forecast, by Application, 2022-2031
Table 42: ASEAN Caustic Soda Market Value (US$ Bn) Forecast, by Application, 2022-2031
Table 43: Rest of Asia Pacific Caustic Soda Market Volume (Kilo Tons) Forecast, by Application, 2022-2031
Table 44: Rest of Asia Pacific Caustic Soda Market Value (US$ Bn) Forecast, by Application, 2022-2031
Table 45: Latin America Caustic Soda Market Volume (Kilo Tons) Forecast, by Application, 2022-2031
Table 46: Latin America Caustic Soda Market Value (US$ Bn) Forecast, by Application, 2022-2031
Table 47: Latin America Caustic Soda Market Volume (Kilo Tons) Forecast, by Country and Sub-region, 2022-2031
Table 48: Latin America Caustic Soda Market Value (US$ Bn) Forecast, by Country and Sub-region, 2022-2031
Table 49: Brazil Caustic Soda Market Volume (Kilo Tons) Forecast, by Application, 2022-2031
Table 50: Brazil Caustic Soda Market Value (US$ Bn) Forecast, by Application, 2022-2031
Table 51: Mexico Caustic Soda Market Volume (Kilo Tons) Forecast, by Application, 2022-2031
Table 52: Mexico Caustic Soda Market Value (US$ Bn) Forecast, by Application, 2022-2031
Table 53: Rest of Latin America Caustic Soda Market Volume (Kilo Tons) Forecast, by Application, 2022-2031
Table 54: Rest of Latin America Caustic Soda Market Value (US$ Bn) Forecast, by Application, 2022-2031
Table 55: Middle East & Africa Caustic Soda Market Volume (Kilo Tons) Forecast, by Application, 2022-2031
Table 56: Middle East & Africa Caustic Soda Market Value (US$ Bn) Forecast, by Application, 2022-2031
Table 57: Middle East & Africa Caustic Soda Market Volume (Kilo Tons) Forecast, by Country and Sub-region, 2022-2031
Table 58: Middle East & Africa Caustic Soda Market Value (US$ Bn) Forecast, by Country and Sub-region, 2022-2031
Table 59: GCC Caustic Soda Market Volume (Kilo Tons) Forecast, by Application, 2022-2031
Table 60: GCC Caustic Soda Market Value (US$ Bn) Forecast, by Application, 2022-2031
Table 61: South Africa Caustic Soda Market Volume (Kilo Tons) Forecast, by Application, 2022-2031
Table 62: South Africa Caustic Soda Market Value (US$ Bn) Forecast, by Application, 2022-2031
Table 63: Rest of Middle East & Africa Caustic Soda Market Volume (Kilo Tons) Forecast, by Application, 2022-2031
Table 64: Rest of Middle East & Africa Caustic Soda Market Value (US$ Bn) Forecast, by Application, 2022-2031
List of Figures
Figure 1: Global Caustic Soda Market Volume Share Analysis, by Application, 2021, 2025, and 2031
Figure 2: Global Caustic Soda Market Attractiveness, by Application
Figure 3: Global Caustic Soda Market Volume Share Analysis, by Region, 2021, 2025, and 2031
Figure 4: Global Caustic Soda Market Attractiveness, by Region
Figure 5: North America Caustic Soda Market Volume Share Analysis, by Application, 2021, 2025, and 2031
Figure 6: North America Caustic Soda Market Attractiveness, by Application
Figure 7: North America Caustic Soda Market Attractiveness, by Application
Figure 8: North America Caustic Soda Market Attractiveness, by Country
Figure 9: Europe Caustic Soda Market Volume Share Analysis, by Application, 2021, 2025, and 2031
Figure 10: Europe Caustic Soda Market Attractiveness, by Application
Figure 11: Europe Caustic Soda Market Volume Share Analysis, by Country and Sub-region, 2021, 2025, and 2031
Figure 12: Europe Caustic Soda Market Attractiveness, by Country and Sub-region
Figure 13: Asia Pacific Caustic Soda Market Volume Share Analysis, by Application, 2021, 2025, and 2031
Figure 14: Asia Pacific Caustic Soda Market Attractiveness, by Application
Figure 15: Asia Pacific Caustic Soda Market Volume Share Analysis, by Country and Sub-region, 2021, 2025, and 2031
Figure 16: Asia Pacific Caustic Soda Market Attractiveness, by Country and Sub-region
Figure 17: Latin America Caustic Soda Market Volume Share Analysis, by Application, 2021, 2025, and 2031
Figure 18: Latin America Caustic Soda Market Attractiveness, by Application
Figure 19: Latin America Caustic Soda Market Volume Share Analysis, by Country and Sub-region, 2021, 2025, and 2031
Figure 20: Latin America Caustic Soda Market Attractiveness, by Country and Sub-region
Figure 21: Middle East & Africa Caustic Soda Market Volume Share Analysis, by Application, 2021, 2025, and 2031
Figure 22: Middle East & Africa Caustic Soda Market Attractiveness, by Application
Figure 23: Middle East & Africa Caustic Soda Market Volume Share Analysis, by Country and Sub-region, 2021, 2025, and 2031
Figure 24: Middle East & Africa Caustic Soda Market Attractiveness, by Country and Sub-region
Copyright © Transparency Market Research, Inc. All Rights reserved
Trust Online

Caustic Soda Market