
Reports
Reports
Keen companies operating in the global automotive end-point authentication market have two key strategies for growth – carefully-considered acquisitions and product development through research and development. This has made competition stiff in the market. New players, however, find it difficult to foray into the market on account of the substantial upfront capital required for setting up of manufacturing units for automotive end-point authentication. Hence, there are just a handful of small and medium sized companies in the market.
Majorly fuelling the market is the stringent regulatory requirements in different parts of the world that are compelling automobile manufacturers to develop vehicles having improved safety and security features, leveraging end-point authentication as a major technology. Besides, automotive end-point authentication technology aids in stemming thefts and damages to vehicles. This is also expected to catalyze growth in the market.
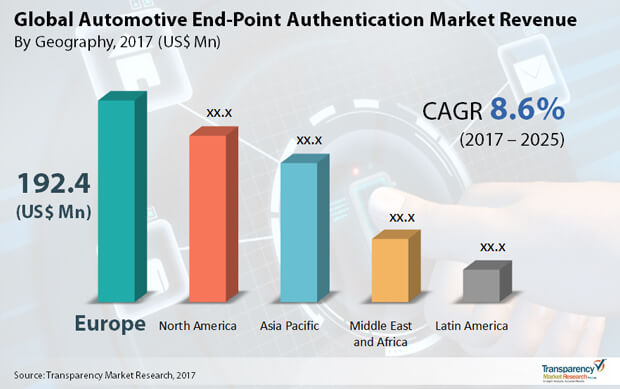
A report by Transparency Market Research forecasts the global automotive end-point authentication market to expand at a healthy 8.6% CAGR from 2017 to 2025. At this rate, the market is expected to reach a value of US$1.115 million by 2025 from US$0.504 million in 2017.
The global automotive end-point authentication market can be classified into conventional and hybrid and electric vehicles depending upon the type of vehicle. Among them, the conventional vehicles such as passenger vehicles, sports-utility vehicles, and multi-utility vehicles use diesel. Those include pickup trucks, buses, three wheelers, construction vehicles, hatchbacks, sedans, etc.
Among the two types of vehicles, the conventional vehicles accounted for about 50.0% share in the global automotive end-point authentication market. The hybrid and electric vehicles segment too is expanding at a swift pace on account of their fuel efficiency and environmentally friendly nature. This in turn is set to improve the application areas of end-point authentication systems in hybrid and electric vehicles.
Geographically, Europe grossed the maximum revenue – about 30.0% of the overall revenue – in 2016. Germany is a dominant market in Europe. Going forward, the rising application of end-point authentication systems in electric and hybrid vehicles, which are witnessing increasing sales, are predicted to bring about further growth in the market.
North America trails Europe in terms of revenue in the global automotive end-point authentication market. It generated 25.0% of the revenue in 2016. The U.S. is a leading contributor in the region and is also considered a crucial market in the entire world.
Asia Pacific comes in a third place vis-à-vis revenue in the global automotive end-point authentication market. In 2016, it generated about 20% of the total revenues. China is the forefront of driving the market in the Asia Pacific region on account of a massive resource and technological capabilities in the automotive sector. Further, ever-increasing demand for passenger vehicles in the fast-expanding emerging economies of Indian and China is also serving to bolster the automotive end-point authentication market in Asia Pacific.
In contrast to the market for automotive end-point authentication in Asia Pacific, North America, and Europe, the market in the Middle East and Africa and Latin America is expected to see moderate demand in the upcoming years. Growing investments in the automotive sector and demand for advanced driver assistance systems in vehicles are the primary growth drivers in the region.
Some of the prominent participants in the global automotive end-point authentication market are Garmin Ltd., Continental AG, Samsung Electronics Co., Fujitsu Ltd., Hitachi Ltd., Ltd., Symantec Corporation, VOXX International Corporation, Valeo S.A., Synaptics Incorporated, and Sonavation, Inc.
Chapter 1. Preface
1.1. Research Scope
1.2. Market Segmentation
1.3. Research Objectives
1.4. Key Questions Answered
Chapter 2. Assumptions and Research Methodology
2.1. Report Assumptions
2.2. Acronyms Used
2.3. Research Methodology
Chapter 3. Executive Summary
3.1. Global Automotive End-Point Authentication Market Snapshot
3.2. Market Opportunity Map
Chapter 4. Market Dynamics
4.1. Overview
4.2. Key Trends Analysis
4.3. Drivers and Restraints Snapshot Analysis
4.3.1. Drivers
4.3.2. Restraints
4.4. Opportunity Analysis
4.5. Company Market Share Analysis
4.6. Competitive Strategies Adopted by Major Players
4.7. Market Attractiveness Analysis
Chapter 5. Automotive End-Point Authentication Market Analysis, by Authentication Type
5.1. Introduction
5.2. Global Automotive End-Point Authentication Market Value Share Analysis, By Authentication Type
5.3. Global Automotive End-Point Authentication Market Revenue and Forecast, By Authentication Type
5.4. Global Smart Phone Application Market Revenue and Forecast, By Region
5.5. Global Wearables Market Revenue and Forecast, By Region
5.6. Global Biometric Vehicle Access Market Revenue and Forecast, By Region
5.7. Smart Phone Application
5.8. Wearables
5.9. Biometric Vehicle Access
Chapter 6. Automotive End-Point Authentication Market Analysis, by Vehicle Type
6.1. Introduction
6.2. Global Automotive End-Point Authentication Market Value Share Analysis, By Vehicle Type
6.3. Global Automotive End-Point Authentication Market Revenue and Forecast, By Vehicle Type
6.4. Global Conventional Vehicles Market Revenue and Forecast, By Region
6.5. Global Hybrid and Electric Vehicles Market Revenue and Forecast, By Region
6.6. Conventional Vehicles
6.7. Hybrid and Electric Vehicles
Chapter 7. Automotive End-Point Authentication Market Analysis, by Connectivity Type
7.1. Introduction
7.2. Global Automotive End-Point Authentication Market Value Share Analysis, By Connectivity Type
7.3. Global Automotive End-Point Authentication Market Revenue and Forecast, By Connectivity Type
7.4. Global Wi-Fi Market Revenue and Forecast, By Region
7.5. Global Bluetooth Market Revenue and Forecast, By Region
7.6. Global Cellular Network Market Revenue and Forecast, By Region
7.7. Wi-Fi
7.8. Bluetooth
7.9. Cellular Network
Chapter 8. Automotive End-Point Authentication Market Analysis, by Geography
8.1. Geographical Scenario
8.2. Global Automotive End-Point Authentication Market Value Share Analysis, by Geography
8.3. Global Automotive End-Point Authentication Market Revenue and Forecast, by Geography
Chapter 9. North America Automotive End-Point Authentication Market Analysis
9.1. North America Automotive End-Point Authentication Market Value Share Analysis, by Authentication Type
9.2. North America Automotive End-Point Authentication Market Revenue and Forecast, by Authentication Type
9.3. North America Automotive End-Point Authentication Market Value Share Analysis, by Vehicle Type
9.4. North America Automotive End-Point Authentication Market Revenue and Forecast, by Vehicle Type
9.5. North America Automotive End-Point Authentication Market Value Share Analysis, by Connectivity Type
9.6. North America Automotive End-Point Authentication Market Revenue and Forecast, by Connectivity Type
9.7. North America Automotive End-Point Authentication Market Revenue and Forecast, by Country
9.8. U.S. Automotive End-Point Authentication Market Analysis
9.9. Canada Automotive End-Point Authentication Market Analysis
9.10. Mexico Automotive End-Point Authentication Market Analysis
Chapter 10. Europe Automotive End-Point Authentication Market Analysis
10.1. Europe Automotive End-Point Authentication Market Value Share Analysis, by Authentication Type
10.2. Europe Automotive End-Point Authentication Market Revenue and Forecast, by Authentication Type
10.3. Europe Automotive End-Point Authentication Market Value Share Analysis, by Vehicle Type
10.4. Europe Automotive End-Point Authentication Market Revenue and Forecast, by Vehicle Type
10.5. Europe Automotive End-Point Authentication Market Value Share Analysis, by Connectivity Type
10.6. Europe Automotive End-Point Authentication Market Revenue and Forecast, by Connectivity Type
10.7. Europe Automotive End-Point Authentication Market Revenue and Forecast, by Country
10.8. Germany Automotive End-Point Authentication Market Analysis
10.9. U.K. Automotive End-Point Authentication Market Analysis
10.10. France Automotive End-Point Authentication Market Analysis
10.11. Italy Automotive End-Point Authentication Market Analysis
10.12. Rest of Europe Automotive End-Point Authentication Market Analysis
Chapter 11. Asia Pacific Automotive End-Point Authentication Market Analysis
11.1. Asia Pacific Automotive End-Point Authentication Market Value Share Analysis, by Authentication Type
11.2. Asia Pacific Automotive End-Point Authentication Market Revenue and Forecast, by Authentication Type
11.3. Asia Pacific Automotive End-Point Authentication Market Value Share Analysis, by Vehicle Type
11.5. Asia Pacific Automotive End-Point Authentication Market Revenue and Forecast, by Vehicle Type
11.6. Asia Pacific Automotive End-Point Authentication Market Value Share Analysis, by Connectivity Type
11.7. Asia Pacific Automotive End-Point Authentication Market Revenue and Forecast, by Connectivity Type
11.8. Asia Pacific Automotive End-Point Authentication Market Revenue and Forecast, by Country
11.9. China Automotive End-Point Authentication Market Analysis
11.10. India Automotive End-Point Authentication Market Analysis
11.11. Japan Automotive End-Point Authentication Market Analysis
11.12. Rest of Asia Pacific Automotive End-Point Authentication Market Analysis
Chapter 12. Middle East and Africa Automotive End-Point Authentication Market Analysis
12.1. Middle East and Africa Automotive End-Point Authentication Market Value Share Analysis, by Authentication Type
12.2. Middle East and Africa Automotive End-Point Authentication Market Revenue and Forecast, by Authentication Type
12.3. Middle East and Africa Automotive End-Point Authentication Market Value Share Analysis, by Vehicle Type
12.4. Middle East and Africa Automotive End-Point Authentication Market Revenue and Forecast, by Vehicle Type
12.5. Middle East and Africa Automotive End-Point Authentication Market Value Share Analysis, by Connectivity Type
12.6. Middle East and Africa Automotive End-Point Authentication Market Revenue and Forecast, by Connectivity Type
12.7. Middle East and Africa Automotive End-Point Authentication Market Revenue and Forecast, by Country
12.8. Iran Automotive End-Point Authentication Market Analysis
12.9. South Africa Automotive End-Point Authentication Market Analysis
12.10. Rest of Middle East and Africa Automotive End-Point Authentication Market Analysis
Chapter 13. Latin America Automotive End-Point Authentication Market Analysis
13.1. Latin America Automotive End-Point Authentication Market Value Share Analysis, by Authentication Type
13.2. Latin America Automotive End-Point Authentication Market Revenue and Forecast, by Authentication Type
13.3. Latin America Automotive End-Point Authentication Market Value Share Analysis, by Vehicle Type
13.4. Latin America Automotive End-Point Authentication Market Revenue and Forecast, by Vehicle Type
13.5. Latin America Automotive End-Point Authentication Market Value Share Analysis, by Connectivity Type
13.6. Latin America Automotive End-Point Authentication Market Revenue and Forecast, by Connectivity Type
13.7. Latin America Automotive End-Point Authentication Market Revenue and Forecast, by Country
13.8. Brazil Automotive End-Point Authentication Market Analysis
13.9. Argentina Automotive End-Point Authentication Market Analysis
13.10. Rest of Latin America Automotive End-Point Authentication Market Analysis
Chapter 14. Company Profiles
14.1 Continental AG
14.1.1. Company Details (HQ, Foundation Year, Employee Strength)
14.1.2. Market Presence, By Segment and Geography
14.1.3. Strategic Overview
14.1.4. SWOT analysis
14.1.5. Strategic Overview
14.2 Garmin Ltd.
14.2.1. Company Details (HQ, Foundation Year, Employee Strength)
14.2.2. Market Presence, By Segment and Geography
1.2.3. Strategic Overview
14.2.4. SWOT analysis
14.2.5. Strategic Overview
14.3 Fujitsu Ltd.
14.3.1. Company Details (HQ, Foundation Year, Employee Strength)
14.3.2. Market Presence, By Segment and Geography
14.3.3. Strategic Overview
14.3.4. SWOT analysis
14.3.5. Strategic Overview
14.4 Hitachi Ltd.
14.4.1. Company Details (HQ, Foundation Year, Employee Strength)
14.4.2. Market Presence, By Segment and Geography
14.4.3. Strategic Overview
14.4.4. SWOT analysis
14.4.5. Strategic Overview
14.5 Samsung Electronics Co. Ltd.
14.5.1. Company Details (HQ, Foundation Year, Employee Strength)
14.5.2. Market Presence, By Segment and Geography
14.5.3. Strategic Overview
14.5.4. SWOT analysis
14.5.5. Strategic Overview
14.6 VOXX International Corporation
14.6.1. Company Details (HQ, Foundation Year, Employee Strength)
14.6.2. Market Presence, By Segment and Geography
14.6.3. Strategic Overview
14.6.4. SWOT analysis
14.6.5. Strategic Overview
14.7 Symantec Corporation
14.7.1. Company Details (HQ, Foundation Year, Employee Strength)
14.7.2. Market Presence, By Segment and Geography
14.7.3. Strategic Overview
14.7.4. SWOT analysis
14.7.5. Strategic Overview
14.8 Synaptics Incorporated
14.8.1. Company Details (HQ, Foundation Year, Employee Strength)
14.8.2. Market Presence, By Segment and Geography
14.8.3. Strategic Overview
14.8.4. SWOT analysis
14.8.5. Strategic Overview
14.9 Valeo S.A.
14.9.1. Company Details (HQ, Foundation Year, Employee Strength)
14.9.2. Market Presence, By Segment and Geography
14.9.3. Strategic Overview
14.9.4. SWOT analysis
14.9.5. Strategic Overview
14.10 Sonavation, Inc.
14.10.1. Company Details (HQ, Foundation Year, Employee Strength)
14.10.2. Market Presence, By Segment and Geography
14.10.3. Strategic Overview
14.10.4. SWOT analysis
14.10.5. Strategic Overview
List of Tables
Table 1 : Global Automotive End-Point Authentication Market Revenue (US$ Mn) and Forecast, By Authentication Type, 2016–2025
Table 2 : Global Smart Phone Application Market Revenue (US$ Mn) and Forecast, By Region, 2016–2025
Table 3 : Global Wearables Application Market Revenue (US$ Mn) and Forecast, By Region, 2016–2025
Table 4 : Global Biometric Vehicle Access Market Revenue (US$ Mn) and Forecast, By Region, 2016–2025
Table 5 : Global Automotive End-Point Authentication Market Revenue (US$ Mn) and Forecast, By Vehicle Type, 2016–2025
Table 6 : Global Conventional Vehicles Market Revenue (US$ Mn) and Forecast, By Region, 2016–2025
Table 7 : Global Hybrid and Electric Vehicles Market Revenue (US$ Mn) and Forecast, By Region, 2016–2025
Table 8 : Global Automotive End-Point Authentication Market Revenue (US$ Mn) and Forecast, By Connectivity Type, 2016–2025
Table 9 : Global Wi-Fi Market Revenue (US$ Mn) and Forecast, By Region, 2016–2025
Table 10 : Global Bluetooth Market Revenue (US$ Mn) and Forecast, By Region, 2016–2025
Table 11 : Global Cellular Network Market Revenue (US$ Mn) and Forecast, By Region, 2016–2025
Table 12 : Global Automotive End-Point Authentication Market Revenue (US$ Mn) and Forecast, by Geography, 2016–2025
Table 13 : North America Automotive End-Point Authentication Market Revenue (US$ Mn) and Forecast, By Authentication Type, 2016–2025
Table 14 : North America Automotive End-Point Authentication Market Revenue (US$ Mn) and Forecast, By Vehicle Type, 2016–2025
Table 15 : North America Automotive End-Point Authentication Market Revenue (US$ Mn) and Forecast, By Connectivity Type, 2016–2025
Table 16 : North America Automotive End-Point Authentication Market Revenue (US$ Mn) and Forecast, By Country, 2016–2025
Table 17 : Europe Automotive End-Point Authentication Market Revenue (US$ Mn) and Forecast, By Authentication Type, 2016–2025
Table 18 : Europe Automotive End-Point Authentication Market Revenue (US$ Mn) and Forecast, By Vehicle Type, 2016–2025
Table 19 : Europe Automotive End-Point Authentication Market Revenue (US$ Mn) and Forecast, By Connectivity Type, 2016–2025
Table 20 : Europe Automotive End-Point Authentication Market Revenue (US$ Mn) and Forecast, By Country, 2016–2025
Table 21 : Asia Pacific Automotive End-Point Authentication Market Revenue (US$ Mn) and Forecast, By Authentication Type, 2016–2025
Table 22 : Asia Pacific Automotive End-Point Authentication Market Revenue (US$ Mn) and Forecast, By Vehicle Type, 2016–2025
Table 23 : Asia Pacific Automotive End-Point Authentication Market Revenue (US$ Mn) and Forecast, By Connectivity Type, 2016–2025
Table 24 : Asia Pacific Automotive End-Point Authentication Market Revenue (US$ Mn) and Forecast, By Country, 2016–2025
Table 25 : Middle-East and Africa (MEA) Automotive End-Point Authentication Market Revenue (US$ Mn) and Forecast, By Authentication Type, 2016–2025
Table 26 : Middle-East and Africa (MEA) Automotive End-Point Authentication Market Revenue (US$ Mn) and Forecast, By Vehicle Type, 2016–2025
Table 27 : Asia Pacific Automotive End-Point Authentication Market Revenue (US$ Mn) and Forecast, By Connectivity Type, 2016–2025
Table 28 : Middle-East and Africa (MEA) Automotive End-Point Authentication Market Revenue (US$ Mn) and Forecast, By Country, 2016–2025
Table 29 : Latin America Automotive End-Point Authentication Market Revenue (US$ Mn) and Forecast, By Authentication Type, 2016–2025
Table 30 : Latin America Automotive End-Point Authentication Market Revenue (US$ Mn) and Forecast, By Vehicle Type, 2016–2025
Table 31 : Latin America Automotive End-Point Authentication Market Revenue (US$ Mn) and Forecast, By Connectivity Type, 2016–2025
Table 32 : Latin America Automotive End-Point Authentication Market Revenue (US$ Mn) and Forecast, By Country, 2016–2025
List of Figures
Figure 1 : Research Methodology
Figure 2 : Executive Summary
Figure 3 : Market Opportunity Map
Figure 4 : Drivers and Restraints Snapshot Analysis
Figure 5 : Opportunity Analysis
Figure 6 : Global Automotive End-Point Authentication Market Share Analysis, By Company (2016)
Figure 7 : Market Attractiveness Analysis, by Vehicle Type, 2016
Figure 8 : Global Automotive End-Point Authentication Market Value Share Analysis, By Authentication Type, 2016 and 2025
Figure 9 : Global Smart Phone Application Market Revenue (US$ Mn), 2016 – 2025
Figure 10 Global Wearables Market Revenue (US$ Mn), 2016 – 2025
Figure 11 : Global Biometric Vehicle Access Market Revenue (US$ Mn), 2016 – 2025
Figure 12 : Global Automotive End-Point Authentication Market Value Share Analysis, By Vehicle Type, 2016 and 2025
Figure 13 : Global Conventional Vehicles Market Revenue (US$ Mn), 2016 – 2025
Figure 14 : Global Hybrid and Electric Vehicles Market Revenue (US$ Mn), 2016 – 2025
Figure 15 : Global Automotive End-Point Authentication Market Value Share Analysis, By Connectivity Type, 2016 and 2025
Figure 16 : Global Wi-Fi Market Revenue (US$ Mn), 2016 – 2025
Figure 17 : Global Bluetooth Market Revenue (US$ Mn), 2016 – 2025
Figure 18 : Global Cellular Network Market Revenue (US$ Mn), 2016 – 2025
Figure 19 : Geographical Scenario
Figure 20 : Global Automotive End-Point Authentication Market Value Share Analysis By Geography, 2016 and 2025
Figure 21 : North America Automotive End-Point Authentication Market Value Share Analysis, By Authentication Type, 2016 and 2025
Figure 22 : North America Automotive End-Point Authentication Market Value Share Analysis, By Vehicle Type, 2016 and 2025
Figure 23 : North America Automotive End-Point Authentication Market Value Share Analysis, By Connectivity Type, 2016 and 2025
Figure 24 : North America Market Value Share Analysis By Country, 2016 and 2025
Figure 25 : U.S. Automotive End-Point Authentication Market Revenue (US$ Mn), 2016 – 2025
Figure 26 : Canada Automotive End-Point Authentication Market Revenue (US$ Mn), 2016 – 2025
Figure 27 : Mexico Automotive End-Point Authentication Market Revenue (US$ Mn), 2016 – 2025
Figure 28 : Europe Automotive End-Point Authentication Market Value Share Analysis, By Authentication Type, 2016 and 2025
Figure 29 : Europe Automotive End-Point Authentication Market Value Share Analysis, By Vehicle Type, 2016 and 2025
Figure 30 : Europe Automotive End-Point Authentication Market Value Share Analysis, By Connectivity Type, 2016 and 2025
Figure 31 : Europe Market Value Share Analysis By Country, 2016 and 2025
Figure 32 : Germany Automotive End-Point Authentication Market Revenue (US$ Mn), 2016 – 2025
Figure 33 : U.K. Automotive End-Point Authentication Market Revenue (US$ Mn), 2016 – 2025
Figure 34 : France Automotive End-Point Authentication Market Revenue (US$ Mn), 2016 – 2025
Figure 35 : Italy Automotive End-Point Authentication Market Revenue (US$ Mn), 2016 – 2025
Figure 36 : Rest of Europe Automotive End-Point Authentication Market Revenue (US$ Mn), 2016 – 2025
Figure 37 : Asia Pacific Automotive End-Point Authentication Market Value Share Analysis, By Authentication Type, 2016 and 2025
Figure 38 : Asia Pacific Automotive End-Point Authentication Market Value Share Analysis, By Vehicle Type, 2016 and 2025
Figure 39 : Asia Pacific Automotive End-Point Authentication Market Value Share Analysis, By Connectivity Type, 2016 and 2025
Figure 40 : Asia Pacific Market Value Share Analysis By Country, 2016 and 2025
Figure 41 : China Automotive End-Point Authentication Market Revenue (US$ Mn), 2016 – 2025
Figure 42 : India Automotive End-Point Authentication Market Revenue (US$ Mn), 2016 – 2025
Figure 43 : Japan Automotive End-Point Authentication Market Revenue (US$ Mn), 2016 – 2025
Figure 44 : Rest of Asia Pacific Automotive End-Point Authentication Market Revenue (US$ Mn), 2016 – 2025
Figure 45 : Middle-East and Africa (MEA) Automotive End-Point Authentication Market Value Share Analysis, By Authentication Type, 2016 and 2025
Figure 46 : Middle-East and Africa (MEA) Automotive End-Point Authentication Market Value Share Analysis, By Vehicle Type, 2016 and 2025
Figure 47 : Middle-East and Africa (MEA) Automotive End-Point Authentication Market Value Share Analysis, By Connectivity Type, 2016 and 2025
Figure 48 : Middle-East and Africa (MEA) Market Value Share Analysis By Country, 2016 and 2025
Figure 49 : Iran Automotive End-Point Authentication Market Revenue (US$ Mn), 2016 – 2025
Figure 50 : South Africa Automotive End-Point Authentication Market Revenue (US$ Mn), 2016 – 2025
Figure 51 : Rest of Middle-East and Africa (MEA) Automotive End-Point Authentication Market Revenue (US$ Mn), 2016 – 2025
Figure 52 : Latin America Automotive End-Point Authentication Market Value Share Analysis, By Authentication Type, 2016 and 2025
Figure 53 : Latin America Automotive End-Point Authentication Market Value Share Analysis, By Vehicle Type, 2016 and 2025
Figure 54 : Latin America Automotive End-Point Authentication Market Value Share Analysis, By Connectivity Type, 2016 and 2025
Figure 55 : Latin America Market Value Share Analysis By Country, 2016 and 2025
Figure 56 : Brazil Automotive End-Point Authentication Market Revenue (US$ Mn), 2016 – 2025
Figure 57 : Argentina Automotive End-Point Authentication Market Revenue (US$ Mn), 2016 – 2025
Figure 58 : Rest of Latin America Automotive End-Point Authentication Market Revenue (US$ Mn), 2016 – 2025
Figure 59 : Continental AG Revenue (US$ Mn) & Y-o-Y Growth (%), 2013–2015
Figure 60 : Garmin Ltd. Revenue (US$ Mn) & Y-o-Y Growth (%), 2014–2016
Figure 61 : Fujitsu Ltd. Revenue By Region (%), 2016
Figure 62 : Fujitsu Ltd. Revenue (US$ Mn) & Y-o-Y Growth (%), 2014–2016
Figure 63 : Hitachi Ltd. Revenue By Region (%), 2016
Figure 64 : Hitachi Ltd. Revenue (US$ Mn) & Y-o-Y Growth (%), 2014–2016
Figure 65 : Samsung Electronics Co. Ltd. Revenue (US$ Mn) & Y-o-Y Growth (%), 2014–2016
Figure 66 : VOXX International Corporation Revenue (US$ Mn) & Y-o-Y Growth (%), 2014–2016
Figure 67 : Symantec Corporation Revenue By Region (%), 2016
Figure 68 : Symantec Corporation Revenue (US$ Mn) & Y-o-Y Growth (%), 2014–2016
Figure 69 : Synaptics Incorporated Revenue By Region (%), 2016
Figure 70 : Synaptics Incorporated Revenue (US$ Mn) & Y-o-Y Growth (%), 2014–2016
Figure 71 : Valeo S.A. Revenue (US$ Mn) & Y-o-Y Growth (%), 2014–2016
Copyright © Transparency Market Research, Inc. All Rights reserved
Trust Online

Automotive End-Point Authentication Market