
Reports
Reports
Automated Marine Debris Collection Equipment Market: Snapshot
The issue of marine debris is becoming more complex and bigger with each passing year. This, combined with the poor infrastructure for marine debris collection in Mediterranean countries and advancement in the understanding of how marine debris impact the environment and marine ecosystems are driving developments and innovations in the field of marine debris collection equipment. In this scenario, the move from the tedious and slow varieties of manual equipment to the swifter and more efficient automatic ones seems inevitable.
This market study provides an understanding and potential adoption of a conceptualized automated marine debris collection equipment across the Mediterranean region. The concept equipment is an unmanned or remotely controlled system (compact boat) designed to work in a self-contained environment, with the option of treating debris on-board or off shore. The system is typically expected to be capable of substituting the conventional hand-pick and mechanical litter collection methods. Transparency Market Research states that the market for such an automated marine debris collection equipment is anticipated to attain an average adoption level of 8% in the early year (2018) of introduction, reaching 10.2% by 2024.
This expected adoption level is measured for the estimated total accessible market in the Mediterranean region, comprising of users across segments such as government and municipality, fisheries, hospitality, others (NGOs, etc.). The anticipated level of adoption across these sectors is examined for the period between 2018 and 2024.
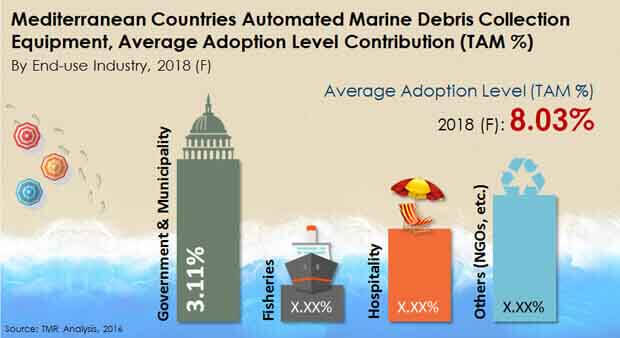
Importance of Cleaner Shores in Attracting Tourists to Drive Adoption in Hospitality Sector
Among the different targeted end-users of automated marine debris collection equipment, the hospitality and government and municipality sectors are expected to be the most lucrative ones, considering the direct relevance of clean environment (shores) for the hospitality business and the social stability of coastal countries. Owing to the same reasons, countries with flourishing hospitality sector and high pace of urbanization are also identified as potential markets for near term market success of automated marine debris collection equipment. The government and municipality end-use segment is anticipated to attain average adoption level contribution of 3.11% in 2018.
Availability of Funds and Proactive Initiatives to Help France Take Lead
Countries such as France, Italy and Spain in the Mediterranean are considered to be the potential early adopters of automated marine debris collection equipment as these currently have access to a larger share in funds provided by the Mediterranean Action Plan (initiated by United Nations Environment Program). Likewise, programs such as the Environment LIFE program by European Commission and dedicated government efforts are expected to further drive the market potential for automated marine debris collection equipment in these countries over the said period.
In 2018, France, with a projected adoption level of 16.85% (TAM %), is anticipated to largely dominate the Mediterranean automatic marine debris collection equipment market followed by countries including Italy, Croatia and Spain. The increasing marine litter throughout the coastline and various coastal clean-up project and initiatives undertaken across these countries on a regular basis will lay the foundation for adoption of the more effective automated marine debris collection equipment across these countries. Apart from these countries Greece and Morocco are also anticipated to have significant adoption level for such equipment.
There are no companies in the market who have tried their luck in the field of automated marine debris collection equipment so far. However, certain companies manufacturing manual debris collection boats are expected to be the potential contenders in the market in the near future. Some of the chief companies operating in the manual debris collection equipment market are United Marine International, Liverpool Water Witch Marine and Engineering Co. Ltd., U.S.?based Elastec, and Harbor Clean.
Chapter 1 Preface
1.1 Report Scope and Market Segmentation
1.2 Research Highlights
Chapter 2 Assumptions and Research Methodology
Chapter 3 Executive Summary
Chapter 4 Market Overview
4.1 Introduction
4.1.1 Product Definition
4.1.2 Industry Evolution / Development
4.2 Mediterranean Countries Marine Debris Market Overview
4.3 Key Market Indicators
4.3.1 Mediterranean Countries Waste Generation
4.3.2 Automated Marine Debris Collection Equipment Usage Targets
4.4 Market Dynamics
4.4.1 Drivers
4.4.2 Restraints
4.4.3 Opportunities
4.5 Mediterranean Countries Automated Marine Debris Collection Equipment Market Analysis and Forecasts
4.5.1 Current Market for Marine Debris Collection Systems
4.5.2 Sales Projections (Units), 2018 – 2024
4.6 Product Concept Testing Analysis
Chapter 5 Key Trends
5.1 Key Projects with their Focus Area
5.2 Italy, France, Spain and Rest of Mediterranean
5.2.1 Israel
5.2.2 Croatia
5.2.3 Greece
5.2.4 Morocco
Chapter 6 Mediterranean Countries Automated Marine Debris Collection Equipment Market Analysis and Forecast, 2018 – 2024
6.1 Key Findings
6.2 Automated Marine Debris Collection Equipment Market Analysis and Forecast, by End-use Industry
6.2.1 Government and Municipality, 2018 – 2024
6.2.2 Fisheries Market, 2018 – 2024
6.2.3 Hospitality Market, 2018 – 2024
6.2.4 Others (NGO, etc.), 2018 – 2024
Chapter 7 Italy Automated Marine Debris Collection Equipment Market Analysis and Forecast, 2018 – 2024
7.1 Key Findings
7.2 Automated Marine Debris Collection Equipment Market Analysis and Forecast, by End-use Industry
7.2.1 Government and Municipality, 2018 – 2024
7.2.2 Fisheries Market, 2018 – 2024
7.2.3 Hospitality Market, 2018 – 2024
7.2.4 Others (NGO, etc.), 2018 – 2024
Chapter 8 France Automated Marine Debris Collection Equipment Market Analysis and Forecast, 2018 – 2024
8.1 Key Findings
8.2 Automated Marine Debris Collection Equipment Market Analysis and Forecast, by End-use Industry
8.2.1 Government and Municipality, 2018 – 2024
8.2.2 Fisheries Market, 2018 – 2024
8.2.3 Hospitality Market, 2018 – 2024
8.2.4 Others (NGO, etc.), 2018 – 2024
Chapter 9 Spain Automated Marine Debris Collection Equipment Market Analysis and Forecast, 2018 – 2024
9.1 Key Findings
9.2 Automated Marine Debris Collection Equipment Market Analysis and Forecast, by End-use Industry
9.2.1 Government and Municipality, 2018 – 2024
9.2.2 Fisheries Market, 2018 – 2024
9.2.3 Hospitality Market, 2018 – 2024
9.2.4 Others (NGO, etc.), 2018 – 2024
Chapter 10 Morocco Automated Marine Debris Collection Equipment Market Analysis and Forecast, 2018 – 2024
10.1 Key Findings
10.2 Automated Marine Debris Collection Equipment Market Analysis and Forecast, by End-use Industry
10.2.1 Government and Municipality, 2018 – 2024
10.2.2 Fisheries Market, 2018 – 2024
10.2.3 Hospitality Market, 2018 – 2024
10.2.4 Others (NGO, etc.), 2018 – 2024
Chapter 11 Cyprus Automated Marine Debris Collection Equipment Market Analysis and Forecast, 2018 – 2024
11.1 Key Findings
11.2 Automated Marine Debris Collection Equipment Market Analysis and Forecast, by End-use Industry
11.2.1 Government and Municipality, 2018 – 2024
11.2.2 Fisheries Market, 2018 – 2024
11.2.3 Hospitality Market, 2018 – 2024
11.2.4 Others (NGO, etc.), 2018 – 2024
Chapter 12 Israel Automated Marine Debris Collection Equipment Market Analysis and Forecast, 2018 – 2024
12.1 Key Findings
12.2 Automated Marine Debris Collection Equipment Market Analysis and Forecast, by End-use Industry
12.2.1 Government and Municipality, 2018 – 2024
12.2.2 Fisheries Market, 2018 – 2024
12.2.3 Hospitality Market, 2018 – 2024
12.2.4 Others (NGO, etc.), 2018 – 2024
Chapter 13 Croatia Automated Marine Debris Collection Equipment Market Analysis and Forecast, 2018 – 2024
13.1 Key Findings
13.2 Automated Marine Debris Collection Equipment Market Analysis and Forecast, by End-use Industry
13.2.1 Government and Municipality, 2018 – 2024
13.2.2 Fisheries Market, 2018 – 2024
13.2.3 Hospitality Market, 2018 – 2024
13.2.4 Others (NGO, etc.), 2018 – 2024
Chapter 14 Greece Automated Marine Debris Collection Equipment Market Analysis and Forecast, 2018 – 2024
14.1 Key Findings
14.2 Automated Marine Debris Collection Equipment Market Analysis and Forecast, by End-use Industry
14.2.1 Government and Municipality, 2018 – 2024
14.2.2 Fisheries Market, 2018 – 2024
14.2.3 Hospitality Market, 2018 – 2024
14.2.4 Others (NGO, etc.), 2018 – 2024
Chapter 15 Rest of Mediterranean Automated Marine Debris Collection Equipment Market Analysis and Forecast, 2018 - 2024
15.1 Key Findings
15.2 Automated Marine Debris Collection Equipment Market Analysis and Forecast, by End-use Industry
15.2.1 Government and Municipality, 2018 - 2024
15.2.2 Fisheries Market, 2018 – 2024
15.2.3 Hospitality Market, 2018 – 2024
15.2.4 Others (NGO, etc.), 2018 – 2024
List of Tables
Table 01 Current Market for Marine Debris Collection Systems
Table 02 Sales Projections (in Units), 2018 – 2024
Table 03 Mediterranean Countries Automated Marine Debris Collection Equipment, Adoption Level (TAM %), 2018–2024
Table 04 Automated Marine Debris Collection Equipment, Average Adoption Level Contribution (TAM %), by End-use Industry, 2018–2024
Table 05 Italy Automated Marine Debris Collection Equipment, Adoption Level Contribution (TAM %), by End-use Industry, 2018–2024
Table 06 France Automated Marine Debris Collection Equipment, Adoption Level Contribution (TAM %), by End-use Industry, 2018–2024
Table 07 Spain Automated Marine Debris Collection Equipment, Adoption Level Contribution (TAM %), by End-use Industry, 2018–2024
Table 08 Morocco Automated Marine Debris Collection Equipment, Adoption Level Contribution (TAM %), by End-use Industry, 2018–2024
Table 09 Cyprus Automated Marine Debris Collection Equipment, Adoption Level Contribution (TAM %), by End-use Industry, 2018–2024
Table 10 Israel Automated Marine Debris Collection Equipment, Adoption Level Contribution (TAM %), by End-use Industry, 2018–2024
Table 11 Croatia Automated Marine Debris Collection Equipment, Adoption Level Contribution (TAM %), by End-use Industry, 2018–2024
Table 12 Greece Automated Marine Debris Collection Equipment, Adoption Level Contribution (TAM %), by End-use Industry, 2018–2024
Table 13 Israel Automated Marine Debris Collection Equipment, Adoption Level Contribution (TAM %), by End-use Industry, 2018–2024
List of Figures
Figure 1 Automated Marine Debris Collection Equipment Industry Evolution
Figure 2 Automated Marine Debris Collection Equipment Usage Targets
Figure 3 Automated Marine Debris Collection Equipment Attractiveness Analysis by End-use Industry
Copyright © Transparency Market Research, Inc. All Rights reserved
Trust Online

Automated Marine Debris Collection Equipment Market Outlook 2024