
Reports
Reports
Analysts’ Viewpoint on Aerated Autoclaved Concrete (AAC) Market Scenario
Autoclaved aerated concrete (AAC) has achieved global recognition due to its low environmental impact and initiatives by governments to promote the construction of green buildings. AAC is a highly preferred, lightweight, precast sustainable building material. Aerated concrete offers a unique combination of low weight, strength, and durability as compared to traditional clay bricks. Overall increase in construction and infrastructure-related activities worldwide has fueled the demand for residential, commercial, and industrial construction, leading to consistent expansion of the building materials industry. Energy consumed for the production of AAC is less as compared to that of other building materials. AAC consumes approximately 50% and 20% less energy as compared to concrete and CMUs, respectively. AAC reduces heating and cooling requirements by up to 30% due to its thermal insulation properties, resulting in continued financial benefits during the life of the construction. AAC is the most energy- and resource-efficient building material. This is expected to drive the AAC market during the forecast period.
Autoclaved aerated concrete (AAC), also termed as autoclaved cellular concrete (ACC) or autoclaved lightweight concrete (ALC), is a newly adopted lightweight precast building material. The product has been in use since 1923; however, it has gained popularity in the last few years due to its ability to provide rigid structure, insulation, fire-resistance, and economy of construction. Its products are used as eco-friendly green building materials. AAC is manufactured by using fly ash, which is an unavoidable waste of thermal power plants and is available in abundance.
Properties of AAC, such as eco-friendliness, lightweight, good thermal and fire insulation, sound absorption, and seismic resistance, make it easier and faster to transport, place, and construct infrastructure. Therefore, AAC is being extensively used in construction and building activities and utilized as a building material in all construction-related activities of residential, commercial, and other sectors.
Aerated concrete is a currently a highly preferred, sustainable building material and it is gaining traction worldwide. Aerated concrete is a cellular, porous, and ultra-weight concrete product. It weighs as less as one-fifth of ordinary concrete. It offers a unique combination of low weight, strength, and durability as compared to traditional clay bricks and hence, it is preferred more than traditional concrete. The global demand for aerated autoclaved concrete (AAC) market is projected to grow at decent growth rate from 2022 to 2031, due to its increasing adoption in sustainable building and shift toward sustainable sourcing. Increased emphasis on environmental sustainability is expected to create significant opportunity for the aerated autoclaved concrete (AAC) market during the forecast period.
Demand for building materials is primarily driven by expansion of the construction sector globally. Overall increase in construction and infrastructure-related activities due to the major shift from agriculture-based economy to industry-based economy has resulted in rise in demand for residential, commercial, and industrial construction leading to consistent expansion in the building materials industry.
Demand for more sustainable, cost-efficient and energy-efficient building materials that replace traditional concrete is on the rise, owing to the recovery of the economy in Europe, rapid urbanization in countries such as India and China, and increasing disposable income worldwide. Furthermore, macroeconomic factors such as GDP growth in Europe, gradual recovery in construction expenditure across residential and non-residential sectors, and anticipated expansion of the real-estate sector supported by government initiatives of providing affordable housing are expected to drive the AAC market for its desired qualities in sustainable building.
Traditional clay bricks continue to dominate the market share for different walling material. This is attributed to lack of awareness about AAC bricks. Hence, builders, contractors, and construction professionals continue using traditional building materials, which hold significant share of the market. Currently, the market penetration of different types of aerated autoclaved concrete (AAC) products is low; however, this also presents future business opportunities in the aerated autoclaved concrete (AAC) market to boost the use AAC as walling materials.
Ever-increasing population in India has made it difficult for people to afford houses at reasonable prices. This prompted the Government of India to introduce policies in favor of those who cannot afford houses. Under one such scheme, ‘Pradhan Mantri Awas Yojana’, the government aims to construct two crore (20 million) houses in India, in three phases, till 2022.
Demand for affordable housing is expected to remain robust, supported by a growing population, young demographic profile, shift toward nuclear families and rapid urbanization. AAC building material offers significant potential for growth and to cater to the demand for affordable building material, owing to its low cost as compared to traditional building material.
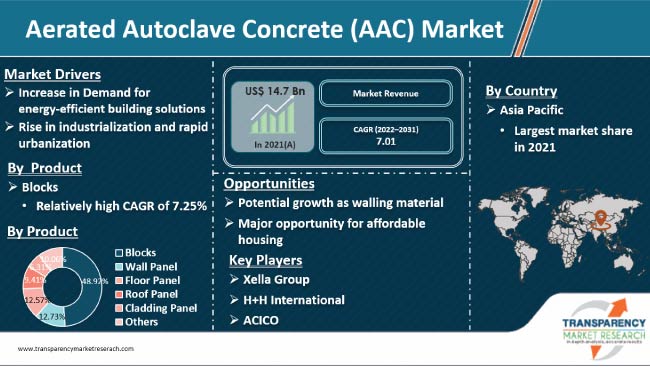
AAC blocks is a highly attractive segment, and it is expanding at a significant rate. Aerated autoclaved concrete blocks are used as a primary building material for internal as well as external construction applications. Therefore, the blocks segment dominates the market. This trend is expected to continue during the forecast period. The segment accounted for 48.92% share of the global market in 2021. The segment is estimated to grow at an above average CAGR of 7.25% during the forecast period.
After concrete aerated blocks, the panels (especially wall panels) segment held a major share due to their excellent strength, high thermal insulation, and fire resistance. AAC panels including wall, floor, and roof panels have been replacing traditional concrete floor. Panels are successfully being adopted all over the world due to their ability to offer speedy, cost-effective, and sustainable construction.
The residential sector, because of energy-efficiency standards enforced by government authorities especially in Europe, mandates the use of AAC blocks, which are known for enhancing energy-efficiency in buildings. Various initiatives, such as affordable housing in growing economies such as China and India, and increasing policies to replace traditional material with AAC as a residential construction material significantly boost the demand for AAC across the residential sector. The residential segment accounted for 40.41% share of the global market in 2021. The segment is estimated to grow at an above average CAGR of 7.24% during the forecast period.
Demand for AAC across the globe is majorly dominated by Asia Pacific, which held around 48% of the global market in 2021. It is expected to grow at an average CAGR of 7.54% during the forecast period. Asia Pacific, China along with Japan and India is the largest producer and consumer of AAC. There are more than 200 AAC manufacturing facilities in Asia Pacific and more are emerging. Presence of several developing economies in the region is boosting the per capita income, which in turn is driving urbanization and demand for more residential construction. This in turn is increasing the demand for cost-, and energy-efficient building solutions such as AAC.
Europe held the second-largest share after Asia Pacific. AAC has been successfully used in Europe since the 1920s and in Europe, currently, there are more than 100 manufacturing facilities catering to local as well as international demand for AAC. Major policies and enforcement by governments in Europe to replace traditional material with sustainable and energy-efficient building materials boosts the AAC market in Europe.
The global AAC market is highly consolidated particularly in Asia Pacific and Europe with the presence of numerous players trying to remain competitive in the rapidly growing market and to cater to the ever-growing demand for aerated autoclaved concrete. To achieve this, aerated autoclaved concrete (AAC) manufacturers focus on various strategies such as expansion of their manufacturing facilities across the globe and increasing their business reach. Key players also focus on vertical integrations across the value chain, mergers and acquisitions, and product innovation in order to lead the global market and remain competitive in the industry over time. Xella Group, H+H International, ACICO, and Bigbloc Construction Limited are the prominent entities operating in the market.
Each of these players has been profiled in the Aerated Autoclaved Concrete (AAC) market report based on parameters such as company overview, financial overview, business strategies, product portfolio, business segments, and recent developments.
|
Attribute |
Detail |
|
Market Size Value in 2021 |
US$ 14.7 Bn |
|
Market Forecast Value in 2031 |
US$ 29.1 Bn |
|
Growth Rate (CAGR) |
7.01% |
|
Forecast Period |
2022–2031 |
|
Historical Data Available for |
2020 |
|
Quantitative Units |
US$ Bn for Value and Thousand Cubic Meter for Volume |
|
Market Analysis |
It includes cross segment analysis at global as well as regional and country level. Furthermore, qualitative analysis includes drivers, restraints, opportunities, key trends, Porter’s Five Forces analysis, value chain analysis, and key trend analysis, cost structure analysis, production overview and product specification analysis. |
|
Competition Landscape |
|
|
Format |
Electronic (PDF) + Excel |
|
Market Segmentation |
|
|
Regions Covered |
|
|
Countries Covered |
|
|
Companies Profiled |
|
|
Customization Scope |
Available upon request |
|
Pricing |
Available upon request |
The aerated autoclave concrete (ACC) market stood at US$ US$ 14.7 Bn in 2021
The aerated autoclave concrete (ACC) market is expected to grow at a CAGR of 7.01% from 2022 to 2031
Energy efficient building solutions and rise in industrialization and rapid urbanization
In terms of product, blocks held the largest share of 48.92% of the market in 2021
Asia Pacific was the most lucrative region of the aerated autoclave concrete (ACC) market and held 48% share in 2021
Xella Group, AKG Gazbeton, Brickwell, Shandong Tongde Building Materials, and Parin Beton Company
1. Executive Summary
1.1. Global Market Outlook
1.2. Demand Side Trends
1.3. Key Facts and Figures
1.4. Trends Impacting Market
1.5. TMR’s Growth Opportunity Wheel
2. Market Overview
2.1. Market Segmentation
2.2. Key Developments
2.3. Market Definitions
2.4. Key Market Trends
2.4.1. Market Dynamics
2.4.2. Drivers
2.4.3. Restraints
2.4.4. Opportunities
2.5. Global Aerated Autoclave Concrete (ACC) Market Analysis and Forecast, 2020-2031
2.5.1. Global Aerated Autoclave Concrete (ACC) Market Volume (Thousand Cubic Meter)
2.5.2. Global Aerated Autoclave Concrete (ACC) Market Revenue (US$ Bn)
2.6. Porter’s Five Forces Analysis
2.7. Regulatory Landscape
2.8. Value Chain Analysis
2.8.1. List of Raw Material Providers
2.8.2. List of Manufacturers
2.8.3. List of Dealers/Distributors
2.8.4. List of Potential Customers
2.9. Production Overview
2.10. Product Specification Analysis
2.11. Cost Structure Analysis
3. COVID-19 Impact Analysis
4. Global Aerated Autoclave Concrete (ACC) Market Analysis and Forecast, by Product, 2020–2031
4.1. Introduction and Definitions
4.2. Global Aerated Autoclave Concrete (ACC) Market Volume (Thousand Cubic Meter) and Value (US$ Bn) Forecast, by Product, 2020–2031
4.2.1. Blocks
4.2.2. Wall Panel
4.2.3. Floor Panel
4.2.4. Roof Panel
4.2.5. Cladding Panel
4.3. Others Global Aerated Autoclave Concrete (ACC) Market Attractiveness, by Product
5. Global Aerated Autoclave Concrete (ACC) Market Analysis and Forecast, by End-use, 2020–2031
5.1. Introduction and Definitions
5.2. Global Aerated Autoclave Concrete (ACC) Market Volume (Thousand Cubic Meter) and Value (US$ Bn) Forecast, by End-use,
5.2.1. Residential
5.2.2. Commercial
5.2.3. Others
5.3. Others Global Aerated Autoclave Concrete (ACC) Market Attractiveness, by End-use
6. Global Aerated Autoclave Concrete (ACC) Market Analysis and Forecast, by Region, 2020–2031
6.1. Key Findings
6.2. Global Aerated Autoclave Concrete (ACC) Market Volume (Thousand Cubic Meter) and Value (US$ Bn) Forecast, by Region, 2020–2031
6.2.1. North America
6.2.2. Europe
6.2.3. Asia Pacific
6.2.4. Latin America
6.2.5. Middle East & Africa
6.3. Global Aerated Autoclave Concrete (ACC) Market Attractiveness, by Region
7. North America Aerated Autoclave Concrete (ACC) Market Analysis and Forecast, 2020–2031
7.1. Key Findings
7.2. North America Aerated Autoclave Concrete (ACC) Market Volume (Thousand Cubic Meter) and Value (US$ Bn) Forecast, by Product, 2020–2031
7.3. North America Aerated Autoclave Concrete (ACC) Market Volume (Thousand Cubic Meter) and Value (US$ Bn) Forecast, by End-use, 2020–2031
7.4. North America Aerated Autoclave Concrete (ACC) Market Volume (Thousand Cubic Meter) and Value (US$ Bn) Forecast, by Country, 2020–2031
7.4.1. U.S. Aerated Autoclave Concrete (ACC) Market Volume (Thousand Cubic Meter) and Value (US$ Bn) Forecast, by Product, 2020–2031
7.4.2. U.S. Aerated Autoclave Concrete (ACC) Market Volume (Thousand Cubic Meter) and Value (US$ Bn) Forecast, by End-use, 2020–2031
7.4.3. Canada Aerated Autoclave Concrete (ACC) Market Volume (Thousand Cubic Meter) and Value (US$ Bn) Forecast, by Product, 2020–2031
7.4.4. Canada Aerated Autoclave Concrete (ACC) Market Volume (Thousand Cubic Meter) and Value (US$ Bn) Forecast, by End-use, 2020–2031
7.5. North America Aerated Autoclave Concrete (ACC) Market Attractiveness Analysis
8. Europe Aerated Autoclave Concrete (ACC) Market Analysis and Forecast, 2020–2031
8.1. Key Findings
8.2. Europe Aerated Autoclave Concrete (ACC) Market Volume (Thousand Cubic Meter) and Value (US$ Bn) Forecast, by Product, 2020–2031
8.3. Europe Aerated Autoclave Concrete (ACC) Market Volume (Thousand Cubic Meter) and Value (US$ Bn) Forecast, by End-use, 2020–2031
8.4. Europe Aerated Autoclave Concrete (ACC) Market Volume (Thousand Cubic Meter) and Value (US$ Bn) Forecast, by Country and Sub-region, 2020-2031
8.4.1. Germany Aerated Autoclave Concrete (ACC) Market Volume (Thousand Cubic Meter) and Value (US$ Bn) Forecast, by Product, 2020–2031
8.4.2. Germany Aerated Autoclave Concrete (ACC) Market Volume (Thousand Cubic Meter) and Value (US$ Bn) Forecast, by End-use, 2020–2031
8.4.3. France Aerated Autoclave Concrete (ACC) Market Volume (Thousand Cubic Meter) and Value (US$ Bn) Forecast, by Product, 2020–2031
8.4.4. France Aerated Autoclave Concrete (ACC) Market Volume (Thousand Cubic Meter) and Value (US$ Bn) Forecast, by End-use, 2020–2031
8.4.5. U.K. Aerated Autoclave Concrete (ACC) Market Volume (Thousand Cubic Meter) and Value (US$ Bn) Forecast, by Product, 2020–2031
8.4.6. U.K. Aerated Autoclave Concrete (ACC) Market Volume (Thousand Cubic Meter) and Value (US$ Bn) Forecast, by End-use, 2020–2031
8.4.7. Italy Aerated Autoclave Concrete (ACC) Market Volume (Thousand Cubic Meter) and Value (US$ Bn) Forecast, by Product, 2020–2031
8.4.8. Italy Aerated Autoclave Concrete (ACC) Market Volume (Thousand Cubic Meter) and Value (US$ Bn) Forecast, by End-use, 2020–2031
8.4.9. Spain Aerated Autoclave Concrete (ACC) Market Volume (Thousand Cubic Meter) and Value (US$ Bn) Forecast, by Product, 2020–2031
8.4.10. Spain Aerated Autoclave Concrete (ACC) Market Volume (Thousand Cubic Meter) and Value (US$ Bn) Forecast, by End-use, 2020–2031
8.4.11. Russia & CIS Aerated Autoclave Concrete (ACC) Market Volume (Thousand Cubic Meter) and Value (US$ Bn) Forecast, by Product, 2020–2031
8.4.12. Russia & CIS Aerated Autoclave Concrete (ACC) Market Volume (Thousand Cubic Meter) and Value (US$ Bn) Forecast, by End-use, 2020–2031
8.4.13. Rest of Europe Aerated Autoclave Concrete (ACC) Market Volume (Thousand Cubic Meter) and Value (US$ Bn) Forecast, by Product, 2020–2031
8.4.14. Rest of Europe Aerated Autoclave Concrete (ACC) Market Volume (Thousand Cubic Meter) and Value (US$ Bn) Forecast, by End-use, 2020–2031
8.5. Europe Aerated Autoclave Concrete (ACC) Market Attractiveness Analysis
9. Asia Pacific Aerated Autoclave Concrete (ACC) Market Analysis and Forecast, 2020–2031
9.1. Key Findings
9.2. Asia Pacific Aerated Autoclave Concrete (ACC) Market Volume (Thousand Cubic Meter) and Value (US$ Bn) Forecast, by Product, 2020-2031
9.3. Asia Pacific Aerated Autoclave Concrete (ACC) Market Volume (Thousand Cubic Meter) and Value (US$ Bn) Forecast, by End-use, 2020–2031
9.4. Asia Pacific Aerated Autoclave Concrete (ACC) Market Volume (Thousand Cubic Meter) and Value (US$ Bn) Forecast, by Country and Sub-region, 2020-2031
9.4.1. China Aerated Autoclave Concrete (ACC) Market Volume (Thousand Cubic Meter) and Value (US$ Bn) Forecast, by Product, 2020–2031
9.4.2. China Aerated Autoclave Concrete (ACC) Market Volume (Thousand Cubic Meter) and Value (US$ Bn) Forecast, by End-use, 2020–2031
9.4.3. Japan Aerated Autoclave Concrete (ACC) Market Volume (Thousand Cubic Meter) and Value (US$ Bn) Forecast, by Product, 2020–2031
9.4.4. Japan Aerated Autoclave Concrete (ACC) Market Volume (Thousand Cubic Meter) and Value (US$ Bn) Forecast, by End-use, 2020–2031
9.4.5. India Aerated Autoclave Concrete (ACC) Market Volume (Thousand Cubic Meter) and Value (US$ Bn) Forecast, by Product, 2020–2031
9.4.6. India Aerated Autoclave Concrete (ACC) Market Volume (Thousand Cubic Meter) and Value (US$ Bn) Forecast, by End-use, 2020–2031
9.4.7. ASEAN Aerated Autoclave Concrete (ACC) Market Volume (Thousand Cubic Meter) and Value (US$ Bn) Forecast, by Product, 2020–2031
9.4.8. ASEAN Aerated Autoclave Concrete (ACC) Market Volume (Thousand Cubic Meter) and Value (US$ Bn) Forecast, by End-use, 2020–2031
9.4.9. Rest of Asia Pacific Aerated Autoclave Concrete (ACC) Market Volume (Thousand Cubic Meter) and Value (US$ Bn) Forecast, by Product, 2020–2031
9.4.10. Rest of Asia Pacific Aerated Autoclave Concrete (ACC) Market Volume (Thousand Cubic Meter) and Value (US$ Bn) Forecast, by End-use, 2020–2031
9.5. Asia Pacific Aerated Autoclave Concrete (ACC) Market Attractiveness Analysis
10. Latin America Aerated Autoclave Concrete (ACC) Market Analysis and Forecast, 2020–2031
10.1. Key Findings
10.2. Latin America Aerated Autoclave Concrete (ACC) Market Volume (Thousand Cubic Meter) and Value (US$ Bn) Forecast, by Product, 2020–2031
10.3. Latin America Aerated Autoclave Concrete (ACC) Market Volume (Thousand Cubic Meter) and Value (US$ Bn) Forecast, by End-use, 2020–2031
10.4. Latin America Aerated Autoclave Concrete (ACC) Market Volume (Thousand Cubic Meter) and Value (US$ Bn) Forecast, by Country and Sub-region, 2020-2031
10.4.1. Brazil Aerated Autoclave Concrete (ACC) Market Volume (Thousand Cubic Meter) and Value (US$ Bn) Forecast, by Product, 2020–2031
10.4.2. Brazil Aerated Autoclave Concrete (ACC) Market Volume (Thousand Cubic Meter) and Value (US$ Bn) Forecast, by End-use, 2020–2031
10.4.3. Mexico Aerated Autoclave Concrete (ACC) Market Volume (Thousand Cubic Meter) and Value (US$ Bn) Forecast, by Product, 2020–2031
10.4.4. Mexico Aerated Autoclave Concrete (ACC) Market Volume (Thousand Cubic Meter) and Value (US$ Bn) Forecast, by End-use, 2020–2031
10.4.5. Rest of Latin America Aerated Autoclave Concrete (ACC) Market Volume (Thousand Cubic Meter) and Value (US$ Bn) Forecast, by Product, 2020–2031
10.4.6. Rest of Latin America Aerated Autoclave Concrete (ACC) Market Volume (Thousand Cubic Meter) and Value (US$ Bn) Forecast, by End-use, 2020–2031
10.5. Latin America Aerated Autoclave Concrete (ACC) Market Attractiveness Analysis
11. Middle East & Africa Aerated Autoclave Concrete (ACC) Market Analysis and Forecast, 2020–2031
11.1. Key Findings
11.2. Middle East & Africa Aerated Autoclave Concrete (ACC) Market Volume (Thousand Cubic Meter) and Value (US$ Bn) Forecast, by Product, 2020–2031
11.3. Middle East & Africa Aerated Autoclave Concrete (ACC) Market Volume (Thousand Cubic Meter) and Value (US$ Bn) Forecast, by End-use, 2020–2031
11.4. Middle East & Africa Aerated Autoclave Concrete (ACC) Market Volume (Thousand Cubic Meter) and Value (US$ Bn) Forecast, by Country and Sub-region, 2020-2031
11.4.1. GCC Aerated Autoclave Concrete (ACC) Market Volume (Thousand Cubic Meter) and Value (US$ Bn) Forecast, by Product, 2020–2031
11.4.2. GCC Aerated Autoclave Concrete (ACC) Market Volume (Thousand Cubic Meter) and Value (US$ Bn) Forecast, by End-use, 2020–2031
11.4.3. South Africa Aerated Autoclave Concrete (ACC) Market Volume (Thousand Cubic Meter) and Value (US$ Bn) Forecast, by Product, 2020–2031
11.4.4. South Africa Aerated Autoclave Concrete (ACC) Market Volume (Thousand Cubic Meter) and Value (US$ Bn) Forecast, by End-use, 2020–2031
11.4.5. Rest of Middle East & Africa Aerated Autoclave Concrete (ACC) Market Volume (Thousand Cubic Meter) and Value (US$ Bn) Forecast, by Product, 2020–2031
11.4.6. Rest of Middle East & Africa Aerated Autoclave Concrete (ACC) Market Volume (Thousand Cubic Meter) and Value (US$ Bn) Forecast, by End-use, 2020–2031
11.5. Middle East & Africa Aerated Autoclave Concrete (ACC) Market Attractiveness Analysis
12. Global Aerated Autoclave Concrete (ACC) Company Market Share Analysis, 2021
12.1. Competition Matrix
12.2. Market Footprint Analysis
12.2.1. By Product
12.2.2. By End-use
12.3. Company Profiles (Details – Overview, Financials, Recent Developments, and Strategy)
12.3.1. Xella Group
12.3.1.1. Company Description
12.3.1.2. Business Overview
12.3.1.3. Financial Details
12.3.1.4. Strategic Overview
12.3.2. H+H International
12.3.2.1. Company Description
12.3.2.2. Business Overview
12.3.2.3. Financial Details
12.3.2.4. Strategic Overview
12.3.3. ACICO
12.3.3.1. Company Description
12.3.3.2. Business Overview
12.3.3.3. Financial Details
12.3.3.4. Strategic Overview
12.3.4. AKG Gazbeton
12.3.4.1. Company Description
12.3.4.2. Business Overview
12.3.4.3. Financial Details
12.3.4.4. Strategic Overview
12.3.5. Brickwell
12.3.5.1. Company Description
12.3.5.2. Business Overview
12.3.5.3. Financial Details
12.3.5.4. Strategic Overview
12.3.6. Shandong Tongde Building Materials
12.3.6.1. Company Description
12.3.6.2. Business Overview
12.3.6.3. Financial Details
12.3.6.4. Strategic Overview
12.3.7. Parin Beton Company
12.3.7.1. Company Description
12.3.7.2. Business Overview
12.3.7.3. Financial Details
12.3.7.4. Strategic Overview
12.3.8. SOLBET
12.3.8.1. Company Description
12.3.8.2. Business Overview
12.3.8.3. Financial Details
12.3.8.4. Strategic Overview
12.3.9. Shirke Industries
12.3.9.1. Company Description
12.3.9.2. Business Overview
12.3.9.3. Financial Details
12.3.9.4. Strategic Overview
12.3.10. UltraTech Cement Ltd.
12.3.10.1. Company Description
12.3.10.2. Business Overview
12.3.10.3. Financial Details
12.3.10.4. Strategic Overview
12.3.11. Eastland Building Materials Co., Ltd.
12.3.11.1. Company Description
12.3.11.2. Business Overview
12.3.11.3. Financial Details
12.3.11.4. Strategic Overview
12.3.12. UAL Industries Ltd.
12.3.12.1. Company Description
12.3.12.2. Business Overview
12.3.12.3. Financial Details
12.3.12.4. Strategic Overview
12.3.13. Biltech Building Elements Ltd.
12.3.13.1. Company Description
12.3.13.2. Business Overview
12.3.13.3. Financial Details
12.3.13.4. Strategic Overview
12.3.14. AERCON AAC
12.3.14.1. Company Description
12.3.14.2. Business Overview
12.3.14.3. Financial Details
12.3.14.4. Strategic Overview
13. Primary Research: Key Insights
14. Appendix
List of Tables
Table 1: Percentage of Population Living in Urban Areas
Table 2: Global Aerated Autoclaved Concrete (AAC) Market Volume (Thousand Cubic Meter) Forecast, by Product, 2020 - 2031
Table 3: Global Aerated Autoclaved Concrete (AAC) Market Value (US$ Bn) Forecast, by Product, 2020 - 2031
Table 4: Global Aerated Autoclaved Concrete (AAC) Market Volume (Thousand Cubic Meter) Forecast, by End-use, 2020 - 2031
Table 5: Global Aerated Autoclaved Concrete (AAC) Market Volume (Thousand Cubic Meter) Forecast, by End-use, 2020 - 2031
Table 6: Global Aerated Autoclaved Concrete (AAC) Market Volume (Thousand Cubic Meter) Forecast, by Region , 2020 - 2031
Table 7: Global Aerated Autoclaved Concrete (AAC) Market Value (US$ Bn) Forecast, by Region , 2020 - 2031
Table 8: North America Aerated Autoclaved Concrete (AAC) Market Volume (Thousand Cubic Meter) Forecast, by Product, 2020 - 2031
Table 9: North America Aerated Autoclaved Concrete (AAC) Market Value (US$ Bn) Forecast, by Product, 2020 - 2031
Table 10: North America Aerated Autoclaved Concrete (AAC) Market Volume (Thousand Cubic Meter) Forecast, by End-use, 2020 - 2031
Table 11: North America Aerated Autoclaved Concrete (AAC) Market Value (US$ Bn) Forecast, by End-use, 2020 - 2031
Table 12: North America Aerated Autoclaved Concrete (AAC) Market Volume (Thousand Cubic Meter) Forecast, by Country, 2020 - 2031
Table 13: North America Aerated Autoclaved Concrete (AAC) Market Value (US$ Bn) Forecast, by Country, 2020 - 2031
Table 14: U.S. Aerated Autoclaved Concrete (AAC) Market Volume (Thousand Cubic Meter) Forecast, by Product, 2020 - 2031
Table 15: U.S. Aerated Autoclaved Concrete (AAC) Market Value (US$ Bn) Forecast, by Product, 2020 - 2031
Table 16: U.S. Aerated Autoclaved Concrete (AAC) Market Volume (Thousand Cubic Meter) Forecast, by End-use, 2020 - 2031
Table 17: U.S. Aerated Autoclaved Concrete (AAC) Market Value (US$ Bn) Forecast, by End-use, 2020 - 2031
Table 18: Canada Aerated Autoclaved Concrete (AAC) Market Volume (Thousand Cubic Meter) Forecast, by Product, 2020 - 2031
Table 19: Canada Aerated Autoclaved Concrete (AAC) Market Value (US$ Bn) Forecast, by Product, 2020 - 2031
Table 20: Canada Aerated Autoclaved Concrete (AAC) Market Volume (Thousand Cubic Meter) Forecast, by End-use, 2020 - 2031
Table 21: Canada Aerated Autoclaved Concrete (AAC) Market Value (US$ Bn) Forecast, by End-use, 2020 - 2031
Table 22: Europe Aerated Autoclaved Concrete (AAC) Market Volume (Thousand Cubic Meter) Forecast, by Product, 2020 - 2031
Table 23: Europe Aerated Autoclaved Concrete (AAC) Market Value (US$ Bn) Forecast, by Product, 2020 - 2031
Table 24: Europe Aerated Autoclaved Concrete (AAC) Market Volume (Thousand Cubic Meter) Forecast, by End-use, 2020 - 2031
Table 25: Europe Aerated Autoclaved Concrete (AAC) Market Value (US$ Bn) Forecast, by End-use, 2020 - 2031
Table 26: Europe Aerated Autoclaved Concrete (AAC) Market Volume (Thousand Cubic Meter) Forecast, by Country and Sub-region, 2020 - 2031
Table 27: Europe Aerated Autoclaved Concrete (AAC) Market Value (US$ Bn) Forecast, by Country and Sub-region, 2020 - 2031
Table 28: UK Aerated Autoclaved Concrete (AAC) Market Volume (Thousand Cubic Meter) Forecast, by Product, 2020 - 2031
Table 29: UK Aerated Autoclaved Concrete (AAC) Market Value (US$ Bn) Forecast, by Product, 2020 - 2031
Table 30: UK Aerated Autoclaved Concrete (AAC) Market Volume (Thousand Cubic Meter) Forecast, by End-use, 2020 - 2031
Table 31: UK Aerated Autoclaved Concrete (AAC) Market Value (US$ Bn) Forecast, by End-use, 2020 - 2031
Table 32: Germany Aerated Autoclaved Concrete (AAC) Market Volume (Thousand Cubic Meter) Forecast, by Product, 2020 - 2031
Table 33: Germany Aerated Autoclaved Concrete (AAC) Market Value (US$ Bn) Forecast, by Product, 2020 - 2031
Table 34: Germany Aerated Autoclaved Concrete (AAC) Market Volume (Thousand Cubic Meter) Forecast, by End-use, 2020 - 2031
Table 35: Germany Aerated Autoclaved Concrete (AAC) Market Value (US$ Bn) Forecast, by End-use, 2020 - 2031
Table 36: Russia & CIS Aerated Autoclaved Concrete (AAC) Market Volume (Thousand Cubic Meter) Forecast, by Product, 2020 - 2031
Table 37: Russia & CIS Aerated Autoclaved Concrete (AAC) Market Value (US$ Bn) Forecast, by Product, 2020 - 2031
Table 38: Russia & CIS Aerated Autoclaved Concrete (AAC) Market Volume (Thousand Cubic Meter) Forecast, by End-use, 2020 - 2031
Table 39: Russia & CIS Aerated Autoclaved Concrete (AAC) Market Value (US$ Bn) Forecast, by End-use, 2020 - 2031
Table 40: France Aerated Autoclaved Concrete (AAC) Market Volume (Thousand Cubic Meter) Forecast, by Product, 2020 - 2031
Table 41: France Aerated Autoclaved Concrete (AAC) Market Value (US$ Bn) Forecast, by Product, 2020 - 2031
Table 42: France Aerated Autoclaved Concrete (AAC) Market Volume (Thousand Cubic Meter) Forecast, by End-use, 2020 - 2031
Table 43: France Aerated Autoclaved Concrete (AAC) Market Value (US$ Bn) Forecast, by End-use, 2020 - 2031
Table 44: Italy Aerated Autoclaved Concrete (AAC) Market Volume (Thousand Cubic Meter) Forecast, by Product, 2020 - 2031
Table 45: Italy Aerated Autoclaved Concrete (AAC) Market Value (US$ Bn) Forecast, by Product, 2020 - 2031
Table 46: Italy Aerated Autoclaved Concrete (AAC) Market Volume (Thousand Cubic Meter) Forecast, by End-use, 2020 - 2031
Table 47: Italy Aerated Autoclaved Concrete (AAC) Market Value (US$ Bn) Forecast, by End-use, 2020 - 2031
Table 48: Spain Aerated Autoclaved Concrete (AAC) Market Volume (Thousand Cubic Meter) Forecast, by Product, 2020 - 2031
Table 49: Spain Aerated Autoclaved Concrete (AAC) Market Value (US$ Bn) Forecast, by Product, 2020 - 2031
Table 50: Spain Aerated Autoclaved Concrete (AAC) Market Volume (Thousand Cubic Meter) Forecast, by End-use, 2020 - 2031
Table 51: Spain Aerated Autoclaved Concrete (AAC) Market Value (US$ Bn) Forecast, by End-use, 2020 - 2031
Table 52: Rest of Europe Aerated Autoclaved Concrete (AAC) Market Volume (Thousand Cubic Meter) Forecast, by Product, 2020 - 2031
Table 53: Rest of Europe Aerated Autoclaved Concrete (AAC) Market Value (US$ Bn) Forecast, by Product, 2020 - 2031
Table 54: Rest of Europe Aerated Autoclaved Concrete (AAC) Market Volume (Thousand Cubic Meter) Forecast, by End-use, 2020 - 2031
Table 55: Rest of Europe Aerated Autoclaved Concrete (AAC) Market Value (US$ Bn) Forecast, by End-use, 2020 - 2031
Table 56: Asia Pacific America Aerated Autoclaved Concrete (AAC) Market Volume (Thousand Cubic Meter) Forecast, by Product, 2020 - 2031
Table 57: Asia Pacific Aerated Autoclaved Concrete (AAC) Market Value (US$ Bn) Forecast, by Product, 2020 - 2031
Table 58: Asia Pacific Aerated Autoclaved Concrete (AAC) Market Volume (Thousand Cubic Meter) Forecast, by End-use, 2020 - 2031
Table 59: Asia Pacific Aerated Autoclaved Concrete (AAC) Market Value (US$ Bn) Forecast, by End-use, 2020 - 2031
Table 60: Asia Pacific Aerated Autoclaved Concrete (AAC) Market Volume (Thousand Cubic Meter) Forecast, by Country and Sub-region, 2020 - 2031
Table 61: Asia Pacific Aerated Autoclaved Concrete (AAC) Market Value (US$ Bn) Forecast, by Country and Sub-region, 2020 - 2031
Table 62: China Aerated Autoclaved Concrete (AAC) Market Volume (Thousand Cubic Meter) Forecast, by Product, 2020 - 2031
Table 63: China Aerated Autoclaved Concrete (AAC) Market Value (US$ Bn) Forecast, by Product, 2020 - 2031
Table 64: China Aerated Autoclaved Concrete (AAC) Market Volume (Thousand Cubic Meter) Forecast, by End-use, 2020 - 2031
Table 65: China Aerated Autoclaved Concrete (AAC) Market Value (US$ Bn) Forecast, by End-use, 2020 - 2031
Table 66: India Aerated Autoclaved Concrete (AAC) Market Volume (Thousand Cubic Meter) Forecast, by Product, 2020 - 2031
Table 67: India Aerated Autoclaved Concrete (AAC) Market Value (US$ Bn) Forecast, by Product, 2020 - 2031
Table 68: India Aerated Autoclaved Concrete (AAC) Market Volume (Thousand Cubic Meter) Forecast, by End-use, 2020 - 2031
Table 69: India Aerated Autoclaved Concrete (AAC) Market Value (US$ Bn) Forecast, by End-use, 2020 - 2031
Table 70: Japan Aerated Autoclaved Concrete (AAC) Market Volume (Thousand Cubic Meter) Forecast, by Product, 2020 - 2031
Table 71: Japan Aerated Autoclaved Concrete (AAC) Market Value (US$ Bn) Forecast, by Product, 2020 - 2031
Table 72: Japan Aerated Autoclaved Concrete (AAC) Market Volume (Thousand Cubic Meter) Forecast, by End-use, 2020 - 2031
Table 73: Japan Aerated Autoclaved Concrete (AAC) Market Value (US$ Bn) Forecast, by End-use, 2020 - 2031
Table 74: ASEAN Aerated Autoclaved Concrete (AAC) Market Volume (Thousand Cubic Meter) Forecast, by Product, 2020 - 2031
Table 75: ASEAN Aerated Autoclaved Concrete (AAC) Market Value (US$ Bn) Forecast, by Product, 2020 - 2031
Table 76: ASEAN Aerated Autoclaved Concrete (AAC) Market Volume (Thousand Cubic Meter) Forecast, by End-use, 2020 - 2031
Table 77: ASEAN Aerated Autoclaved Concrete (AAC) Market Value (US$ Bn) Forecast, by End-use, 2020 - 2031
Table 78: Rest of Asia Pacific Aerated Autoclaved Concrete (AAC) Market Volume (Thousand Cubic Meter) Forecast, by Product, 2020 - 2031
Table 79: Rest of Asia Pacific Aerated Autoclaved Concrete (AAC) Market Value (US$ Bn) Forecast, by Product, 2020 - 2031
Table 80: Rest of Asia Pacific Aerated Autoclaved Concrete (AAC) Market Volume (Thousand Cubic Meter) Forecast, by End-use, 2020 - 2031
Table 81: Rest of Asia Pacific Aerated Autoclaved Concrete (AAC) Market Value (US$ Bn) Forecast, by End-use, 2020 - 2031
Table 82: Latin America Aerated Autoclaved Concrete (AAC) Market Volume (Thousand Cubic Meter) Forecast, by Product, 2020 - 2031
Table 83: Latin America Aerated Autoclaved Concrete (AAC) Market Value (US$ Bn) Forecast, by Product, 2020 - 2031
Table 84: Latin America Aerated Autoclaved Concrete (AAC) Market Volume (Thousand Cubic Meter) Forecast, by End-use, 2020 - 2031
Table 85: Latin America Aerated Autoclaved Concrete (AAC) Market Value (US$ Bn) Forecast, by End-use, 2020 - 2031
Table 86: Latin America Aerated Autoclaved Concrete (AAC) Market Volume (Thousand Cubic Meter) Forecast, by Country and Sub-region, 2020 - 2031
Table 87: Latin America Aerated Autoclaved Concrete (AAC) Market Value (US$ Bn) Forecast, by Country and Sub-region, 2020 - 2031
Table 88: Brazil Aerated Autoclaved Concrete (AAC) Market Volume (Thousand Cubic Meter) Forecast, by Product, 2020 - 2031
Table 89: Brazil Aerated Autoclaved Concrete (AAC) Market Value (US$ Bn) Forecast, by Product, 2020 - 2031
Table 90: Brazil Aerated Autoclaved Concrete (AAC) Market Volume (Thousand Cubic Meter) Forecast, by End-use, 2020 - 2031
Table 91: Brazil Aerated Autoclaved Concrete (AAC) Market Value (US$ Bn) Forecast, by End-use, 2020 - 2031
Table 92: Mexico Aerated Autoclaved Concrete (AAC) Market Volume (Thousand Cubic Meter) Forecast, by Product, 2020 - 2031
Table 93: Mexico Aerated Autoclaved Concrete (AAC) Market Value (US$ Bn) Forecast, by Product, 2020 - 2031
Table 94: Mexico Aerated Autoclaved Concrete (AAC) Market Volume (Thousand Cubic Meter) Forecast, by End-use, 2020 - 2031
Table 95: Mexico Aerated Autoclaved Concrete (AAC) Market Value (US$ Bn) Forecast, by End-use, 2020 - 2031
Table 96: Rest of Latin America Aerated Autoclaved Concrete (AAC) Market Volume (Thousand Cubic Meter) Forecast, by Product, 2020 - 2031
Table 97: Rest of Latin America Aerated Autoclaved Concrete (AAC) Market Value (US$ Bn) Forecast, by Product, 2020 - 2031
Table 98: Rest of Latin America Aerated Autoclaved Concrete (AAC) Market Volume (Thousand Cubic Meter) Forecast, by End-use, 2020 - 2031
Table 99: Rest of Latin America Aerated Autoclaved Concrete (AAC) Market Value (US$ Bn) Forecast, by End-use, 2020 - 2031
Table 100: Middle East & Africa Aerated Autoclaved Concrete (AAC) Market Volume (Thousand Cubic Meter) Forecast, by Product, 2020 - 2031
Table 101: Middle East & Africa Aerated Autoclaved Concrete (AAC) Market Value (US$ Bn) Forecast, by Product, 2020 - 2031
Table 102: Middle East & Africa Aerated Autoclaved Concrete (AAC) Market Volume (Thousand Cubic Meter) Forecast, by End-use, 2020 - 2031
Table 103: Middle East & Africa Aerated Autoclaved Concrete (AAC) Market Value (US$ Bn) Forecast, by End-use, 2020 - 2031
Table 104: Middle East & Africa Aerated Autoclaved Concrete (AAC) Market Size (Thousand Cubic Meter) Forecast, by Country and Sub-region, 2020 - 2031
Table 105: Middle East & Africa Aerated Autoclaved Concrete (AAC) Market Size (US$ Mn) Forecast, by Country and Sub-region, 2020 - 2031
Table 106: GCC Aerated Autoclaved Concrete (AAC) Market Volume (Thousand Cubic Meter) Forecast, by Product, 2020 - 2031
Table 107: GCC Aerated Autoclaved Concrete (AAC) Market Value (US$ Bn) Forecast, by Product, 2020 - 2031
Table 108: GCC Aerated Autoclaved Concrete (AAC) Market Volume (Thousand Cubic Meter) Forecast, by End-use, 2020 - 2031
Table 109: GCC Aerated Autoclaved Concrete (AAC) Market Value (US$ Bn) Forecast, by End-use, 2020 - 2031
Table 110: South Africa Aerated Autoclaved Concrete (AAC) Market Volume (Thousand Cubic Meter) Forecast, by Product, 2020 - 2031
Table 111: South Africa Aerated Autoclaved Concrete (AAC) Market Value (US$ Bn) Forecast, by Product, 2020 - 2031
Table 112: South Africa Aerated Autoclaved Concrete (AAC) Market Volume (Thousand Cubic Meter) Forecast, by End-use, 2020 - 2031
Table 113: South Africa Aerated Autoclaved Concrete (AAC) Market Value (US$ Bn) Forecast, by End-use, 2020 - 2031
Table 114: Rest of Middle East & Africa Aerated Autoclaved Concrete (AAC) Market Volume (Thousand Cubic Meter) Forecast, by Product,
Table 115: Rest of Middle East & Africa Aerated Autoclaved Concrete (AAC) Market Value (US$ Bn) Forecast, by Product, 2020 - 2031
Table 116: Rest of Middle East & Africa Aerated Autoclaved Concrete (AAC) Market Volume (Thousand Cubic Meter) Forecast, by End-use,
Table 117: Rest of Middle East & Africa Aerated Autoclaved Concrete (AAC) Market Value (US$ Bn) Forecast, by End-use, 2020 - 2031
List of Figures
Figure 1: Global Aerated Autoclaved Concrete (AAC) Market Volume Share Analysis, by Product, 2021, 2026, and 2031
Figure 2: Global Aerated Autoclaved Concrete (AAC) Market Attractiveness, by Product
Figure 3: Global Aerated Autoclaved Concrete (AAC) Market Volume Share Analysis, by End-use, 2021, 2026, and 2031
Figure 4: Global Aerated Autoclaved Concrete (AAC) Market Attractiveness, by End-use
Figure 5: Global Aerated Autoclaved Concrete (AAC) Market Volume Share Analysis, by Region, 2021, 2026, and 2031
Figure 6: Global Aerated Autoclaved Concrete (AAC) Market Attractiveness, by Region
Figure 7: North America Aerated Autoclaved Concrete (AAC) Market Volume Share Analysis, by Product, 2021, 2026, and 2031
Figure 8: North America Aerated Autoclaved Concrete (AAC) Market Attractiveness, by Product
Figure 9: North America Aerated Autoclaved Concrete (AAC) Market Volume Share Analysis, by End-use, 2021, 2026, and 2031
Figure 10: North America Aerated Autoclaved Concrete (AAC) Market Attractiveness, by End-use
Figure 11: North America Aerated Autoclaved Concrete (AAC) Market Volume Share Analysis, by Country, 2021, 2026, and 2031
Figure 12: North America Aerated Autoclaved Concrete (AAC) Market Attractiveness, by Country
Figure 13: Europe Aerated Autoclaved Concrete (AAC) Market Volume Share Analysis, by Product, 2021, 2026, and 2031
Figure 14: Europe Aerated Autoclaved Concrete (AAC) Market Attractiveness, by Product
Figure 15: Europe Aerated Autoclaved Concrete (AAC) Market Volume Share Analysis, by End-use, 2021, 2026, and 2031
Figure 16: Europe Aerated Autoclaved Concrete (AAC) Market Attractiveness, by End-use
Figure 17: Europe Aerated Autoclaved Concrete (AAC) Market Volume Share Analysis, by Country and Sub-region, 2021, 2026, and 2031
Figure 18: Europe Aerated Autoclaved Concrete (AAC) Market Attractiveness, by Country and Sub-region
Figure 19: Asia Pacific Aerated Autoclaved Concrete (AAC) Market Volume Share Analysis, by Product, 2021, 2026, and 2031
Figure 20: Asia Pacific Aerated Autoclaved Concrete (AAC) Market Attractiveness, by Product
Figure 21: Asia Pacific Aerated Autoclaved Concrete (AAC) Market Volume Share Analysis, by End-use, 2021, 2026, and 2031
Figure 22: Asia Pacific Aerated Autoclaved Concrete (AAC) Market Attractiveness, by End-use
Figure 23: Asia Pacific Aerated Autoclaved Concrete (AAC) Market Volume Share Analysis, by Country and Sub-region, 2021, 2026, and 2031
Figure 24: Asia Pacific Aerated Autoclaved Concrete (AAC) Market Attractiveness, by Country and Sub-region
Figure 25: Latin America Aerated Autoclaved Concrete (AAC) Market Volume Share Analysis, by Product, 2021, 2026, and 2031
Figure 26: Latin America Aerated Autoclaved Concrete (AAC) Market Attractiveness, by Product
Figure 27: Latin America Aerated Autoclaved Concrete (AAC) Market Volume Share Analysis, by End-use, 2021, 2026, and 2031
Figure 28: Latin America Aerated Autoclaved Concrete (AAC) Market Attractiveness, by End-use
Figure 29: Latin America Aerated Autoclaved Concrete (AAC) Market Volume Share Analysis, by Country and Sub-region, 2021, 2026, and 2031
Figure 30: Latin America Aerated Autoclaved Concrete (AAC) Market Attractiveness, by Country and Sub-region
Figure 31: Middle East & Africa Aerated Autoclaved Concrete (AAC) Market Volume Share Analysis, by Product, 2021, 2026, and 2031
Figure 32: Middle East & Africa Aerated Autoclaved Concrete (AAC) Market Attractiveness, by Product
Figure 33: Middle East & Africa Aerated Autoclaved Concrete (AAC) Market Volume Share Analysis, by End-use, 2021, 2026, and 2031
Figure 34: Middle East & Africa Aerated Autoclaved Concrete (AAC) Market Attractiveness, by End-use
Figure 35: Middle East & Africa Aerated Autoclaved Concrete (AAC) Market Volume Share Analysis, by Country and Sub-region, 2021, 2026, and 2031
Figure 36: Middle East & Africa Aerated Autoclaved Concrete (AAC) Market Attractiveness, by Country and Sub-region
Copyright © Transparency Market Research, Inc. All Rights reserved
Trust Online

Aerated Autoclaved Concrete (AAC) Market