
Viscosity is defined as an inherent resistance of a liquid to flow. Moreover, the viscosity index refers to a response of a liquid to alternations in the temperature (usually, between 40°C and 100°C). A lubricant is considered to have low viscosity index if it shows extreme change in viscosity at different temperatures. Viscosity index improvers can be defined as polymers mixed in a lubricant so as to show resistant to alterations in its viscosity on the temperature rise.
Polyisobutylene, polymethacrylate, and olefin copolymer are some of the key product types available in the global viscosity index improvers market. Moreover, there products are increasingly used in many end-use industries such as off-road vehicles, industrial machinery, and automotive industry. This wide application of the product is bringing promising opportunities of business in the viscosity index improvers market.
Lubricants refer to products used to decrease the levels of friction in two surfaces, thereby offering wear protection to surfaces and boosting the operational efficiency. Thus, lubricants help in increasing the machine runtimes and stops wear and tear of machine parts. Viscosity index improvers are gaining traction as they are important part of every lubricant additive batch owing to their ability to help in maintaining viscosity when lubricants are subjected to high operating temperatures. Hence, rise in the use of lubricants is projected to fuel the demand avenues in the viscosity index improvers market in the upcoming years.
Several developing countries such as BRICS are experiencing rise in urbanization. This factor is generating sizable growth opportunities in the global viscosity index improvers market. Moreover, the expansion of several sectors including automotive, energy, and industrial machinery of these nations is estimated to fuel the sales of lubricants together with their additives including viscosity index improvers.
Companies operating in the viscosity index improvers market are increasingly involved in the R&D projects. The main motive of these researches is to improve the quality of their products. Moreover, players in the market for viscosity index improvers are involving in different strategies such as mergers, acquisitions, partnerships, and collaborations. These activities are helping enterprises to maintain their dominant position in the viscosity index improvers market.
Viscosity Index Improvers Market - Snapshot
Lubricants are expected to deliver satisfactory performance at all conditions ranging from low to high temperatures, without undergoing drastic changes in their viscosity during the operation. In order to ensure this, lubricant manufacturers rely on viscosity index improvers to deliver optimal viscosity performance at all operating conditions. Viscosity can be described as inherent resistance of a liquid to flow, while viscosity index represents response of the liquid to changes in temperature (generally, from 40°C to 100°C). If a lubricant exhibits drastic change in viscosity over a range of temperature, the lubricant is said to have low viscosity index. Viscosity index improvers are polymers that are added to a lubricant in order to resist change in its viscosity with rise in the temperature. With increase in temperature, polymeric molecules of viscosity index improvers tend to stretch out, thereby increasing the internal friction of the fluid to the flow. With increase in internal friction, the fluid flows at a slower pace, thereby exhibiting increase in its viscosity. Viscosity index improvers can vary greatly, depending on their molecular structure and specific chemistry.
Increasing demand for lubricants and rising automotive sales likely to drive the market
Lubricants have become an essential part of the modern-day industry. Almost any type of operation or machining requires some sort of lubricants in order to enhance the overall efficiency of the operation. Lubricants are products that are used to reduce friction between two surfaces, thereby increasing the operational efficiency and providing wear protection to surfaces, which extends machine runtimes and prevents wear and tear of machine parts. A viscosity index improver is an essential part of every lubricant additive batch, as it helps the lubricant to maintain its viscosity when subjected to high operating temperatures. Thus, increase in the demand for lubricants is likely to drive the demand for viscosity index improvers during the forecast period. Rapid ongoing industrialization, especially in developing economies such as BRICS, is also expected to drive the market during the forecast period. Growth of sectors, such as industrial machinery, automotive, and energy, in these countries is boosting the demand for lubricants along with their additives such as viscosity index improvers.
Moreover, growth of the automotive sector is also projected to drive the market for viscosity index improvers during the forecast period. The automotive industry is one of the largest consumers of lubricants. This correlates the demand for base oils and lubricant additives with the automotive sector. Thus, increasing demand for automobiles and expanding automotive sector are likely to augment the viscosity index improver market in the near future.
Long engine oil drain interval expected to restrain the market
Ongoing technological advancements in the automotive industry have resulted in evolution of the engine technology and lubricant oil chemistry over the last few years. This development has improved the engine oil drain interval from an average of 25,000 miles to as high as 50,000 miles for a heavy-duty truck. Moreover, increasing usage of cleaner fuels, high-quality lubricants, dependable engines, and the superior filter technology has raised the average oil drain interval. This rise in the oil drain interval is likely to reduce the consumption of engine oils in automobiles. This, in turn, is likely to restrain the demand for viscosity index improvers during the forecast period.
Rising need for improvement in fuel economy to offer lucrative opportunities to the viscosity index improvers market
Increasing demand for improved fuel economy, reduction in emissions, and better durability has resulted in the upgrade of automobile hardware. Moreover, the trend necessitates improvement in the lubricant performance, thereby creating demand for viscosity index improvers and performance additives. Significant efforts are being made in this direction in order to improve the performance of viscosity index improvers, allowing blending of lubricants at high viscosity index so as to improve the fuel economy and reduce engine deposits. Therefore, rising need for improvement in the fuel economy is likely to provide lucrative opportunities to the viscosity index improver market during the forecast period.
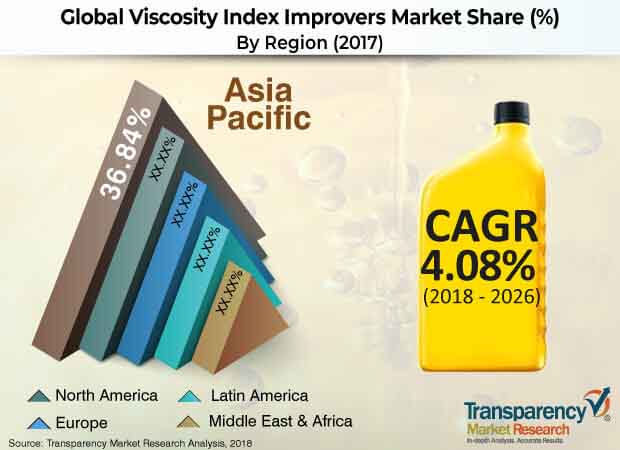
Asia Pacific held a major i.e. around 35% share of the global market in 2017
Based on region, the global viscosity index improver market has been divided into North America, Latin America, Europe, Asia Pacific, and Middle East & Africa. Asia Pacific dominated the global market in 2017. This can be primarily ascribed to the region being an automotive and industrial hub. Moreover, the market in Asia Pacific is anticipated to expand at a significant pace during the forecast period, primarily due to rise in the demand for automobiles in the region, especially in developing countries such as China and India.
A few large players dominate global viscosity index improver market
Key players operating in the global viscosity index improver market are Evonik Industries, The Lubrizol Corporation, Chevron Oronite Company LLC, Afton Chemical Corporation, Infineum International Limited, Sanyo Chemical Industries, Ltd., Nanjing Runyou Chemical industry Additive Co., Ltd., and Shenyang Great Wall Lubricating Oil Manufacturing Co., Ltd.
The global viscosity index improvers market has been segmented as follows:
|
Type |
|
|
End-user Industry
|
|
|
Region |
|
1. Preface
1.1. Report Scope and Market Segmentation
1.2. Research Highlights
2. Assumptions and Research Methodology
2.1. Report Assumptions
2.2. Secondary Sources and Acronyms Used
2.3. Research Methodology
3. Executive Summary
3.1. Market Snapshot
3.2. Top Trends
4. Market Overview
5. Market Dynamics
5.1. Drivers and Restraints Snapshot Analysis
5.1.1. Drivers
5.1.2. Restraints
5.1.3. Opportunities
5.2. Porter’s Analysis
5.2.1. Threat of Substitutes
5.2.2. Bargaining Power of Buyers
5.2.3. Bargaining Power of Suppliers
5.2.4. Threat of New Entrants
5.2.5. Degree of Competition
5.3. Value Chain Analysis
5.4. List of Key Manufacturers of Viscosity Index Improvers
5.3. List of Key Customers
6. Global Viscosity Index Improvers Market Analysis and Forecast, by Type, 2017–2026
6.1. Introduction
6.2. Key Findings
6.3. Global Viscosity Index Improvers Market Volume (Kilo Tons) & Value (US$ Mn) Analysis & Forecast, by Type, 2017–2026
6.3.1. Polymethacrylate
6.3.2. Olefin Copolymer
6.3.3. Polyisobutylene
6.3.4. Others
6.4. Global Viscosity Index Improvers Market Attractiveness Analysis, by Type
7. Global Viscosity Index Improvers Market Analysis and Forecast, by End-user Industry, 2017–2026
7.1. Introduction
7.2. Key Findings
7.3. Global Viscosity Index Improvers Market Volume (Kilo Tons) & Value (US$ Mn) Analysis & Forecast, by End-user Industry, 2017–2026
7.3.1. Automotive
7.3.1.1. Private Vehicles
7.3.1.2. Commercial Vehicles
7.3.2. Off-road Vehicles
7.3.3. Industrial Machinery
7.3.4. Others
7.4. Global Viscosity Index Improvers Market Attractiveness Analysis, by End-user Industry
8. Global Viscosity Index Improvers Market Analysis, by Region, 2017–2026
8.1. Global Viscosity Index Improvers Market Value and Growth Scenario, by Region, 2017
8.2. Key Findings
8.3. Global Viscosity Index Improvers Market Volume (Kilo Tons) & Value (US$ Mn) Analysis & Forecast, by Region, 2017–2026
8.3.1. North America
8.3.2. Europe
8.3.3. Asia Pacific
8.3.4. Middle East & Africa
8.3.5. Latin America
8.4. Global Viscosity Index Improvers Market Attractiveness Analysis, by Region
9. North America Viscosity Index Improvers Market Analysis, 2017–2026
9.1. Key Findings
9.2. North America Viscosity Index Improvers Market Volume (Kilo Tons) & Value (US$ Mn) Analysis & Forecast, by Type
9.2.1. Polymethacrylate
9.2.2. Olefin Copolymer
9.2.3. Polyisobutylene
9.2.4. Others
9.3. North America Viscosity Index Improvers Market Volume (Kilo Tons) & Value (US$ Mn) Analysis & Forecast, by End-user Industry
9.3.1. Automotive
9.3.1.1. Private Vehicles
9.3.1.1. Commercial Vehicles
9.3.2. Off-road Vehicles
9.3.3. Industrial Machinery
9.3.4. Others
9.4. U.S. Viscosity Index Improvers Market Volume (Kilo Tons) & Value (US$ Mn) Forecast, by Type
9.4.1. Polymethacrylate
9.4.2. Olefin Copolymer
9.4.3. Polyisobutylene
9.4.4. Others
9.5. U.S. Viscosity Index Improvers Market Volume (Kilo Tons) & Value (US$ Mn) Forecast, by End-user Industry
9.5.1. Automotive
9.5.1.1. Private Vehicles
9.5.1.2. Commercial Vehicles
9.5.2. Off-road Vehicles
9.5.3. Industrial Machinery
9.5.4. Others
9.6. Canada Viscosity Index Improvers Market Volume (Kilo Tons) & Value (US$ Mn) Forecast, by Type
9.6.1. Polymethacrylate
9.6.2. Olefin Copolymer
9.6.3. Polyisobutylene
9.6.4. Others
9.7. Canada Viscosity Index Improvers Market Volume (Kilo Tons) & Value (US$ Mn) Forecast, by End-user Industry
9.7.1. Automotive
9.7.1.1. Private Vehicles
9.7.1.2. Commercial Vehicles
9.7.2. Off-road Vehicles
9.7.3. Industrial Machinery
9.7.4. Others
9.8. North America Viscosity Index Improvers Market Attractiveness Analysis
9.8.1. By Type
9.8.2. By End-user Industry
9.8.3. By Country
10. Europe Viscosity Index Improvers Market Analysis, 2017–2026
10.1. Key Findings
10.2. Europe Viscosity Index Improvers Market Volume (Kilo Tons) & Value (US$ Mn) Analysis & Forecast, by Type
10.2.1. Polymethacrylate
10.2.2. Olefin Copolymer
10.2.3. Polyisobutylene
10.2.4. Others
10.3. Europe Viscosity Index Improvers Market Volume (Kilo Tons) & Value (US$ Mn) Analysis & Forecast, by End-user Industry
10.3.1. Automotive
10.3.1.1. Private Vehicles
10.3.1.2. Commercial Vehicles
10.3.2. Off-road Vehicles
10.3.3. Industrial Machinery
10.3.4. Others
10.4. Germany Viscosity Index Improvers Market Volume (Kilo Tons) & Value (US$ Mn) Forecast, by Type
10.4.1. Polymethacrylate
10.4.2. Olefin Copolymer
10.4.3. Polyisobutylene
10.4.4. Others
10.5. Germany Viscosity Index Improvers Market Volume (Kilo Tons) & Value (US$ Mn) Forecast, by End-user Industry
10.5.1. Automotive
10.5.1.1. Private Vehicles
10.5.1.2. Commercial Vehicles
10.5.2. Off-road Vehicles
10.5.3. Industrial Machinery
10.5.4. Others
10.6. France Viscosity Index Improvers Market Volume (Kilo Tons) & Value (US$ Mn) Forecast, by Type
10.6.1. Polymethacrylate
10.6.2. Olefin Copolymer
10.6.3. Polyisobutylene
10.6.4. Others
10.7. France Viscosity Index Improvers Market Volume (Kilo Tons) & Value (US$ Mn) Forecast, by End-user Industry
10.7.1. Automotive
10.7.1.1. Private Vehicles
10.7.1.2. Commercial Vehicles
10.7.2. Off-road Vehicles
10.7.3. Industrial Machinery
10.7.4. Others
10.8. U.K. Viscosity Index Improvers Market Volume (Kilo Tons) & Value (US$ Mn) Forecast, by Type
10.8.1. Polymethacrylate
10.8.2. Olefin Copolymer
10.8.3. Polyisobutylene
10.8.4. Others
10.9. U.K. Viscosity Index Improvers Market Volume (Kilo Tons) & Value (US$ Mn) Forecast, by End-user Industry
10.9.1. Automotive
10.9.1.1. Private Vehicles
10.9.1.2. Commercial Vehicles
10.9.2. Off-road Vehicles
10.9.3. Industrial Machinery
10.9.4. Others
10.10. Italy Viscosity Index Improvers Market Volume (Kilo Tons) & Value (US$ Mn) Forecast, by Type
10.10.1. Polymethacrylate
10.10.2. Olefin Copolymer
10.10.3. Polyisobutylene
10.10.4. Others
10.11. Italy Viscosity Index Improvers Market Volume (Kilo Tons) & Value (US$ Mn) Forecast, by End-user Industry
10.11.1. Automotive
10.11.1.1. Private Vehicles
10.11.1.2. Commercial Vehicles
10.11.2. Off-road Vehicles
10.11.3. Industrial Machinery
10.11.4. Others
10.12. Spain Viscosity Index Improvers Market Volume (Kilo Tons) & Value (US$ Mn) Forecast, by Type
10.12.1. Polymethacrylate
10.12.2. Olefin Copolymer
10.12.3. Polyisobutylene
10.12.4. Others
10.13. Spain Viscosity Index Improvers Market Volume (Kilo Tons) & Value (US$ Mn) Forecast, by End-user Industry
10.13.1. Automotive
10.13.1.1. Private Vehicles
10.13.1.2. Commercial Vehicles
10.13.2. Off-road Vehicles
10.13.3. Industrial Machinery
10.13.4. Others
10.14. Russia & CIS Viscosity Index Improvers Market Volume (Kilo Tons) & Value (US$ Mn) Forecast, by Type
10.14.1. Polymethacrylate
10.14.2. Olefin Copolymer
10.14.3. Polyisobutylene
10.14.4. Others
10.15. Russia & CIS Viscosity Index Improvers Market Volume (Kilo Tons) & Value (US$ Mn) Forecast, by End-user Industry
10.15.1. Automotive
10.15.1.1. Private Vehicles
10.15.1.2. Commercial Vehicles
10.15.2. Off-road Vehicles
10.15.3. Industrial Machinery
10.15.4. Others
10.16. Rest of Europe Viscosity Index Improvers Market Volume (Kilo Tons) & Value (US$ Mn) Forecast, by Type
10.16.1. Polymethacrylate
10.16.2. Olefin Copolymer
10.16.3. Polyisobutylene
10.16.4. Others
10.17. Rest of Europe Viscosity Index Improvers Market Volume (Kilo Tons) & Value (US$ Mn) Forecast, by End-user Industry
10.17.1. Automotive
10.17.1.1. Private Vehicles
10.17.1.2. Commercial Vehicles
10.17.2. Off-road Vehicles
10.17.3. Industrial Machinery
10.17.4. Others
10.18. Europe Viscosity Index Improvers Market Attractiveness Analysis
10.18.1. By Type
10.18.2. By End-user Industry
10.18.3. By Country/Sub-region
11. Asia Pacific Viscosity Index Improvers Market Analysis, 2017–2026
11.1. Key Findings
11.2. Asia Pacific Viscosity Index Improvers Market Volume (Kilo Tons) & Value (US$ Mn) Analysis & Forecast, by Type
11.2.1. Polymethacrylate
11.2.2. Olefin Copolymer
11.2.3. Polyisobutylene
11.2.4. Others
11.3. Asia Pacific Viscosity Index Improvers Market Volume (Kilo Tons) & Value (US$ Mn) Analysis & Forecast, by End-user Industry
11.3.1. Automotive
11.3.1.1. Private Vehicles
11.3.1.2. Commercial Vehicles
11.3.2. Off-road Vehicles
11.3.3. Industrial Machinery
11.3.4. Others
11.4. China Viscosity Index Improvers Market Volume (Kilo Tons) & Value (US$ Mn) Forecast, by Type
11.4.1. Polymethacrylate
11.4.2. Olefin Copolymer
11.4.3. Polyisobutylene
11.4.4. Others
11.5. China Viscosity Index Improvers Market Volume (Kilo Tons) & Value (US$ Mn) Forecast, by End-user Industry
11.5.1. Automotive
11.5.1.1. Private Vehicles
11.5.1.2. Commercial Vehicles
11.5.2. Off-road Vehicles
11.5.3. Industrial Machinery
11.5.4. Others
11.6 India Viscosity Index Improvers Market Volume (Kilo Tons) & Value (US$ Mn) Forecast, by Type
11.6.1. Polymethacrylate
11.6.2. Olefin Copolymer
11.6.3. Polyisobutylene
11.6.4. Others
11.7. India Viscosity Index Improvers Market Volume (Kilo Tons) & Value (US$ Mn) Forecast, by End-user Industry
11.7.1. Automotive
11.7.1.1. Private Vehicles
11.7.1.2. Commercial Vehicles
11.7.2. Off-road Vehicles
11.7.3. Industrial Machinery
11.7.4. Others
11.8. Japan Viscosity Index Improvers Market Volume (Kilo Tons) & Value (US$ Mn) Forecast, by Type
11.8.1. Polymethacrylate
11.8.2. Olefin Copolymer
11.8.3. Polyisobutylene
11.8.4. Others
11.9. Japan Viscosity Index Improvers Market Volume (Kilo Tons) & Value (US$ Mn) Forecast, by End-user Industry
11.9.1. Automotive
11.9.1.1. Private Vehicles
11.9.1.2. Commercial Vehicles
11.9.2. Off-road Vehicles
11.9.3. Industrial Machinery
11.9.4. Others
11.10. ASEAN Viscosity Index Improvers Market Volume (Kilo Tons) & Value (US$ Mn) Forecast, by Type
11.10.1. Polymethacrylate
11.10.2. Olefin Copolymer
11.10.3. Polyisobutylene
11.10.4. Others
11.11. ASEAN Viscosity Index Improvers Market Volume (Kilo Tons) & Value (US$ Mn) Forecast, by End-user Industry
11.11.1. Automotive
11.11.1.1. Private Vehicles
11.11.1.2. Commercial Vehicles
11.11.2. Off-road Vehicles
11.11.3. Industrial Machinery
11.11.4. Others
11.12. Rest of Asia Pacific Viscosity Index Improvers Market Volume (Kilo Tons) & Value (US$ Mn) Forecast, by Type
11.12.1. Polymethacrylate
11.12.2. Olefin Copolymer
11.12.3. Polyisobutylene
11.12.4. Others
11.13. Rest of Asia Pacific Viscosity Index Improvers Market Volume (Kilo Tons) & Value (US$ Mn) Forecast, by End-user Industry
11.13.1. Automotive
11.13.1.1. Private Vehicles
11.13.1.2. Commercial Vehicles
11.13.2. Off-road Vehicles
11.13.3. Industrial Machinery
11.13.4. Others
11.14. Asia Pacific Viscosity Index Improvers Market Attractiveness Analysis
11.14.1. By Type
11.14.2. By End-user Industry
11.14.3. By Country/Sub-region
12. Middle East & Africa Viscosity Index Improvers Market Analysis, 2017–2026
12.1. Key Findings
12.2. Middle East & Africa Viscosity Index Improvers Market Volume (Kilo Tons) & Value (US$ Mn) Analysis & Forecast, by Type
12.2.1. Polymethacrylate
12.2.2. Olefin Copolymer
12.2.3. Polyisobutylene
12.2.4. Others
12.3. Middle East & Africa Viscosity Index Improvers Market Volume (Kilo Tons) & Value (US$ Mn) Analysis & Forecast, by End-user Industry
12.3.1. Automotive
12.3.1.1. Private Vehicles
12.3.1.2. Commercial Vehicles
12.3.2. Off-road Vehicles
12.3.3. Industrial Machinery
12.3.4. Others
12.4. GCC Viscosity Index Improvers Market Volume (Kilo Tons) & Value (US$ Mn) Forecast, by Type
12.4.1. Polymethacrylate
12.4.2. Olefin Copolymer
12.4.3. Polyisobutylene
12.4.4. Others
12.5. GCC Viscosity Index Improvers Market Volume (Kilo Tons) & Value (US$ Mn) Forecast, by End-user Industry
12.5.1. Automotive
12.5.1.1. Private Vehicles
12.5.1.2. Commercial Vehicles
12.5.2. Off-road Vehicles
12.5.3. Industrial Machinery
12.5.4. Others
12.6 South Africa Viscosity Index Improvers Market Volume (Kilo Tons) & Value (US$ Mn) Forecast, by Type
12.6.1. Polymethacrylate
12.6.2. Olefin Copolymer
12.6.3. Polyisobutylene
12.6.4. Others
12.7. South Africa Viscosity Index Improvers Market Volume (Kilo Tons) & Value (US$ Mn) Forecast, by End-user Industry
12.7.1. Automotive
12.7.1.1. Private Vehicles
12.7.1.2. Commercial Vehicles
12.7.2. Off-road Vehicles
12.7.3. Industrial Machinery
12.7.4. Others
12.8. Rest of Middle East & Africa Viscosity Index Improvers Market Volume (Kilo Tons) & Value (US$ Mn) Forecast, by Type
12.8.1. Polymethacrylate
12.8.2. Olefin Copolymer
12.8.3. Polyisobutylene
12.8.4. Others
12.9. Rest of Middle East & Africa Viscosity Index Improvers Market Volume (Kilo Tons) & Value (US$ Mn) Forecast, by End-user Industry
12.9.1. Automotive
12.9.1.1. Private Vehicles
12.9.1.2. Commercial Vehicles
12.9.2. Off-road Vehicles
12.9.3. Industrial Machinery
12.9.4. Others
12.10. Middle East & Africa Viscosity Index Improvers Market Attractiveness Analysis
12.10.1. By Type
12.10.2. By End-user Industry
12.10.3. By Country/Sub-region
13. Latin America Viscosity Index Improvers Market Analysis, 2017–2026
13.1. Key Findings
13.2. Latin America Viscosity Index Improvers Market Volume (Kilo Tons) & Value (US$ Mn) Analysis & Forecast, by Type
13.2.1. Polymethacrylate
13.2.2. Olefin Copolymer
13.2.3. Polyisobutylene
13.2.4. Others
13.3. Latin America Viscosity Index Improvers Market Volume (Kilo Tons) & Value (US$ Mn) Analysis & Forecast, by End-user Industry
13.3.1. Automotive
13.3.1.1. Private Vehicles
13.3.1.2. Commercial Vehicles
13.3.2. Off-road Vehicles
13.3.3. Industrial Machinery
13.3.4. Others
13.4. Brazil Viscosity Index Improvers Market Volume (Kilo Tons) & Value (US$ Mn) Forecast, by Type
13.4.1. Polymethacrylate
13.4.2. Olefin Copolymer
13.4.3. Polyisobutylene
13.4.4. Others
13.5. Brazil Viscosity Index Improvers Market Volume (Kilo Tons) & Value (US$ Mn) Forecast, by End-user Industry
13.5.1. Automotive
13.5.1.1. Private Vehicles
13.5.1.2. Commercial Vehicles
13.5.2. Off-road Vehicles
13.5.3. Industrial Machinery
13.5.4. Others
13.6 Mexico Viscosity Index Improvers Market Volume (Kilo Tons) & Value (US$ Mn) Forecast, by Type
13.6.1. Polymethacrylate
13.6.2. Olefin Copolymer
13.6.3. Polyisobutylene
13.6.4. Others
13.7. Mexico Viscosity Index Improvers Market Volume (Kilo Tons) & Value (US$ Mn) Forecast, by End-user Industry
13.7.1. Automotive
13.7.1.1. Private Vehicles
13.7.1.2. Commercial Vehicles
13.7.2. Off-road Vehicles
13.7.3. Industrial Machinery
13.7.4. Others
13.8. Rest of Latin America Viscosity Index Improvers Market Volume (Kilo Tons) & Value (US$ Mn) Forecast, by Type
13.8.1. Polymethacrylate
13.8.2. Olefin Copolymer
13.8.3. Polyisobutylene
13.8.4. Others
13.9. Rest of Latin America Viscosity Index Improvers Market Volume (Kilo Tons) & Value (US$ Mn) Forecast, by End-user Industry
13.9.1. Automotive
13.9.1.1. Private Vehicles
13.9.1.2. Commercial Vehicles
13.9.2. Off-road Vehicles
13.9.3. Industrial Machinery
13.9.4. Others
13.4. Latin America Viscosity Index Improvers Market Attractiveness Analysis
13.10.1. By Type
13.10.2. By End-user Industry
13.10.3. By Country/Sub-region
14. Competition Landscape
14.1. Global Viscosity Index Improvers Market Share Analysis, by Company (2017)
14.2. Competition Matrix
14.3. Market Footprint Analysis, 2017
14.4. Company Profiles
14.4.1. The Lubrizol Corporation
14.4.1.1. Company Description
14.4.1.2. Business Overview
14.4.1.3. Financial Overview
14.4.1.4. Strategic Overview
14.4.2. Chevron Oronite Company LLC
14.4.2.1. Company Description
14.4.2.2. Business Overview
14.4.2.3. Strategic Overview
14.4.3. Infineum International Limited
14.4.3.1. Company Description
14.4.3.2. Business Overview
14.4.4. Evonik Industries
14.4.4.1. Company Description
14.4.4.2. Business Overview
14.4.4.3. Financial Overview
14.4.4.4. Strategic Overview
14.4.5. Afton Chemical
14.4.5.1. Company Description
14.4.5.2. Business Overview
14.4.5.3. Strategic Overview
14.4.6. Nanjing Runyou Chemical industry Additive Co., Ltd.
14.4.6.1. Company Description
14.4.6.2. Business Overview
14.4.7. Shenyang Great Wall Lubricating Oil Manufacturing Co., Ltd.
14.4.7.1. Company Description
14.4.7.2. Business Overview
14.4.8. Sanyo Chemical Industries, Ltd.
14.4.8.1. Company Description
14.4.8.2. Business Overview
14.4.8.3. Financial Overview
14.4.8.4. Strategic Overview
List of Tables
Table 01: Global Viscosity Index Improvers Market Volume (Kilo Tons) Forecast, by Type, 2017–2026
Table 02: Global Viscosity Index Improvers Market Value (US$ Mn) Forecast, by Type, 2017–2026
Table 03: Global Viscosity Index Improvers Market Volume (Kilo Tons) Forecast, by End-user Industry, 2017–2026
Table 04: Global Viscosity Index Improvers Market Value (US$ Mn) Forecast, by End-user Industry, 2017–2026
Table 05: Global Viscosity Index Improvers Market Volume (Kilo Tons) Forecast, by Region, 2017–2026
Table 06: Global Viscosity Index Improvers Market Value (US$ Mn) Forecast, by Region, 2017–2026
Table 07: North America Viscosity Index Improvers Market Volume (Kilo Tons) Forecast, by Type, 2017–2026
Table 08: North America Viscosity Index Improvers Market Value (US$ Mn) Forecast, by Type, 2017–2026
Table 09: North America Viscosity Index Improvers Market Volume (Kilo Tons) Forecast, by End-user Industry, 2017–2026
Table 10: North America Viscosity Index Improvers Market Value (US$ Mn) Forecast, by End-user Industry, 2017–2026
Table 11: North America Viscosity Index Improvers Market Volume (Kilo Tons) Forecast, by Country, 2017–2026
Table 12: North America Viscosity Index Improvers Market Value (US$ Mn) Forecast, by Country, 2017–2026
Table 13: U.S. Viscosity Index Improvers Market Volume (Kilo Tons) Forecast, by Type, 2017–2026
Table 14: U.S. Viscosity Index Improvers Market Value (US$ Mn) Forecast, by Type, 2017–2026
Table 15: U.S. Viscosity Index Improvers Market Volume (Kilo Tons) Forecast, by End-user Industry, 2017–2026
Table 16: U.S. Viscosity Index Improvers Market Value (US$ Mn) Forecast, by End-user Industry, 2017–2026
Table 17: Canada Viscosity Index Improvers Market Volume (Kilo Tons) Forecast, by Type, 2017–2026
Table 18: Canada Viscosity Index Improvers Market Value (US$ Mn) Forecast, by Type, 2017–2026
Table 19: Canada Viscosity Index Improvers Market Volume (Kilo Tons) Forecast, by End-user Industry, 2017–2026
Table 20: Canada Viscosity Index Improvers Market Value (US$ Mn) Forecast, by End-user Industry, 2017–2026
Table 21: Europe Viscosity Index Improvers Market Volume (Kilo Tons) Forecast, by Type, 2017–2026
Table 22: Europe Viscosity Index Improvers Market Value (US$ Mn) Forecast, by Type, 2017–2026
Table 23: Europe Viscosity Index Improvers Market Volume (Kilo Tons) Forecast, by End-user Industry, 2017–2026
Table 24: Europe Viscosity Index Improvers Market Value (US$ Mn) Forecast, by End-user Industry, 2017–2026
Table 25: Europe Viscosity Index Improvers Market Volume (Kilo Tons) Forecast, by Country/Sub-region, 2017–2026
Table 26: Europe Viscosity Index Improvers Market Value (US$ Mn) Forecast, by Country/Sub-region, 2017–2026
Table 27: Germany Viscosity Index Improvers Market Volume (Kilo Tons) Forecast, by Type, 2017–2026
Table 28: Germany Viscosity Index Improvers Market Value (US$ Mn) Forecast, by Type, 2017–2026
Table 29: Germany Viscosity Index Improvers Market Volume (Kilo Tons) Forecast, by End-user Industry, 2017–2026
Table 30: Germany Viscosity Index Improvers Market Value (US$ Mn) Forecast, by End-user Industry, 2017–2026
Table 31: France Viscosity Index Improvers Market Volume (Kilo Tons) Forecast, by Type, 2017–2026
Table 32: France Viscosity Index Improvers Market Value (US$ Mn) Forecast, by Type, 2017–2026
Table 33: France Viscosity Index Improvers Market Volume (Kilo Tons) Forecast, by End-user Industry, 2017–2026
Table 34: France Viscosity Index Improvers Market Value (US$ Mn) Forecast, by End-user Industry, 2017–2026
Table 35: U.K. Viscosity Index Improvers Market Volume (Kilo Tons) Forecast, by Type, 2017–2026
Table 36: U.K. Viscosity Index Improvers Market Value (US$ Mn) Forecast, by Type, 2017–2026
Table 37: U.K. Viscosity Index Improvers Market Volume (Kilo Tons) Forecast, by End-user Industry, 2017–2026
Table 38: U.K. Viscosity Index Improvers Market Value (US$ Mn) Forecast, by End-user Industry, 2017–2026
Table 39: Italy Viscosity Index Improvers Market Volume (Kilo Tons) Forecast, by Type, 2017–2026
Table 40: Italy Viscosity Index Improvers Market Value (US$ Mn) Forecast, by Type, 2017–2026
Table 41: Italy Viscosity Index Improvers Market Volume (Kilo Tons) Forecast, by End-user Industry, 2017–2026
Table 42: Italy Viscosity Index Improvers Market Value (US$ Mn) Forecast, by End-user Industry, 2017–2026
Table 43: Spain Viscosity Index Improvers Market Volume (Kilo Tons) Forecast, by Type, 2017–2026
Table 44: Spain Viscosity Index Improvers Market Value (US$ Mn) Forecast, by Type, 2017–2026
Table 45: Spain Viscosity Index Improvers Market Volume (Kilo Tons) Forecast, by End-user Industry, 2017–2026
Table 46: Spain Viscosity Index Improvers Market Value (US$ Mn) Forecast, by End-user Industry, 2017–2026
Table 47: Russia & CIS Viscosity Index Improvers Market Volume (Kilo Tons) Forecast, by Type, 2017–2026
Table 48: Russia & CIS Viscosity Index Improvers Market Value (US$ Mn) Forecast, by Type, 2017–2026
Table 49: Russia & CIS Viscosity Index Improvers Market Volume (Kilo Tons) Forecast, by End-user Industry, 2017–2026
Table 50: Russia & CIS Viscosity Index Improvers Market Value (US$ Mn) Forecast, by End-user Industry, 2017–2026
Table 51: Rest of Europe Viscosity Index Improvers Market Volume (Kilo Tons) Forecast, by Type, 2017–2026
Table 52: Rest of Europe Viscosity Index Improvers Market Value (US$ Mn) Forecast, by Type, 2017–2026
Table 53: Rest of Europe Viscosity Index Improvers Market Volume (Kilo Tons) Forecast, by End-user Industry, 2017–2026
Table 54: Rest of Europe Viscosity Index Improvers Market Value (US$ Mn) Forecast, by End-user Industry, 2017–2026
Table 55: Asia Pacific Viscosity Index Improvers Market Volume (Kilo Tons) Forecast, by Type, 2017–2026
Table 56: Asia Pacific Viscosity Index Improvers Market Value (US$ Mn) Forecast, by Type, 2017–2026
Table 57: Asia Pacific Viscosity Index Improvers Market Volume (Kilo Tons) Forecast, by End-user Industry, 2017–2026
Table 58: Asia Pacific Viscosity Index Improvers Market Value (US$ Mn) Forecast, by End-user Industry, 2017–2026
Table 59: Asia Pacific Viscosity Index Improvers Market Volume (Kilo Tons) Forecast, by Country and Sub-region, 2017–2026
Table 60: Asia Pacific Viscosity Index Improvers Market Value (US$ Mn) Forecast, by Country and Sub-region, 2017–2026
Table 61: China Viscosity Index Improvers Market Volume (Kilo Tons) Forecast, by Type, 2017–2026
Table 62: China Viscosity Index Improvers Market Value (US$ Mn) Forecast, by Type, 2017–2026
Table 63: China Viscosity Index Improvers Market Volume (Kilo Tons) Forecast, by End-user Industry, 2017–2026
Table 64: China Viscosity Index Improvers Market Value (US$ Mn) Forecast, by End-user Industry, 2017–2026
Table 65: India Viscosity Index Improvers Market Volume (Kilo Tons) Forecast, by Type, 2017–2026
Table 66: India Viscosity Index Improvers Market Value (US$ Mn) Forecast, by Type, 2017–2026
Table 67: India Viscosity Index Improvers Market Volume (Kilo Tons) Forecast, by End-user Industry, 2017–2026
Table 68: India Viscosity Index Improvers Market Value (US$ Mn) Forecast, by End-user Industry, 2017–2026
Table 69: Japan Viscosity Index Improvers Market Volume (Kilo Tons) Forecast, by Type, 2017–2026
Table 70: Japan Viscosity Index Improvers Market Value (US$ Mn) Forecast, by Type, 2017–2026
Table 71: Japan Viscosity Index Improvers Market Volume (Kilo Tons) Forecast, by End-user Industry, 2017–2026
Table 72: Japan Viscosity Index Improvers Market Value (US$ Mn) Forecast, by End-user Industry, 2017–2026
Table 73: ASEAN Viscosity Index Improvers Market Volume (Kilo Tons) Forecast, by Type, 2017–2026
Table 74: ASEAN Viscosity Index Improvers Market Value (US$ Mn) Forecast, by Type, 2017–2026
Table 75: ASEAN Viscosity Index Improvers Market Volume (Kilo Tons) Forecast, by End-user Industry, 2017–2026
Table 76: ASEAN Viscosity Index Improvers Market Value (US$ Mn) Forecast, by End-user Industry, 2017–2026
Table 77: Rest of Asia Pacific Viscosity Index Improvers Market Volume (Kilo Tons) Forecast, by Type, 2017–2026
Table 78: Rest of Asia Pacific Viscosity Index Improvers Market Value (US$ Mn) Forecast, by Type, 2017–2026
Table 79: Rest of Asia Pacific Viscosity Index Improvers Market Volume (Kilo Tons) Forecast, by End-user Industry, 2017–2026
Table 80: Rest of Asia Pacific Viscosity Index Improvers Market Value (US$ Mn) Forecast, by End-user Industry, 2017–2026
Table 81: Middle East & Africa Viscosity Index Improvers Market Volume (Kilo Tons) Forecast, by Type, 2017–2026
Table 82: Middle East & Africa Viscosity Index Improvers Market Value (US$ Mn) Forecast, by Type, 2017–2026
Table 83: Middle East & Africa Viscosity Index Improvers Market Volume (Kilo Tons) Forecast, by End-user Industry, 2017–2026
Table 84: Middle East & Africa Viscosity Index Improvers Market Value (US$ Mn) Forecast, by End-user Industry, 2017–2026
Table 85: Middle East & Africa Viscosity Index Improvers Market Volume (Kilo Tons) Forecast, by Country and Sub-region, 2017–2026
Table 86: Middle East & Africa Viscosity Index Improvers Market Value (US$ Mn) Forecast, by Country and Sub-region, 2017–2026
Table 87: GCC Viscosity Index Improvers Market Volume (Kilo Tons) Forecast, by Type, 2017–2026
Table 88: GCC Viscosity Index Improvers Market Value (US$ Mn) Forecast, by Type, 2017–2026
Table 89: GCC Viscosity Index Improvers Market Volume (Kilo Tons) Forecast, by End-user Industry, 2017–2026
Table 90: GCC Viscosity Index Improvers Market Value (US$ Mn) Forecast, by End-user Industry, 2017–2026
Table 91: South Africa Viscosity Index Improvers Market Volume (Kilo Tons) Forecast, by Type, 2017–2026
Table 92: South Africa Viscosity Index Improvers Market Value (US$ Mn) Forecast, by Type, 2017–2026
Table 93: South Africa Viscosity Index Improvers Market Volume (Kilo Tons) Forecast, by End-user Industry, 2017–2026
Table 94: South Africa Viscosity Index Improvers Market Value (US$ Mn) Forecast, by End-user Industry, 2017–2026
Table 95: Rest of Middle East & Africa Viscosity Index Improvers Market Volume (Kilo Tons) Forecast, by Type, 2017–2026
Table 96: Rest of Middle East & Africa Viscosity Index Improvers Market Value (US$ Mn) Forecast, by Type, 2017–2026
Table 97: Rest of Middle East & Africa Viscosity Index Improvers Market Volume (Kilo Tons) Forecast, by End-user Industry, 2017–2026
Table 98: Rest of Middle East & Africa Viscosity Index Improvers Market Value (US$ Mn) Forecast, by End-user Industry, 2017–2026
Table 99: Latin America Viscosity Index Improvers Market Volume (Kilo Tons) Forecast, by Type, 2017–2026
Table 100: Latin America Viscosity Index Improvers Market Value (US$ Mn) Forecast, by Type, 2017–2026
Table 101: Latin America Viscosity Index Improvers Market Volume (Kilo Tons) Forecast, by End-user Industry, 2017–2026
Table 102: Latin America Viscosity Index Improvers Market Value (US$ Mn) Forecast, by End-user Industry, 2017–2026
Table 103: Latin America Viscosity Index Improvers Market Volume (Kilo Tons) Forecast, by Country and Sub-region, 2017–2026
Table 104: Latin America Viscosity Index Improvers Market Value (US$ Mn) Forecast, by Country and Sub-region, 2017–2026
Table 105: Brazil Viscosity Index Improvers Market Volume (Kilo Tons) Forecast, by Type, 2017–2026
Table 106: Brazil Viscosity Index Improvers Market Value (US$ Mn) Forecast, by Type, 2017–2026
Table 107: Brazil Viscosity Index Improvers Market Volume (Kilo Tons) Forecast, by End-user Industry, 2017–2026
Table 108: Brazil Viscosity Index Improvers Market Value (US$ Mn) Forecast, by End-user Industry, 2017–2026
Table 109: Mexico Viscosity Index Improvers Market Volume (Kilo Tons) Forecast, by Type, 2017–2026
Table 110: Mexico Viscosity Index Improvers Market Value (US$ Mn) Forecast, by Type, 2017–2026
Table 111: Mexico Viscosity Index Improvers Market Volume (Kilo Tons) Forecast, by End-user Industry, 2017–2026
Table 112: Mexico Viscosity Index Improvers Market Value (US$ Mn) Forecast, by End-user Industry, 2017–2026
Table 113: Rest of Latin America Viscosity Index Improvers Market Volume (Kilo Tons) Forecast, by Type, 2017–2026
Table 114: Rest of Latin America Viscosity Index Improvers Market Value (US$ Mn) Forecast, by Type, 2017–2026
Table 115: Rest of Latin America Viscosity Index Improvers Market Volume (Kilo Tons) Forecast, by End-user Industry, 2017–2026
Table 116: Rest of Latin America Viscosity Index Improvers Market Value (US$ Mn) Forecast, by End-user Industry, 2017–2026
List of Figures
Figure 01: Global Viscosity Index Improvers Market Revenue (US$ Mn) Forecast, 2017–2026
Figure 02: Global Viscosity Index Improvers Market Value Share Analysis, by Type, 2017 and 2026
Figure 03: Global Viscosity Index Improvers Market Attractiveness Analysis, by Type, 2017
Figure 04: Global Viscosity Index Improvers Market Value Share Analysis, by End-user Industry, 2017 and 2026
Figure 05: Global Viscosity Index Improvers Market Attractiveness Analysis, by End-user Industry, 2017
Figure 06: Global Viscosity Index Improvers Market Value Share Analysis, by Region, 2017 and 2026
Figure 07: Global Viscosity Index Improvers Market Attractiveness Analysis, by Region, 2017
Figure 08: North America Viscosity Index Improvers Market Value Share Analysis, by Type, 2017 and 2026
Figure 09: North America Viscosity Index Improvers Market Value Share Analysis, by End-user Industry, 2017 and 2026
Figure 10: North America Viscosity Index Improvers Market Value Share Analysis, by Country, 2017 and 2026
Figure 11: North America Viscosity Index Improvers Market Value Share Analysis, by Type, 2017
Figure 12: North America Viscosity Index Improvers Market Value Share Analysis, by End-user Industry, 2017
Figure 13: North America Viscosity Index Improvers Market Attractiveness Analysis, by Country, 2017
Figure 14: Europe Viscosity Index Improvers Market Value Share Analysis, by Type, 2017 and 2026
Figure 15: Europe Viscosity Index Improvers Market Value Share Analysis, by End-user Industry, 2017 and 2026
Figure 16: Europe Viscosity Index Improvers Market Value Share Analysis, by Country/Sub-region, 2017 and 2026
Figure 17: Europe Viscosity Index Improvers Market Value Share Analysis, by Type, 2017
Figure 18: Europe Viscosity Index Improvers Market Value Share Analysis, by End-user Industry, 2017
Figure 19: Europe Viscosity Index Improvers Market Attractiveness Analysis, by Country and Sub-region, 2017
Figure 20: Asia Pacific Viscosity Index Improvers Market Value Share Analysis, by Type, 2017 and 2026
Figure 21: Asia Pacific Viscosity Index Improvers Market Value Share Analysis, by End-user Industry, 2017 and 2026
Figure 22: Asia Pacific Viscosity Index Improvers Market Value Share Analysis, by Country and Sub-region, 2017 and 2026
Figure 23: Asia Pacific Viscosity Index Improvers Market Value Share Analysis, by Type, 2017
Figure 24: Asia Pacific Viscosity Index Improvers Market Value Share Analysis, by End-user Industry, 2017
Figure 25: Asia Pacific Viscosity Index Improvers Market Attractiveness Analysis, by Country and Sub-region, 2017
Figure 26: Middle East & Africa Viscosity Index Improvers Market Value Share Analysis, by Type, 2017 and 2026
Figure 27: Middle East & Africa Viscosity Index Improvers Market Value Share Analysis, by End-user Industry, 2017 and 2026
Figure 28: Middle East & Africa Viscosity Index Improvers Market Value Share Analysis, by Country/Sub-region, 2017 and 2026
Figure 29: Middle East & Africa Viscosity Index Improvers Market Value Share Analysis, by Type, 2017
Figure 30: Middle East & Africa Viscosity Index Improvers Market Value Share Analysis, by End-user Industry, 2017
Figure 31: Middle East & Africa Viscosity Index Improvers Market Attractiveness Analysis, by Country and Sub-region , 2017
Figure 32: Latin America Viscosity Index Improvers Market Value Share Analysis, by Type, 2017 and 2026
Figure 33: Latin America Viscosity Index Improvers Market Value Share Analysis, by End-user Industry, 2017 and 2026
Figure 34: Latin America Viscosity Index Improvers Market Value Share Analysis, by Country and Sub-region, 2017 and 2026
Figure 35: Latin America Viscosity Index Improvers Market Value Share Analysis, by Type, 2017
Figure 36: Latin America Viscosity Index Improvers Market Value Share Analysis, by End-user Industry, 2017
Figure 37: Latin America Viscosity Index Improvers Market Attractiveness Analysis, by Country and Sub-region, 2017
Figure 38: Global Viscosity Index Improvers Market Share Analysis, by Company (2017)
Figure 39: Market Footprint Analysis, by Region
Copyright © Transparency Market Research, Inc. All Rights reserved
Trust Online


Viscosity Index Improvers Market