
The tech industry has been facing difficulties with the outbreak of the novel coronavirus (COVID-19), particularly delayed shipments that are anticipated to slow down the growth for the semiconductor IP market. Daily volatile changes pose unique challenges for semiconductor IP companies. Hence, manufacturers are carefully assessing different sectors of the semiconductor IP field to optimize costs and streamline shipments throughout supply chains. On the other hand, the growing number of unemployed individuals worldwide is another restraining factor directly affecting consumer spending.
Semiconductor IP companies are strategizing on optimizing production activities in the upcoming months. However, the volume of semiconductor IP products is anticipated to fall in the near future, which may affect the revenue generation of companies. As such, companies in the semiconductor IP market are increasing their focus on design activities in order to maintain cash flow in the market landscape.
Request a sample to get extensive insights into the Semiconductor IP Market
Semiconductor IPs (Intellectual Property) are being used to improve the functionality of IoT (Internet of Things) products. For instance, Palma Ceia SemiDesign-a semiconductor company providing modem chips has joined forces with Agile Analog, a provider of semiconductor analog IP, to acquire proficiency in next-gen Wi-Fi and cellular IoT products. This is being achieved with the help of data converter and power management IP that helps to deploy optimum performance in IoT products, whilst minimizing time and cost to the market.
To understand how our report can bring a difference to your business strategy, Ask for a brochure
Companies in the semiconductor IP market are increasing their production capabilities for data convertor IPs, as these IPs connect the real world with the digital world. High performance and low power data conversion in configurable analog-to-digital (ADC) and digital-to-analog (DAC) environments has been made possible with data convertor IPs. As such, companies in the semiconductor IP market are casting their interest in wireless products that are being integrated with power supply management functionalities.
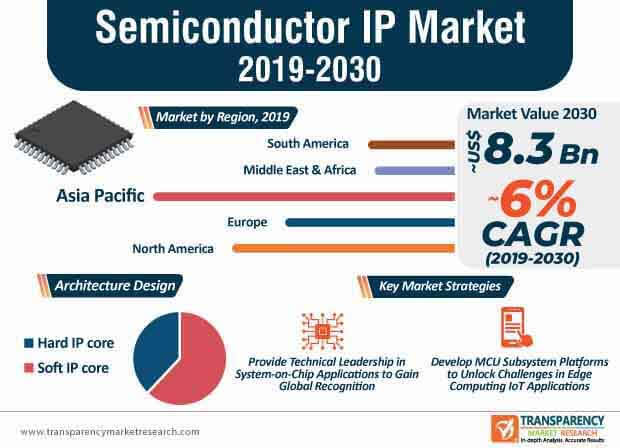
Technological innovations and world-class product quality are helping manufacturers in the semiconductor IP market to gain global recognition. For instance, in June 2020, Arteris IP-a leading supplier of silicon-proven network-on-chip (NoC) interconnect IP, announced that the company is gaining world recognition by achieving a significant rank in the 2020 IPnest Semiconductor Design IP Report. Companies are providing the semiconductor industry with technical leadership by offering sophisticated and important systems-on-chip.
Companies in the semiconductor IP market are broadening their revenue streams by tapping into leading applications, such as the automotive, machine learning (ML), and 5G infrastructure. This explains why the market is estimated to expand at a favorable CAGR of ~6% during the assessment period. Manufacturers are acquiring proficiency in the on-chip interconnect IP sector to support the management of on-chip dataflows.
The semiconductor IP market is witnessing significant changes with a growing number of strategic alliance programs. For instance, Omni Design Technologies-a provider of high-performance, low-power mixed-signal IP solutions, has joined the TSMC’s (Taiwan Semiconductor Manufacturing Company) Open Innovation Alliance program, which involves the participation of leading IP companies. As such, manufacturers are innovating in silicon-verified and foundry-specific IP solutions. Increasing demand for ultra-low power ADC and DAC solutions has catalyzed the demand for semiconductor IPs.
The semiconductor IP market is expected to reach a revenue of US$ 8.3 Bn by 2030. However, challenges in the 5G, automotive, and IoT segments are likely to inhibit the market growth. Hence, companies should introduce alliance programs to give rise to more comprehensive design technology infrastructures that help to reduce design barriers.
Companies in the semiconductor IP market are increasing efforts to address the challenges of data processing for edge computing IoT applications. For instance, in June 2020, Dolphin Design-a provider of semiconductor IP and design platforms unveiled CHAMELEON, an event-based MCU (Microcontroller Unit) subsystem platform, which helps to unlock the limitations associated with edge computing IoT applications. This is due to several limitations of traditional MCU architectures. Thus, in order to keep pace with the rapid growth of edge computing, semiconductor IP companies are innovating in MCU subsystem platforms.
In addition, manufacturers are adopting the CPU-less and event-based data management system approach to overcome limitations in edge computing IoT applications. Companies in the semiconductor IP market are developing MCU subsystem platforms that are compatible with any CPU, DSP (Digital Signal Processor), and NPU (Neural Processing Unit).
Semiconductor analog IP providers are collaborating with other market players to improve the quality and reliability of microchips. Companies in the semiconductor IP market are teaming up with providers of custom ASIC (Application-specific Integrated Circuit) designs to fabricate and test analog IP products. This helps manufacturers to validate their product delivery processes for end customers. System on a chip (SOC) development holds promising potentials to speed up the process of proving and qualifying analog IPs, which helps to reduce the time-to-market.
The integration of analog IP onto complex silicon chips is a potentially time-consuming process and may be further exacerbated by the variable quality of analog IP products. Hence, companies in the semiconductor IP market are developing in-house systems that automatically generate analog IP product deliverables, while maintaining the highest quality in products.
Stuck in a neck-to-neck competition with other brands? Request a custom report on Semiconductor IP Market
Analysts’ Viewpoint
Long-term trends such as digitalization across industries, such as healthcare, automotive, and telecom are anticipated to keep companies in business during and post the COVID-19 pandemic. Fast-growing IP vendors in the semiconductor IP market are providing high-quality products that are being used in complex SoC designs. However, limitations in traditional MCU subsystems are restraining manufacturers from advancing in edge computing IoT applications. Hence, companies should develop advanced MCU subsystems with high bandwidth access and data processing capabilities to innovate in the fast-growing edge computing IoT sector. They should introduce alliance programs to increase the availability of foundry-specific IPs.
Proprietary IP blocks can be security practices, wireless designs, alternatives on USB modules, and re-spins on memory controllers. These are used in consumer electronics prominently where primary components are SoC designs and can be availed by procuring a license. Thus, increasing need for SoC designs in consumer electronics is expected to drive the semiconductor IP market during the forecast period.
Moreover, processor IP core reduces power consumption and optimizes hardware performance. Hardware performance increases as the space captured by a single processor is reduced due to use of multicore processors. In line with the same, Synopsys Inc. is in partnership with Broadcom to deliver ARC processor IP Cores which enable them to provide advanced video compression capabilities in SoCs for high-volume consumer devices. Thus, multicore processor IPs are being adopted rapidly to improve the efficiency of hardware and to optimize performance of end-products. Hence, various processor IP cores are needed to develop embedded multiprocessor core technologies, which are used in a wide range of applications such as connected devices that include smartphones, wearable devices, and desktops.
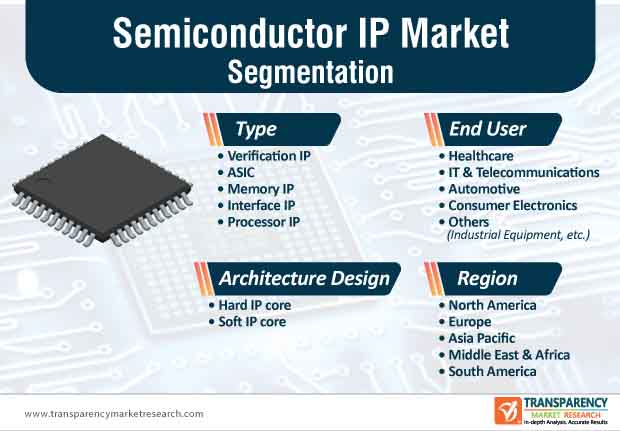
Semiconductor IP Market – Segmentation
TMR’s study on the semiconductor IP market includes information divided into four sections - type, architecture design, end-user, and region. Changing industry trends and other crucial market dynamics associated with these sections of the semiconductor IP market have been discussed in detail.
|
Type |
|
|
Architecture Design |
|
|
End User |
|
|
Region |
|
1. Preface
1.1. Market Introduction
1.2. Market Segmentation
1.3. Key Research Objectives
2. Assumptions and Research Methodology
2.1. Research Methodology
2.1.1. List of Primary and Secondary Sources
2.2. Key Assumptions for Data Modelling
3. Executive Summary - Global Semiconductor IP Market
4. Market Overview
4.1. Market Definition
4.2. Macroeconomic Factors
4.2.1. World GDP Indicator – For Top Economies
4.2.2. Global ICT Spending (US$ Mn)
4.3. Market Factor Analysis
4.3.1. Forecast Factors
4.3.2. Ecosystem/ Value Chain Analysis
4.3.3. Market Dynamics (Growth Influencers)
4.3.3.1. Drivers
4.3.3.2. Restraints
4.3.3.3. Opportunities
4.3.3.4. Impact Analysis of Drivers and Restraints
4.4. Market Opportunity Assessment – by Region (North America/ Europe/ Asia Pacific/ Middle East & Africa/ South America)
4.4.1. By Type
4.4.2. By Architecture Design
4.4.3. By End-user
4.5. Competitive Scenario and Trends
4.5.1. Semiconductor IP Market Concentration Rate
4.5.1.1. List of Emerging, Prominent and Leading Players
4.5.2. Mergers & Acquisitions, Expansions
4.6. Analysis of Semiconductor IP, by Form Factor
4.6.1. Integrated Circuit IP
4.6.1.1. General Purpose IC IP
4.6.1.2. Application-specific IC IP
4.6.1.3. Programmable IC IP
4.6.1.4. Digital IC IP
4.6.1.5. Analog & Mixed Signal IC IP
4.6.1.6. Memory IC
4.6.2. System on Chip (SOC) IP
4.7. Impact Analysis of COVID-19 on the Semiconductor IP Market
4.7.1. By Region
4.7.1.1. North America
4.7.1.2. Europe
4.7.1.3. Asia Pacific
4.7.1.4. Middle East & Africa
4.7.1.5. South America
4.7.2. End-user Sentiment Analysis: Comparative Analysis on Spending
4.7.2.1. Increase in Spending
4.7.2.2. Decrease in Spending
4.7.3. Short Term and Long Term Impact on the Market
4.7.4. Recovery Period
4.8. Market Outlook
5. Global Semiconductor IP Market Analysis and Forecast
5.1.1. Market Revenue Analysis (US$ Mn), 2015-2030
5.1.1.1. Historic Growth Trends, 2015-2019
5.1.1.2. Forecast Trends, 2020-2030
6. Global Semiconductor IP Market Analysis, by Type
6.1. Key Segment Analysis
6.2. Semiconductor IP Market Size (US$ Mn) Forecast, by Type, 2018 - 2030
6.2.1. Verification IP
6.2.2. ASIC
6.2.3. Memory IP
6.2.4. Interface IP
6.2.5. Processor IP
7. Global Semiconductor IP Market Analysis, by Architecture Design
7.1. Key Segment Analysis
7.2. Semiconductor IP Market Size (US$ Mn) Forecast, by Architecture Design, 2018 - 2030
7.2.1. Hard IP
7.2.2. Soft IP
8. Global Semiconductor IP Market Analysis, by End-user
8.1. Key Segment Analysis
8.2. Semiconductor IP Market Size (US$ Mn) Forecast, by End-user, 2018 - 2030
8.2.1. Healthcare
8.2.2. IT & Telecom
8.2.3. Automotive
8.2.4. Consumer Electronics
8.2.5. Others (Industrial Equipment, etc.)
9. Global Semiconductor IP Market Analysis and Forecast, By Region
9.1. Key Findings
9.2. Semiconductor IP Market Size (US$ Mn) Forecast, by Region, 2018 - 2030
9.2.1. North America
9.2.2. Europe
9.2.3. Asia Pacific
9.2.4. Middle East & Africa
9.2.5. South America
10. North America Semiconductor IP Market Analysis
10.1. Regional Outlook
10.2. Semiconductor IP Market Size (US$ Mn) Analysis and Forecast (2018 - 2030)
10.2.1. By Type
10.2.2. By Architecture Design
10.2.3. By End-user
10.3. Semiconductor IP Market Size (US$ Mn) Forecast, by Country, 2018 - 2030
10.3.1. U.S.
10.3.2. Canada
10.3.3. Mexico
11. Europe Semiconductor IP Market Analysis and Forecast
11.1. Regional Outlook
11.2. Semiconductor IP Market Size (US$ Mn) Analysis and Forecast (2018 - 2030)
11.2.1. By Type
11.2.2. By Architecture Design
11.2.3. By End-user
11.3. Semiconductor IP Market Size (US$ Mn) Forecast, by Country & Sub-region, 2018 - 2030
11.3.1. Germany
11.3.2. U.K.
11.3.3. France
11.3.4. Italy
11.3.5. Rest of Europe
12. APAC Semiconductor IP Market Analysis and Forecast
12.1. Regional Outlook
12.2. Semiconductor IP Market Size (US$ Mn) Analysis and Forecast (2018 - 2030)
12.2.1. By Type
12.2.2. By Architecture Design
12.2.3. By End-user
12.3. Semiconductor IP Market Size (US$ Mn) Forecast, by Country & Sub-region, 2018 - 2030
12.3.1. China
12.3.2. India
12.3.3. Japan
12.3.4. ASEAN
12.3.5. Rest of Asia Pacific
13. Middle East & Africa (MEA) Semiconductor IP Market Analysis and Forecast
13.1. Regional Outlook
13.2. Semiconductor IP Market Size (US$ Mn) Analysis and Forecast (2018 - 2030)
13.2.1. By Type
13.2.2. By Architecture Design
13.2.3. By End-user
13.3. Semiconductor IP Market Size (US$ Mn) Forecast, by Country & Sub-region, 2018 - 2030
13.3.1. United Arab Emirates
13.3.2. South Africa
13.3.3. Rest of Middle East & Africa
14. South America Semiconductor IP Market Analysis and Forecast
14.1. Regional Outlook
14.2. Semiconductor IP Market Size (US$ Mn) Analysis and Forecast (2018 - 2030)
14.2.1. By Type
14.2.2. By Architecture Design
14.2.3. By End-user
14.3. Semiconductor IP Market Size (US$ Mn) Forecast, by Country & Sub-region, 2018 - 2030
14.3.1. Brazil
14.3.2. Argentina
14.3.3. Rest of South America
15. Competition Landscape
15.1. Market Competition Matrix, by Leading Players
15.2. Market Revenue Share Analysis (%), by Leading Players (2019)
16. Company Profiles
16.1. Altera (Intel Corporation)
16.1.1. Business Overview
16.1.2. Product Portfolio
16.1.3. Geographical Footprint
16.1.4. Revenue and Strategy
16.2. Arm Limited
16.2.1. Business Overview
16.2.2. Product Portfolio
16.2.3. Geographical Footprint
16.2.4. Revenue and Strategy
16.3. Avery Design System
16.3.1. Business Overview
16.3.2. Product Portfolio
16.3.3. Geographical Footprint
16.3.4. Revenue and Strategy
16.4. Cadence Design Systems, Inc.
16.4.1. Business Overview
16.4.2. Product Portfolio
16.4.3. Geographical Footprint
16.4.4. Revenue and Strategy
16.5. Cast Inc.
16.5.1. Business Overview
16.5.2. Product Portfolio
16.5.3. Geographical Footprint
16.5.4. Revenue and Strategy
16.6. Ceva Inc.
16.6.1. Business Overview
16.6.2. Product Portfolio
16.6.3. Geographical Footprint
16.6.4. Revenue and Strategy
16.7. eSilicon Corporation
16.7.1. Business Overview
16.7.2. Product Portfolio
16.7.3. Geographical Footprint
16.7.4. Revenue and Strategy
16.8. Imagination Technologies Limited
16.8.1. Business Overview
16.8.2. Product Portfolio
16.8.3. Geographical Footprint
16.8.4. Revenue and Strategy
16.9. Kilopass Technology Inc.
16.9.1. Business Overview
16.9.2. Product Portfolio
16.9.3. Geographical Footprint
16.9.4. Revenue and Strategy
16.10. Mentor, a Siemens Business
16.10.1. Business Overview
16.10.2. Product Portfolio
16.10.3. Geographical Footprint
16.10.4. Revenue and Strategy
16.11. Open-Silicon, Inc.
16.11.1. Business Overview
16.11.2. Product Portfolio
16.11.3. Geographical Footprint
16.11.4. Revenue and Strategy
16.12. Rambus Inc.
16.12.1. Business Overview
16.12.2. Product Portfolio
16.12.3. Geographical Footprint
16.12.4. Revenue and Strategy
16.13. Silabtech Private Limited
16.13.1. Business Overview
16.13.2. Product Portfolio
16.13.3. Geographical Footprint
16.13.4. Revenue and Strategy
16.14. Synopsys Inc.
16.14.1. Business Overview
16.14.2. Product Portfolio
16.14.3. Geographical Footprint
16.14.4. Revenue and Strategy
17. Key Takeaways
List of Tables
Table No.1 Global Semiconductor IP Market Revenue (US$ Mn) and Forecast, by Type, 2018-2030
Table No.2 Global Semiconductor IP Market Revenue (US$ Mn) and Forecast, Architecture Design, 2018-2030
Table No.3 Global Semiconductor IP Market Revenue (US$ Mn) and Forecast by End-user, 2018-2030
Table No.4 Global Semiconductor IP Market Revenue (US$ Mn) and Forecast, by Region, 2018-2030
Table No.5 North America Semiconductor IP Market Revenue (US$ Mn) and Forecast, by Type, 2018-2030
Table No.6 North America Semiconductor IP Market Revenue (US$ Mn) and Forecast, Architecture Design, 2018-2030
Table No.7 North America Semiconductor IP Market Revenue (US$ Mn) and Forecast by End-user, 2018-2030
Table No.8 North America Semiconductor IP Market Revenue (US$ Mn) and Forecast, by Country, 2018-2030
Table No.9 Europe Semiconductor IP Market Revenue (US$ Mn) and Forecast, by Type, 2018-2030
Table No.10 Europe Semiconductor IP Market Revenue (US$ Mn) and Forecast, Architecture Design, 2018-2030
Table No.11 Europe Semiconductor IP Market Revenue (US$ Mn) and Forecast by End-user, 2018-2030
Table No.12 Europe Semiconductor IP Market Revenue (US$ Mn) and Forecast, by Country, 2018-2030
Table No.13 Asia Pacific Semiconductor IP Market Revenue (US$ Mn) and Forecast, by Type, 2018-2030
Table No.14 Asia Pacific Semiconductor IP Market Revenue (US$ Mn) and Forecast, Architecture Design, 2018-2030
Table No.15 Asia Pacific Semiconductor IP Market Revenue (US$ Mn) and Forecast by End-user, 2018-2030
Table No.16 Asia Pacific Semiconductor IP Market Revenue (US$ Mn) and Forecast, by Country, 2018-2030
Table No.17 Middle East & Africa Semiconductor IP Market Revenue (US$ Mn) and Forecast, by Type, 2018-2030
Table No.18 Middle East & Africa Semiconductor IP Market Revenue (US$ Mn) and Forecast, Architecture Design, 2018-2030
Table No.19 Middle East & Africa Semiconductor IP Market Revenue (US$ Mn) and Forecast by End-user, 2018-2030
Table No.20 Middle East and Africa (MEA) Semiconductor IP Market Revenue (US$ Mn) and Forecast, by Country, 2018-2030
Table No.21 South America Semiconductor IP Market Revenue (US$ Mn) and Forecast, by Type, 2018-2030
Table No.22 South America Semiconductor IP Market Revenue (US$ Mn) and Forecast, Architecture Design, 2018-2030
Table No.23 South America Semiconductor IP Market Revenue (US$ Mn) and Forecast by End-user, 2018-2030
Table No.24 South America Semiconductor IP Market Revenue (US$ Mn) and Forecast, by Country, 2018-2030
List of Figures
Figure No.1 Global Semiconductor IP Market Size (US$ Mn) Forecast, 2018 – 2030
Figure No.2 Global Semiconductor IP Market Revenue (US$ Mn) Opportunity Assessment, by Region, 2020E
Figure No.3 Global Semiconductor IP Market Revenue (US$ Mn) Opportunity Assessment, by Region, 2030F
Figure No.5 GDP (US$ Bn), Top Countries (2014 – 2019)
Figure No.6 Top Economies GDP Landscape, 2019
Figure No.8 Global ICT Spending (US$ Bn), Regional Contribution, 2019
Figure No.7 Global ICT Spending (%), by Region, 2019
Figure No.9 Global ICT Spending (US$ Bn), Spending Type Contribution, 2019
Figure No.10 Global ICT Spending (%), by Type, 2019
Figure No.11 Attractiveness Assessment, by Type
Figure No.12 Opportunity Assessment, by Type
Figure No.13 Attractiveness Assessment, by Architecture Design
Figure No.14 Opportunity Assessment, by Architecture Design
Figure No.15 Attractiveness Assessment, by End-user
Figure No.16 Opportunity Assessment, by End-user
Figure No.17 Attractiveness Assessment, by Region
Figure No.18 Opportunity Assessment, by Region
Figure No.20 Global Semiconductor IP Market, By Architecture Design, CAGR (%) (2020 – 2030)
Figure No.22 Global Semiconductor IP Market, By Region, CAGR (%) (2020 – 2030)
Figure No.19 Global Semiconductor IP Market, By Type, CAGR (%) (2020 – 2030)
Figure No.21 Global Semiconductor IP Market, By End-user, CAGR (%) (2020 – 2030)
Figure No.23 Global Semiconductor IP Market Historic Growth Trends (US$ Mn), 2015 – 2019
Figure No.24 Global Semiconductor IP Market Forecast Growth Trends (US$ Mn), 2020 – 2030
Figure No.25 Global Semiconductor IP Market Share Analysis, by Type, 2020
Figure No.26 Global Semiconductor IP Market Share Analysis, by Type, 2030
Figure No.27 Global Semiconductor IP Market Share Analysis, Architecture Design, 2020
Figure No.28 Global Semiconductor IP Market Share Analysis, Architecture Design, 2030
Figure No.29 Global Semiconductor IP Market Share Analysis, End-user, 2020
Figure No.30 Global Semiconductor IP Market Share Analysis, End-user, 2030
Figure No.31 Global Semiconductor IP Market Share Analysis, by Region, 2020
Figure No.32 Global Semiconductor IP Market Share Analysis, by Region, 2030
Figure No.33 North America Semiconductor IP Market Share Analysis, by Type, 2020
Figure No.34 North America Semiconductor IP Market Share Analysis, by Type, 2030
Figure No.35 North America Semiconductor IP Market Share Analysis, Architecture Design, 2020
Figure No.36 North America Semiconductor IP Market Share Analysis, Architecture Design, 2030
Figure No.37 North America Semiconductor IP Market Share Analysis, End-user, 2020
Figure No.38 North America Semiconductor IP Market Share Analysis, End-user, 2030
Figure No.39 North America Semiconductor IP Market Share Analysis, by Country, 2020
Figure No.40 North America Semiconductor IP Market Share Analysis, by Country, 2030
Figure No.41 Europe Semiconductor IP Market Share Analysis, by Type, 2020
Figure No.42 Europe Semiconductor IP Market Share Analysis, by Type, 2030
Figure No.43 Europe Semiconductor IP Market Share Analysis, Architecture Design, 2020
Figure No.44 Europe Semiconductor IP Market Share Analysis, Architecture Design, 2030
Figure No.45 Europe Semiconductor IP Market Share Analysis, End-user, 2020
Figure No.46 Europe Semiconductor IP Market Share Analysis, End-user, 2030
Figure No.47 Europe Semiconductor IP Market Share Analysis, by Country, 2020
Figure No.48 Europe Semiconductor IP Market Share Analysis, by Country, 2030
Figure No.49 Asia Pacific Semiconductor IP Market Share Analysis, by Type, 2020
Figure No.50 Asia Pacific Semiconductor IP Market Share Analysis, by Type, 2030
Figure No.51 Asia Pacific Semiconductor IP Market Share Analysis, Architecture Design, 2020
Figure No.52 Asia Pacific Semiconductor IP Market Share Analysis, Architecture Design, 2030
Figure No.53 Asia Pacific Semiconductor IP Market Share Analysis, End-user, 2020
Figure No.54 Asia Pacific Semiconductor IP Market Share Analysis, End-user, 2030
Figure No.55 Asia Pacific Semiconductor IP Market Share Analysis, by Country, 2020
Figure No.56 Asia Pacific Semiconductor IP Market Share Analysis, by Country, 2030
Figure No.57 Middle East & Africa Semiconductor IP Market Share Analysis, by Type, 2020
Figure No.58 Middle East & Africa Semiconductor IP Market Share Analysis, by Type, 2030
Figure No.59 Middle East & Africa Semiconductor IP Market Share Analysis, Architecture Design, 2020
Figure No.60 Middle East & Africa Semiconductor IP Market Share Analysis, Architecture Design, 2030
Figure No.61 Middle East & Africa Semiconductor IP Market Share Analysis, End-user, 2020
Figure No.62 Middle East & Africa Semiconductor IP Market Share Analysis, End-user, 2030
Figure No.63 Middle East and Africa (MEA) Semiconductor IP Market Share Analysis, by Country, 2020
Figure No.64 Middle East and Africa (MEA) Semiconductor IP Market Share Analysis, by Country, 2030
Figure No.65 South America Semiconductor IP Market Share Analysis, by Type, 2020
Figure No.66 South America Semiconductor IP Market Share Analysis, by Type, 2030
Figure No.67 South America Semiconductor IP Market Share Analysis, Architecture Design, 2020
Figure No.68 South America Semiconductor IP Market Share Analysis, Architecture Design, 2030
Figure No.69 South America Semiconductor IP Market Share Analysis, End-user, 2020
Figure No.70 South America Semiconductor IP Market Share Analysis, End-user, 2030
Figure No.71 South America Semiconductor IP Market Share Analysis, by Country, 2020
Figure No.72 South America Semiconductor IP Market Share Analysis, by Country, 2030
Copyright © Transparency Market Research, Inc. All Rights reserved
Trust Online


Semiconductor IP Market