
Analysts’ Viewpoint on Knitwear Market Scenario
Companies in the knitwear market are focusing on natural and eco-friendly materials to keep their businesses growing post the COVID-19 pandemic, as consumers nowadays are moving toward more sustainable products. Knitwear material is anti-wrinkle, has high absorption capacity, and good elasticity as compared to woven fabrics. Hence, there is an increase in demand for branded knitwear products. The growing demand for 3D-knitted garments is due to the rising adoption of 3D software, which helps in creating virtual images on clothing and saves time, energy, and money. Manufacturers should tap into incremental opportunities and focus on innovative & high-technology knitting machines, which can design products as per recent trends to broaden their revenue streams.
Knitwear are garments that are made using knitted fabrics. Knitwear are more comfortable and soft as compared to woven wear. They are made using natural, synthetic, and blended materials. Compared to woven fabrics, they possess better absorption capacity, elasticity, and wrinkle resistance properties, which make them a better material within the mentioned application segments. However, manufacturers in many countries are still unaware of the existence of this technology. Woven apparel is still a key type in the global apparel market. Companies in this market should increase their R&D in natural and eco-friendly knitwear products to enable wrinkle-resistant properties and fabric that requires low maintenance. Stiff competition with local companies catering to smaller regions who work on narrow margins and also provide personal support is expected to hamper the knitwear market during the forecast period. Nevertheless, it is possible to further reduce the price of knitwear and increase its penetration across the world with the development of innovative and high-technology knitting machines. This creates lucrative opportunities for manufacturers of knitwear.
Request a sample to get extensive insights into the Knitwear Market
Growing demand for different knitted sportswear (t-shirts, pants, shorts, socks, etc.) can be attributed to the increase in sports activities such as aerobics, athletics, football, and cricket. An increase in penetration of the Internet is further expected to drive the sports segment, and consequently the knitwear market during the forecast period.
The surging demand for knitwear is primarily due to its moisture-wicking ability, anti-wrinkle properties, easy breathability, etc. Furthermore, it is more comfortable and soft as compared to woven fabrics, which, in turn, is driving its demand in various applications. Knit fabrics resist wrinkles. Its water vapor transmission and good thermal insulation are required in sports clothing which helps to keep the wearer comfortable during workouts, exercise, and sports performance. Knitwear fabric has all these properties due to which its demand is projected to be more than other fabrics.
The growing demand for lightweight and high-performance clothing is driving the demand for different types of knitwear made from natural, synthetic, and blended materials. Knitwear products have better breathability, and chlorine resistance, are anti-tear, and have better durable materials. Furthermore, the application of knitted fabric has been growing in denim clothing as consumer preference is shifting more toward softer material in clothing with high compression, flexibility, and soft wear. The rising popularity of different types of knitwear, owing to increase in social media trends and Internet penetration, is boosting the demand for knitwear. Manufacturers catering to the demand of customers as per recent trends are launching different designs, patterns, trendy colors, and styles in knitwear such as letter pattern craft, asymmetric patchwork, and Scandi folk style, to strengthen the sense of fashion in knitwear for end-users, including men, women, and kids.
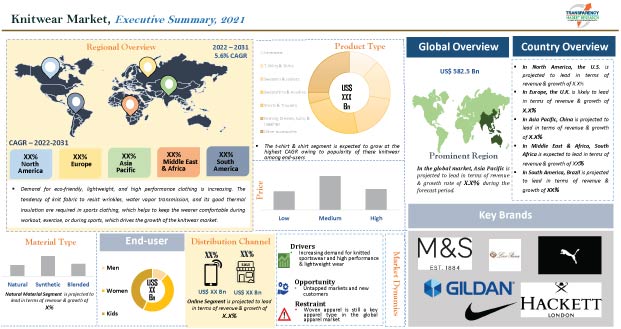
In terms of product type, the global knitwear market has been segmented into innerwear, t-shirts & shirts, jackets & sweaters, sweatshirts & hoodies, shorts & trousers, evening dresses, suits, & leggings, and others such as caps, scarves, gloves, socks, etc. T-shirts & shirts type and sweatshirts & hoodies of the knitwear market held a major share and are expected to grow at the highest CAGR during the forecast period.
Knitwear are classified into natural, synthetic, and blended, in terms of material type. The natural material segment dominates the global knitwear market. Furthermore, this segment is expected to register the highest CAGR during the forecast period. Rising demand for eco-friendly and recycled products, owing to increasing awareness regarding sustainability and anti-wrinkle & high absorption capacity of natural material has increased in demand for knitwear from natural material. However, rising cotton and yarn prices are a concern for many manufacturers; moreover, low technology awareness in many developing countries results in low production which could hamper the growth of the market. Thus, manufacturers are focusing on adopting machines that could increase their production capacity.
Asia Pacific held the largest volume share of the global knitwear market. The high share of the region can be ascribed to the large demand from China, Japan, India, etc. China accounts for almost one-third of the overall knitwear market in Asia Pacific. Rapidly changing fashion trends, along with affordability of the product at a competitive price point, comfort, style, etc., attracts customers in Asia Pacific to buy knitwear products.
North America and Europe are also key markets for knitwear. The popularity of knitwear among celebrities and consumers is expected to boost the demand for knitwear in these regions.
The knitwear market is fragmented due to the presence of several players. Competition is expected to intensify in the near future due to the entry of several local players. Manufacturers in the knitwear market are also focusing on style and classic designs, along with comfort, and promoting new designs periodically. Many companies are trying to meet the demand of the younger generation as per the latest trends by introducing fresh and quirky designs, while adhering to the quality of different knitwear.
Key players operating in the global knitwear market are Nike Inc., Adidas AG, Gap Inc., Fast Retailing Co., Ltd., Marks and Spencer Group plc., Gildan Activewear Inc., Hackett Ltd, Abercrombie & Fitch Co., Loro Piana S.P.A., Ralph Lauren Corp., Lactose, The Nautical Company (U.K.) Ltd., Victoria’s Secret, YOOX NET-A-PORTER GROUP, etc.
Each of these players has been profiled in the knitwear market report based on parameters such as company overview, financial overview, business strategies, product portfolio, business segments, and recent developments.
Request a custom report on Knitwear Market
|
Attribute |
Detail |
|
Market Size Value in 2021 |
US$ 582.5 Bn |
|
Market Forecast Value in 2031 |
US$ 998.6 Bn |
|
Growth Rate (CAGR) |
5.6% |
|
Forecast Period |
2022–2031 |
|
Historical Data Available for |
2017–2020 |
|
Quantitative Units |
US$ Bn for Value and Million Units for Volume |
|
Market Analysis |
Global qualitative analysis includes drivers, restraints, opportunities, key trends, upcoming key trends, Porter’s Five Forces analysis, value chain analysis, SWOT analysis, etc. Furthermore, at the regional level, qualitative analysis includes key trends, price trends, key supplier analysis, consumer buying behavior, and brand analysis. |
|
Competition Landscape |
|
|
Format |
Electronic (PDF) + Excel |
|
Market Segmentation |
|
|
Regions Covered |
|
|
Countries Covered |
|
|
Companies Profiled |
|
|
Customization Scope |
Available upon request |
|
Pricing |
Available upon request |
The knitwear market contributed US$ 582.5 Bn in 2021
The knitwear market is expected to reach US$ 998.6 Bn by 2031
The knitwear market is estimated to grow at a CAGR of 5.6% by 2031
Increasing demand for knitted sportswear, and high-performance & lightweight wear
Natural material segment contributed 39.5% share to the knitwear market in 2021
Asia Pacific is a more attractive region for vendors in the knitwear market, followed by North America and Europe
Adidas AG, GAP Inc., Gildan Activewear Inc., Hackett Limited, Hollister Co., Loro Piana S.p.A., Marks and Spencer plc., Nike Inc., Puma SE, Ralph Lauren Corporation, Lyle & Scott, The Lacoste Group, The Nautical Company (UK) Ltd, Uniqlo co., Ltd., Victoria’s Secret, and YOOX NET-A-PORTER GROUP S.P.A etc.
1. Preface
1.1. Market Definition and Scope
1.2. Market Segmentation
1.3. Key Research Objectives
1.4. Research Highlights
2. Assumptions
3. Research Methodology
4. Executive Summary
5. Market Overview
5.1. Introduction
5.2. Market Dynamics
5.2.1. Drivers
5.2.2. Restraints
5.2.3. Opportunities
5.3. Key Trends Analysis
5.3.1. Demand Side Analysis
5.3.2. Supply Side Analysis
5.4. Key Market Indicators
5.4.1. Overall Apparel Industry Overview
5.5. Porter’s Five Forces Analysis
5.6. Value Chain Analysis
5.7. Industry SWOT Analysis
5.8. Raw Material Analysis
5.9. Key Trends Analysis
5.9.1. Supplier Side
5.9.2. Demand Side
5.10. Global Knitwear Market Analysis and Forecast, 2017-2031
5.10.1. Market Revenue Projections (US$ Bn )
5.10.2. Market Volume Projections (Million Units)
6. Global Knitwear Market Analysis and Forecast, By Product Type
6.1. Knitwear Market Size (US$ Bn & Million Units) Forecast, By Product Type, 2017-2031
6.1.1. T-Shirts & Shirts
6.1.2. Jackets & Sweaters
6.1.3. Sweatshirts & Hoodies
6.1.4. Shorts & Trousers
6.1.5. Innerwear
6.1.6. Evening Dresses, Suits, & Leggings
6.1.7. Others
6.2. Incremental Opportunity, By Product Type
7. Global Knitwear Market Analysis and Forecast, By Material Type
7.1. Knitwear Market Size (US$ Bn & Million Units) Forecast, By Material Type , 2017-2031
7.1.1. Natural
7.1.2. Synthetic
7.1.3. Blended
7.2. Incremental Opportunity, By Material Type
8. Global Knitwear Market Analysis and Forecast, By Price Category
8.1. Knitwear Market Size (US$ Bn & Million Units) Forecast, By Price Category, 2017-2031
8.1.1. Low
8.1.2. Medium
8.1.3. High
8.2. Incremental Opportunity, By Price Category
9. Global Knitwear Market Analysis and Forecast, By End-user
9.1. Knitwear Market Size (US$ Bn & Million Units) Forecast, By End-user, 2017-2031
9.1.1. Men
9.1.2. Women
9.1.3. Kids
9.2. Incremental Opportunity, By End-user
10. Global Knitwear Market Analysis and Forecast, By Distribution Channel
10.1. Global Knitwear Market Size (US$ Bn & Million Units) Forecast, By Distribution Channel , 2017-2031
10.1.1. Online
10.1.1.1. E-commerce Website
10.1.1.2. Company Owned Websites
10.1.2. Offline
10.1.2.1. Specialty Stores
10.1.2.2. Departmental Stores
10.1.2.3. Other Retail Stores
10.2. Incremental Opportunity, By Distribution Channel
11. Global Knitwear Market Analysis and Forecast, By Region
11.1. Knitwear Market Size (US$ Bn & Million Units) Forecast, By Region, 2017-2031
11.1.1. North America
11.1.2. Europe
11.1.3. Asia-Pacific
11.1.4. Middle East & Africa
11.1.5. South America
11.2. Incremental Opportunity, By Region
12. North America Knitwear Market Analysis and Forecast
12.1. Regional Snapshot
12.2. Key Trends Analysis
12.2.1. Supplier Side
12.2.2. Demand Side
12.3. Brand Analysis
12.4. Key Supplier Analysis
12.5. Price Trend Analysis
12.5.1. Weighted Average Price
12.6. Consumer Buying Behavior
12.7. Knitwear Market Size (US$ Bn & Million Units) Forecast, By Product Type, 2017-2031
12.7.1. T-Shirts & Shirts
12.7.2. Jackets & Sweaters
12.7.3. Sweatshirts & Hoodies
12.7.4. Shorts & Trousers
12.7.5. Innerwear
12.7.6. Evening Dresses, Suits, & Leggings
12.7.7. Others
12.8. Knitwear Market Size (US$ Bn & Million Units) Forecast, By Material Type, 2017-2031
12.8.1. Natural
12.8.2. Synthetic
12.8.3. Blended
12.9. Knitwear Market Size (US$ Bn & Million Units) Forecast, By Price Category, 2017-2031
12.9.1. Low
12.9.2. Medium
12.9.3. High
12.10. Knitwear Market Size (US$ Bn & Million Units) Forecast, By End-user, 2017-2031
12.10.1. Men
12.10.2. Women
12.10.3. Kids
12.11. Knitwear Market Size (US$ Bn & Million Units) Forecast, By Distribution Channel, 2017-2031
12.11.1. Online
12.11.1.1. E-commerce Website
12.11.1.2. Company Owned Websites
12.11.2. Offline
12.11.2.1. Specialty Stores
12.11.2.2. Departmental Stores
12.11.2.3. Other Retail Stores
12.12. Knitwear Market Size (US$ Bn & Million Units) Forecast, By Country & Sub-region, 2017-2031
12.12.1. U.S.
12.12.2. Canada
12.12.3. Rest of North America
13. Europe Knitwear Market Analysis and Forecast
13.1. Regional Snapshot
13.2. Key Trends Analysis
13.2.1. Supplier Side
13.2.2. Demand Side
13.3. Brand Analysis
13.4. Key Supplier Analysis
13.5. Price Trend Analysis
13.5.1. Weighted Average Price
13.6. Consumer Buying Behavior
13.7. Knitwear Market Size (US$ Bn & Million Units) Forecast, By Product Type, 2017-2031
13.7.1. T-Shirts & Shirts
13.7.2. Jackets & Sweaters
13.7.3. Sweatshirts & Hoodies
13.7.4. Shorts & Trousers
13.7.5. Innerwear
13.7.6. Evening Dresses, Suits, & Leggings
13.7.7. Others
13.8. Knitwear Market Size (US$ Bn & Million Units) Forecast, By Material Type, 2017-2031
13.8.1. Natural
13.8.2. Synthetic
13.8.3. Blended
13.9. Knitwear Market Size (US$ Bn & Million Units) Forecast, By Price Category, 2017-2031
13.9.1. Low
13.9.2. Medium
13.9.3. High
13.10. Knitwear Market Size (US$ Bn & Million Units) Forecast, By End-user, 2017-2031
13.10.1. Men
13.10.2. Women
13.10.3. Kids
13.11. Knitwear Market Size (US$ Bn & Million Units) Forecast, By Distribution Channel, 2017-2031
13.11.1. Online
13.11.1.1. E-commerce Website
13.11.1.2. Company Owned Websites
13.11.2. Offline
13.11.2.1. Specialty Stores
13.11.2.2. Departmental Stores
13.11.2.3. Other Retail Stores
13.12. Knitwear Market Size (US$ Bn & Million Units) Forecast, By Country & Sub-region, 2017-2031
13.12.1. U.K.
13.12.2. Germany
13.12.3. France
13.12.4. Rest of Europe
13.13. Incremental Opportunity Analysis
14. Asia Pacific Knitwear Market Analysis and Forecast
14.1. Regional Snapshot
14.2. Key Trends Analysis
14.2.1. Supplier Side
14.2.2. Demand Side
14.3. Brand Analysis
14.4. Key Supplier Analysis
14.5. Price Trend Analysis
14.5.1. Weighted Average Price
14.6. Consumer Buying Behavior
14.7. Knitwear Market Size (US$ Bn & Million Units) Forecast, By Product Type, 2017-2031
14.7.1. T-Shirts & Shirts
14.7.2. Jackets & Sweaters
14.7.3. Sweatshirts & Hoodies
14.7.4. Shorts & Trousers
14.7.5. Innerwear
14.7.6. Evening Dresses, Suits, & Leggings
14.7.7. Others
14.8. Knitwear Market Size (US$ Bn & Million Units) Forecast, By Material Type, 2017-2031
14.8.1. Natural
14.8.2. Synthetic
14.8.3. Blended
14.9. Knitwear Market Size (US$ Bn & Million Units) Forecast, By Price Category, 2017-2031
14.9.1. Low
14.9.2. Medium
14.9.3. High
14.10. Knitwear Market Size (US$ Bn & Million Units) Forecast, By End-user, 2017-2031
14.10.1. Men
14.10.2. Women
14.10.3. Kids
14.11. Knitwear Market Size (US$ Bn & Million Units) Forecast, By Distribution Channel, 2017-2031
14.11.1. Online
14.11.1.1. E-commerce Website
14.11.1.2. Company Owned Websites
14.11.2. Offline
14.11.2.1. Specialty Stores
14.11.2.2. Departmental Stores
14.11.2.3. Other Retail Stores
14.12. Knitwear Market Size (US$ Bn & Million Units) Forecast, By Country & Sub-region, 2017-2031
14.12.1. China
14.12.2. India
14.12.3. Japan
14.12.4. Rest of Asia Pacific
14.13. Incremental Opportunity Analysis
15. Middle East & Africa Knitwear Market Analysis and Forecast
15.1. Regional Snapshot
15.2. Key Trends Analysis
15.2.1. Supplier Side
15.2.2. Demand Side
15.3. Brand Analysis
15.4. Key Supplier Analysis
15.5. Price Trend Analysis
15.5.1. Weighted Average Price
15.6. Consumer Buying Behavior
15.7. Knitwear Market Size (US$ Bn & Million Units) Forecast, By Product Type, 2017-2031
15.7.1. T-Shirts & Shirts
15.7.2. Jackets & Sweaters
15.7.3. Sweatshirts & Hoodies
15.7.4. Shorts & Trousers
15.7.5. Innerwear
15.7.6. Evening Dresses, Suits, & Leggings
15.7.7. Others
15.8. Knitwear Market Size (US$ Bn & Million Units) Forecast, By Material Type, 2017-2031
15.8.1. Natural
15.8.2. Synthetic
15.8.3. Blended
15.9. Knitwear Market Size (US$ Bn & Million Units) Forecast, By Price Category, 2017-2031
15.9.1. Low
15.9.2. Medium
15.9.3. High
15.10. Knitwear Market Size (US$ Bn & Million Units) Forecast, By End-user, 2017-2031
15.10.1. Men
15.10.2. Women
15.10.3. Kids
15.11. Knitwear Market Size (US$ Bn & Million Units) Forecast, By Distribution Channel, 2017-2031
15.11.1. Online
15.11.1.1. E-commerce Website
15.11.1.2. Company Owned Websites
15.11.2. Offline
15.11.2.1. Specialty Stores
15.11.2.2. Departmental Stores
15.11.2.3. Other Retail Stores
15.12. Knitwear Market Size (US$ Bn & Million Units) Forecast, By Country & Sub-region, 2017-2031
15.12.1. GCC
15.12.2. South Africa
15.12.3. Rest of Middle East & Africa
15.13. Incremental Opportunity Analysis
16. South America Knitwear Market Analysis and Forecast
16.1. Regional Snapshot
16.2. Key Trends Analysis
16.2.1. Supplier Side
16.2.2. Demand Side
16.3. Brand Analysis
16.4. Key Supplier Analysis
16.5. Price Trend Analysis
16.5.1. Weighted Average Price
16.6. Consumer Buying Behavior
16.7. Knitwear Market Size (US$ Bn & Million Units) Forecast, By Product Type, 2017-2031
16.7.1. T-Shirts & Shirts
16.7.2. Jackets & Sweaters
16.7.3. Sweatshirts & Hoodies
16.7.4. Shorts & Trousers
16.7.5. Innerwear
16.7.6. Evening Dresses, Suits, & Leggings
16.7.7. Others
16.8. Knitwear Market Size (US$ Bn & Million Units) Forecast, By Material Type, 2017-2031
16.8.1. Natural
16.8.2. Synthetic
16.8.3. Blended
16.9. Knitwear Market Size (US$ Bn & Million Units) Forecast, By Price Category, 2017-2031
16.9.1. Low
16.9.2. Medium
16.9.3. High
16.10. Knitwear Market Size (US$ Bn & Million Units) Forecast, By End-user, 2017-2031
16.10.1. Men
16.10.2. Women
16.10.3. Kids
16.11. Knitwear Market Size (US$ Bn & Million Units) Forecast, By Distribution Channel, 2017-2031
16.11.1. Online
16.11.1.1. E-commerce Website
16.11.1.2. Company Owned Websites
16.11.2. Offline
16.11.2.1. Specialty Stores
16.11.2.2. Departmental Stores
16.11.2.3. Other Retail Stores
16.12. Knitwear Market Size (US$ Bn & Million Units) Forecast, By Country & Sub-region, 2017-2031
16.12.1. Brazil
16.12.2. Rest of South America
16.13. Incremental Opportunity Analysis
17. Competition Landscape
17.1. Market Player – Competition Dashboard
17.2. Market Revenue Share Analysis (%), by Company, (2021)
17.3. Company Profiles (Details – Company Overview, Sales Area/Geographical Presence, Revenue, Strategy & Business Overview)
17.3.1. Adidas AG
17.3.1.1. Company Overview
17.3.1.2. Sales Area/Geographical Presence
17.3.1.3. Revenue
17.3.1.4. Strategy & Business Overview
17.3.2. GAP Inc.
17.3.2.1. Company Overview
17.3.2.2. Sales Area/Geographical Presence
17.3.2.3. Revenue
17.3.2.4. Strategy & Business Overview
17.3.3. Gildan Activewear Inc.
17.3.3.1. Company Overview
17.3.3.2. Sales Area/Geographical Presence
17.3.3.3. Revenue
17.3.3.4. Strategy & Business Overview
17.3.4. Hackett Limited
17.3.4.1. Company Overview
17.3.4.2. Sales Area/Geographical Presence
17.3.4.3. Revenue
17.3.4.4. Strategy & Business Overview
17.3.5. Hollister Co.
17.3.5.1. Company Overview
17.3.5.2. Sales Area/Geographical Presence
17.3.5.3. Revenue
17.3.5.4. Strategy & Business Overview
17.3.6. Loro Piana S.p.A.
17.3.6.1. Company Overview
17.3.6.2. Sales Area/Geographical Presence
17.3.6.3. Revenue
17.3.6.4. Strategy & Business Overview
17.3.7. Marks and Spencer plc.
17.3.7.1. Company Overview
17.3.7.2. Sales Area/Geographical Presence
17.3.7.3. Revenue
17.3.7.4. Strategy & Business Overview
17.3.8. Nike Inc.
17.3.8.1. Company Overview
17.3.8.2. Sales Area/Geographical Presence
17.3.8.3. Revenue
17.3.8.4. Strategy & Business Overview
17.3.9. Puma SE
17.3.9.1. Company Overview
17.3.9.2. Sales Area/Geographical Presence
17.3.9.3. Revenue
17.3.9.4. Strategy & Business Overview
17.3.10. Ralph Lauren Corporation
17.3.10.1. Company Overview
17.3.10.2. Sales Area/Geographical Presence
17.3.10.3. Revenue
17.3.10.4. Strategy & Business Overview
17.3.11. The Lacoste Group
17.3.11.1. Company Overview
17.3.11.2. Sales Area/Geographical Presence
17.3.11.3. Revenue
17.3.11.4. Strategy & Business Overview
17.3.12. The Nautical Company (UK) Ltd
17.3.12.1. Company Overview
17.3.12.2. Sales Area/Geographical Presence
17.3.12.3. Revenue
17.3.12.4. Strategy & Business Overview
17.3.13. Uniqlo co., Ltd.
17.3.13.1. Company Overview
17.3.13.2. Sales Area/Geographical Presence
17.3.13.3. Revenue
17.3.13.4. Strategy & Business Overview
17.3.14. Victoria’s Secret
17.3.14.1. Company Overview
17.3.14.2. Sales Area/Geographical Presence
17.3.14.3. Revenue
17.3.14.4. Strategy & Business Overview
17.3.15. YOOX NET-A-PORTER GROUP S.P.A
17.3.15.1. Company Overview
17.3.15.2. Sales Area/Geographical Presence
17.3.15.3. Revenue
17.3.15.4. Strategy & Business Overview
17.3.16. Lyle & Scott.
17.3.16.1. Company Overview
17.3.16.2. Sales Area/Geographical Presence
17.3.16.3. Revenue
17.3.16.4. Strategy & Business Overview
18. Key Takeaway
18.1. Identification of Potential Market Spaces
18.1.1. Product Type
18.1.2. Material
18.1.3. Price Category
18.1.4. End-user
18.1.5. Distribution Channel
18.1.6. Region
18.2. Understanding the Buying Process of Customers
18.3. Preferred Sales & Marketing Strategy
List of Tables
Table 1: Global Knitwear Market, by Product type, Million Units, 2017-2031
Table 2: Global Knitwear Market, by Product type, US$ Bn , 2017-2031
Table 3: Global Knitwear Market, By Material Type, Million Units 2017-2031
Table 4: Global Knitwear Market, By Material Type, US$ Bn 2017-2031
Table 5: Global Knitwear Market, by Price Category, Million Units, 2017-2031
Table 6: Global Knitwear Market, by Price Category, US$ Bn 2017-2031
Table 7: Global Knitwear Market, by End-user, Million Units, 2017-2031
Table 8: Global Knitwear Market, by End-user, US$ Bn 2017-2031
Table 9: Global Knitwear Market, by Distribution Channel, Million Units, 2017-2031
Table 10: Global Knitwear Market, by Distribution Channel, US$ Bn 2017-2031
Table 11: Global Knitwear Market, by Region, Million Units, 2017-2031
Table 12: Global Knitwear Market, by Region, US$ Bn 2017-2031
Table 13: North America Knitwear Market, by Product type, Million Units, 2017-2031
Table 14: North America Knitwear Market, by Product type, US$ Bn , 2017-2031
Table 15: North America Knitwear Market, By Material Type, Million Units 2017-2031
Table 16: North America Knitwear Market, By Material Type, US$ Bn 2017-2031
Table 17: North America Knitwear Market, by Price Category, Million Units, 2017-2031
Table 18: North America Knitwear Market, by Price Category, US$ Bn 2017-2031
Table 19: North America Knitwear Market, by End-user, Million Units, 2017-2031
Table 20: North America Knitwear Market, by End-user, US$ Bn 2017-2031
Table 21: North America Knitwear Market, by Distribution Channel, Million Units, 2017-2031
Table 22: North America Knitwear Market, by Distribution Channel, US$ Bn 2017-2031
Table 23: North America Knitwear Market, by Region, Million Units, 2017-2031
Table 24: North America Knitwear Market, by Region, US$ Bn 2017-2031
Table 25: Europe Knitwear Market, by Product type, Million Units, 2017-2031
Table 26: Europe Knitwear Market, by Product type, US$ Bn , 2017-2031
Table 27: Europe Knitwear Market, By Material Type, Million Units 2017-2031
Table 28: Europe Knitwear Market, By Material Type, US$ Bn 2017-2031
Table 29: Europe Knitwear Market, by Price Category, Million Units, 2017-2031
Table 30: Europe Knitwear Market, by Price Category, US$ Bn 2017-2031
Table 31: Europe Knitwear Market, by End-user, Million Units, 2017-2031
Table 32: Europe Knitwear Market, by End-user, US$ Bn 2017-2031
Table 33: Europe Knitwear Market, by Distribution Channel, Million Units, 2017-2031
Table 34: Europe Knitwear Market, by Distribution Channel, US$ Bn 2017-2031
Table 35: Europe Knitwear Market, by Region, Million Units, 2017-2031
Table 36: Europe Knitwear Market, by Region, US$ Bn 2017-2031
Table 37: Asia Pacific Knitwear Market, by Product type, Million Units, 2017-2031
Table 38: Asia Pacific Knitwear Market, by Product type, US$ Bn , 2017-2031
Table 39: Asia Pacific Knitwear Market, By Material Type, Million Units 2017-2031
Table 40: Asia Pacific Knitwear Market, By Material Type, US$ Bn 2017-2031
Table 41: Asia Pacific Knitwear Market, by Price Category, Million Units, 2017-2031
Table 42: Asia Pacific Knitwear Market, by Price Category, US$ Bn 2017-2031
Table 43: Asia Pacific Knitwear Market, by End-user, Million Units, 2017-2031
Table 44: Asia Pacific Knitwear Market, by End-user, US$ Bn 2017-2031
Table 45: Asia Pacific Knitwear Market, by Distribution Channel, Million Units, 2017-2031
Table 46: Asia Pacific Knitwear Market, by Distribution Channel, US$ Bn 2017-2031
Table 47: Asia Pacific Knitwear Market, by Region, Million Units, 2017-2031
Table 48: Asia Pacific Knitwear Market, by Region, US$ Bn 2017-2031
Table 49: Middle East & Africa Knitwear Market, by Product type, Million Units, 2017-2031
Table 50: Middle East & Africa Knitwear Market, by Product type, US$ Bn , 2017-2031
Table 51: Middle East & Africa Knitwear Market, By Material Type, Million Units 2017-2031
Table 52: Middle East & Africa Knitwear Market, By Material Type, US$ Bn 2017-2031
Table 53: Middle East & Africa Knitwear Market, by Price Category, Million Units, 2017-2031
Table 54: Middle East & Africa Knitwear Market, by Price Category, US$ Bn 2017-2031
Table 55: Middle East & Africa Knitwear Market, by End-user, Million Units, 2017-2031
Table 56: Middle East & Africa Knitwear Market, by End-user, US$ Bn 2017-2031
Table 57: Middle East & Africa Knitwear Market, by Distribution Channel, Million Units, 2017-2031
Table 58: Middle East & Africa Knitwear Market, by Distribution Channel, US$ Bn 2017-2031
Table 59: Middle East & Africa Knitwear Market, by Region, Million Units, 2017-2031
Table 60: Middle East & Africa Knitwear Market, by Region, US$ Bn 2017-2031
Table 61: South America Knitwear Market, by Product type, Million Units, 2017-2031
Table 62: South America Knitwear Market, by Product type, US$ Bn , 2017-2031
Table 63: South America Knitwear Market, By Material Type, Million Units 2017-2031
Table 64: South America Knitwear Market, By Material Type, US$ Bn 2017-2031
Table 65: South America Knitwear Market, by Price Category, Million Units, 2017-2031
Table 66: South America Knitwear Market, by Price Category, US$ Bn 2017-2031
Table 67: South America Knitwear Market, by End-user, Million Units, 2017-2031
Table 68: South America Knitwear Market, by End-user, US$ Bn 2017-2031
Table 69: South America Knitwear Market, by Distribution Channel, Million Units, 2017-2031
Table 70: South America Knitwear Market, by Distribution Channel, US$ Bn 2017-2031
Table 71: South America Knitwear Market, by Region, Million Units, 2017-2031
Table 72: South America Knitwear Market, by Region, US$ Bn 2017-2031
List of Figures
Figure 1: Global Knitwear Projections, by Product Type, Million Units 2017-2031
Figure 2: Global Knitwear Projections, by Product Type, US$ Bn 2017-2031
Figure 3: Global Knitwear, Incremental Opportunity, by Product Type, US$ Bn 2021 -2031
Figure 4: Global Knitwear Projections, By Material Type, Million Units, 2017-2031
Figure 5: Global Knitwear Projections, By Material Type, US$ Bn 2017-2031
Figure 6: Global Knitwear, Incremental Opportunity, By Material Type, US$ Bn 2021 -2031
Figure 7: Global Knitwear Projections, by Price Category, Million Units, 2017-2031
Figure 8: Global Knitwear Projections, by Price Category, US$ Bn 2017-2031
Figure 9: Global Knitwear, Incremental Opportunity, by Price Category, US$ Bn 2021 -2031
Figure 10: Global Knitwear Projections, by End-user, Million Units, 2017-2031
Figure 11: Global Knitwear Projections, by End-user, US$ Bn 2017-2031
Figure 12: Global Knitwear, Incremental Opportunity, by End-user, US$ Bn 2021 -2031
Figure 13: Global Knitwear Projections, by Distribution Channel, Million Units, 2017-2031
Figure 14: Global Knitwear Projections, by Distribution Channel, US$ Bn 2017-2031
Figure 15: Global Knitwear, Incremental Opportunity, by Distribution Channel, US$ Bn 2021 -2031
Figure 16: Global Knitwear Projections, by Region, Million Units, 2017-2031
Figure 17: Global Knitwear Projections, by Region, US$ Bn 2017-2031
Figure 18: Global Knitwear, Incremental Opportunity, by Region, US$ Bn 2021 -2031
Figure 19: North America Knitwear Projections, by Product type, Million Units, 2017-2031
Figure 20: North America Knitwear Projections, by Product type, US$ Bn 2017-2031
Figure 21: North America Knitwear, Incremental Opportunity, by Product type, US$ Bn 2021 -2031
Figure 22: North America Knitwear Projections, By Material Type, Million Units, 2017-2031
Figure 23: North America Knitwear Projections, By Material Type, US$ Bn 2017-2031
Figure 24: North America Knitwear, Incremental Opportunity, By Material Type, US$ Bn 2021 -2031
Figure 25: North America Knitwear Projections, by Price Category, Million Units, 2017-2031
Figure 26: North America Knitwear Projections, by Price Category, US$ Bn 2017-2031
Figure 27: North America Knitwear, Incremental Opportunity, by Price Category, US$ Bn 2021 -2031
Figure 28: North America Knitwear Projections, by End-user, Million Units, 2017-2031
Figure 29: North America Knitwear Projections, by End-user, US$ Bn 2017-2031
Figure 30: North America Knitwear, Incremental Opportunity, by End-user, US$ Bn 2021 -2031
Figure 31: North America Knitwear Projections, by Distribution Channel, Million Units, 2017-2031
Figure 32: North America Knitwear Projections, by Distribution Channel, US$ Bn 2017-2031
Figure 33: North America Knitwear, Incremental Opportunity, by Distribution Channel, US$ Bn 2021 -2031
Figure 34: North America Knitwear Projections, by Region, Million Units, 2017-2031
Figure 35: North America Knitwear Projections, by Region, US$ Bn 2017-2031
Figure 36: North America Knitwear, Incremental Opportunity, by Region, US$ Bn 2021 -2031
Figure 37: Europe Knitwear Projections, by Product type, Million Units, 2017-2031
Figure 38: Europe Knitwear Projections, by Product type, US$ Bn 2017-2031
Figure 39: Europe Knitwear, Incremental Opportunity, by Product type, US$ Bn 2021 -2031
Figure 40: Europe Knitwear Projections, By Material Type, Million Units, 2017-2031
Figure 41: Europe Knitwear Projections, By Material Type, US$ Bn 2017-2031
Figure 42: Europe Knitwear, Incremental Opportunity, By Material Type, US$ Bn 2021 -2031
Figure 43: Europe Knitwear Projections, by Price Category, Million Units, 2017-2031
Figure 44: Europe Knitwear Projections, by Price Category, US$ Bn 2017-2031
Figure 45: Europe Knitwear, Incremental Opportunity, by Price Category, US$ Bn 2021 -2031
Figure 46: Europe Knitwear Projections, by End-user, Million Units, 2017-2031
Figure 47: Europe Knitwear Projections, by End-user, US$ Bn 2017-2031
Figure 48: Europe Knitwear, Incremental Opportunity, by End-user, US$ Bn 2021 -2031
Figure 49: Europe Knitwear Projections, by Distribution Channel, Million Units, 2017-2031
Figure 50: Europe Knitwear Projections, by Distribution Channel, US$ Bn 2017-2031
Figure 51: Europe Knitwear, Incremental Opportunity, by Distribution Channel, US$ Bn 2021 -2031
Figure 52: Europe Knitwear Projections, by Region, Million Units, 2017-2031
Figure 53: Europe Knitwear Projections, by Region, US$ Bn 2017-2031
Figure 54: Europe Knitwear, Incremental Opportunity, by Region, US$ Bn 2021 -2031
Figure 55: Asia Pacific Knitwear Projections, by Product type, Million Units, 2017-2031
Figure 56: Asia Pacific Knitwear Projections, by Product type, US$ Bn 2017-2031
Figure 57: Asia Pacific Knitwear, Incremental Opportunity, by Product type, US$ Bn 2021 -2031
Figure 58: Asia Pacific Knitwear Projections, By Material Type, Million Units, 2017-2031
Figure 59: Asia Pacific Knitwear Projections, By Material Type, US$ Bn 2017-2031
Figure 60: Asia Pacific Knitwear, Incremental Opportunity, By Material Type US$ Bn 2021 -2031
Figure 61: Asia Pacific Knitwear Projections, by Price Category, Million Units, 2017-2031
Figure 62: Asia Pacific Knitwear Projections, by Price Category, US$ Bn 2017-2031
Figure 63: Asia Pacific Knitwear, Incremental Opportunity, by Price Category, US$ Bn 2021 -2031
Figure 64: Asia Pacific Knitwear Projections, by End-user, Million Units, 2017-2031
Figure 65: Asia Pacific Knitwear Projections, by End-user, US$ Bn 2017-2031
Figure 66: Asia Pacific Knitwear, Incremental Opportunity, by End-user, US$ Bn 2021 -2031
Figure 67: Asia Pacific Knitwear Projections, by Distribution Channel, Million Units, 2017-2031
Figure 68: Asia Pacific Knitwear Projections, by Distribution Channel, US$ Bn 2017-2031
Figure 69: Asia Pacific Knitwear, Incremental Opportunity, by Distribution Channel, US$ Bn 2021 -2031
Figure 70: Asia Pacific Knitwear Projections, by Region, Million Units, 2017-2031
Figure 71: Asia Pacific Knitwear Projections, by Region, US$ Bn 2017-2031
Figure 72: Asia Pacific Knitwear, Incremental Opportunity, by Region, US$ Bn 2021 -2031
Figure 73: Middle East & Africa Knitwear Projections, by Product type, Million Units, 2017-2031
Figure 74: Middle East & Africa Knitwear Projections, by Product type, US$ Bn 2017-2031
Figure 75: Middle East & Africa Knitwear, Incremental Opportunity, by Product type, US$ Bn 2021 -2031
Figure 76: Middle East & Africa Knitwear Projections, By Material Type, Million Units, 2017-2031
Figure 77: Middle East & Africa Knitwear Projections, By Material Type, US$ Bn 2017-2031
Figure 78: Middle East & Africa Knitwear, Incremental Opportunity, By Material Type, US$ Bn 2021 -2031
Figure 79: Middle East & Africa Knitwear Projections, by Price Category, Million Units, 2017-2031
Figure 80: Middle East & Africa Knitwear Projections, by Price Category, US$ Bn 2017-2031
Figure 81: Middle East & Africa Knitwear, Incremental Opportunity, by Price Category, US$ Bn 2021 -2031
Figure 82: Middle East & Africa Knitwear Projections, by End-user, Million Units, 2017-2031
Figure 83: Middle East & Africa Knitwear Projections, by End-user, US$ Bn 2017-2031
Figure 84: Middle East & Africa Knitwear, Incremental Opportunity, by End-user, US$ Bn 2021 -2031
Figure 85: Middle East & Africa Knitwear Projections, by Distribution Channel, Million Units, 2017-2031
Figure 86: Middle East & Africa Knitwear Projections, by Distribution Channel, US$ Bn 2017-2031
Figure 87: Middle East & Africa Knitwear, Incremental Opportunity, by Distribution Channel, US$ Bn 2021 -2031
Figure 88: Middle East & Africa Knitwear Projections, by Region, Million Units, 2017-2031
Figure 89: Middle East & Africa Knitwear Projections, by Region, US$ Bn 2017-2031
Figure 90: Middle East & Africa Knitwear, Incremental Opportunity, by Region, US$ Bn 2021 -2031
Figure 91: South America Knitwear Projections, by Product type, Million Units, 2017-2031
Figure 92: South America Knitwear Projections, by Product type, US$ Bn 2017-2031
Figure 93: South America Knitwear, Incremental Opportunity, by Product type, US$ Bn 2021 -2031
Figure 94: South America Knitwear Projections, By Material Type, Million Units, 2017-2031
Figure 95: South America Knitwear Projections, By Material Type, US$ Bn 2017-2031
Figure 96: South America Knitwear, Incremental Opportunity, By Material Type, US$ Bn 2021 -2031
Figure 97: South America Knitwear Projections, by Price Category, Million Units, 2017-2031
Figure 98: South America Knitwear Projections, by Price Category, US$ Bn 2017-2031
Figure 99: South America Knitwear, Incremental Opportunity, by Price Category, US$ Bn 2021 -2031
Figure 100: South America Knitwear Projections, by End-user, Million Units, 2017-2031
Figure 101: South America Knitwear Projections, by End-user, US$ Bn, 2017-2031
Figure 102: South America Knitwear, Incremental Opportunity, by End-user, US$ Bn, 2021 -2031
Figure 103: South America Knitwear Projections, by Distribution Channel, Million Units, 2017-2031
Figure 104: South America Knitwear Projections, by Distribution Channel, US$ Bn 2017-2031
Figure 105: South America Knitwear, Incremental Opportunity, by Distribution Channel, US$ Bn, 2021 -2031
Figure 106: South America Knitwear Projections, by Region, Million Units, 2017-2031
Figure 107: South America Knitwear Projections, by Region, US$ Bn 2017-2031
Figure 108: South America Knitwear, Incremental Opportunity, by Region, US$ Bn 2021 -2031
Copyright © Transparency Market Research, Inc. All Rights reserved
Trust Online


Knitwear Market