
Despite interruptions in business activities for manufacturers in the biochar market during the coronavirus pandemic, stakeholders are supporting farmers to build reactors in their farms to accelerate the process of converting stubble into biomass. This trend is prominent in India, since stakeholders and farmers are increasing efforts to boost crop yield despite challenges posed by the pandemic.
The UN’s Intergovernmental Panel on Climate Change has recognized biochar as an effective strategy to reduce environmental pollution. Such trends are translating into revenue opportunities for manufacturers in the biochar market where the market is currently facing volatile demand and supply due to the COVID-19 outbreak. Biochar is being highly publicized for improving soil health and boosting crop yield in an environment-friendly way.
Request a sample to get extensive insights into the Biochar Market
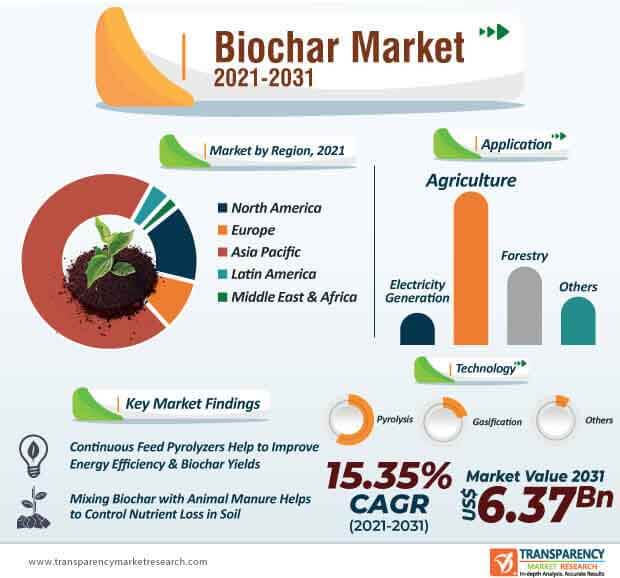
The global biochar market is expected to expand at a CAGR of 15.35% during the forecast period. However, biochar production and application costs are the most important concerns since the high production cost can compensate the revenue caused by higher rice yield. Thus, stakeholders are conducting a life cycle cost analysis that can help to close the gap over the field application of biochar.
Stakeholders are increasing efforts to increase studies to scrutinize the production costs of biochar from different agro-wastes and the associated field application. These production costs are highly dependent on the nature of feedstock and the technology used to produce biochar.
To understand how our report can bring difference to your business strategy, Ask for a brochure
Companies in the biochar market are capitalizing on incremental opportunities in the United States. Creating and applying biochar on the farm is gaining momentum in Oregon, owing to the Conservation Innovation Grant (CIG) funded by the Oregon USDA Natural Resources Conservation Service (NRCS). This is due to forestland in Southern Oregon requiring routine thinning and slash treatments to reduce the risk of catastrophic wildfire and remove weeds & invasive vegetation that can impact pasturelands.
Manufacturers in the U.S. biochar market are increasing their R&D in animal manure, which is a source of on-farm waste that can be challenging to manage, especially when trying to reduce odors. They are experimenting to mix biochar with animal manure to help control nutrient loss through better manure management.
The biochar market is expected to cross the valuation of US$ 6.3 Bn by 2031. Advanced biochar production methods, apart from pyrolysis and glasification are gaining popularity such as continuous feed pyrolyzers, which help to improve energy efficiency and biochar yields. These pyrolyzers help in the recovery of co-products to reduce pollution emissions and improve process economies.
Manufacturers in the biochar market are utilizing continuous feed pyrolyzers to control operating conditions for improving biochar properties and allowing changes in co-product yields. Both woody and herbaceous biomass such as crop residues or grasses are being converted into rich biochar with the help of continuous feed pyrolyzers.
Stuck in a neck-to-neck competition with other brands? Request a custom report on Biochar Market
Analysts’ Viewpoint
Though the coronavirus pandemic has caused a slowdown in various activities in the global biochar market, stakeholders are increasing efforts to build reactors at farms and encourage adoption of advanced technologies to keep revenues flowing. However, it has been found that pyrolysis plants are usually expensive to operate continuously, which can undermine the economy of biochar application in agricultural lands. Hence, companies in the biochar market should conduct a life cycle cost analysis to help close the gap over the field application of biochar. On the other hand, it is now being debated whether continuous feed pyrolyzers help improve economies in advanced biochar production.
Biochar Market: Overview
Environmental Benefits of Biochar: Key Driver of Biochar Market
Cheaper Feedstock: Major Driver of Biochar Market
Biochar Market: Competition Landscape
Biochar Market: Key Developments
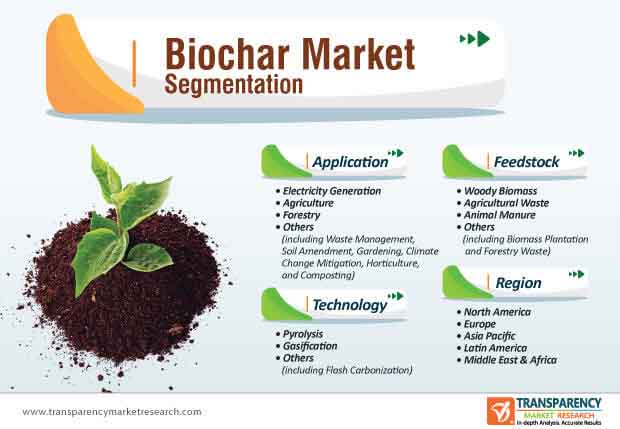
Biochar Market – Segmentation
TMR’s research study assesses the biochar market across the globe based on feedstock, technology, application, and region. The report presents extensive market dynamics and progressive trends associated with different segments and how they are influencing growth prospects of the biochar market across the globe.
| Feedstock |
|
| Technology |
|
| Application |
|
| Region |
|
Biochar Market is expected to reach US$ 6.3 Bn By 2031
Biochar Market is estimated to rise at a CAGR of 15.35% during forecast period
Rising demand for electricity is expected to drive the Biochar Market
Asia Pacific is more attractive for vendors in the Biochar Market
Key players of Biochar Market are Genesis Industries, Black Owl Biochar, Biochar Now, Airex Énergie Inc., Phoenix Energy, American BioChar, Bioforcetech Corporation, ECOERA, PYROPOWER, and ETIA S.A.S
1. Executive Summary
1.1. Market Outlook
1.2. Key Facts and Figures
1.3. Key Trends
2. Market Overview
2.1. Market Segmentation
2.2. Market Indicators
2.3. Market Dynamics
2.4. Drivers and Restraints Snapshot Analysis
2.4.1.1. Drivers
2.4.1.2. Restraints
2.4.1.3. Opportunities
2.5. Regulatory Scenario
2.6. Porter’s Five Forces Analysis
2.6.1. Threat of Substitutes
2.6.2. Bargaining Power of Buyers
2.6.3. Bargaining Power of Suppliers
2.6.4. Threat of New Entrants
2.6.5. Degree of Competition
2.7. Value Chain Analysis
3. COVID-19 Impact Analysis
4. Global Biochar Market Volume (Million Tons) and Value (US$ Mn) Analysis, by Feedstock
4.1. Key Findings and Introduction
4.2. Global Biochar Market Volume (Million Tons) and Value (US$ Mn) Forecast, by Feedstock, 2020 - 2031
4.2.1. Global Biochar Market Volume and Value (US$ Mn) Forecast, by Woody Biomass, 2020 – 2031
4.2.2. Global Biochar Market Volume (Million Tons) and Value (US$ Mn) Forecast, by Agricultural Waste, 2020 – 2031
4.2.3. Global Biochar Market Volume (Million Tons) and Value (US$ Mn) Forecast, by Animal Manure, 2020 – 2031
4.2.4. Global Biochar Market Volume (Million Tons) and Value (US$ Mn) Forecast, by Others, 2020 – 2031
4.3. Global Biochar Market Attractive Analysis, by Feedstock
5. Global Biochar Market Volume (Million Tons) and Value (US$ Mn) Analysis, by Technology
5.1. Key Findings and Introduction
5.2. Global Biochar Market Volume (Million Tons) and Value (US$ Mn) Forecast, by Technology, 2020 - 2031
5.2.1. Global Biochar Market Volume (Million Tons) and Value (US$ Mn) Forecast, by Pyrolysis, 2020 - 2031
5.2.2. Global Biochar Market Volume (Million Tons) and Value (US$ Mn) Forecast, by Gasification, 2020 – 2031
5.2.3. Global Biochar Market Volume (Million Tons) and Value (US$ Mn) Forecast, by Others, 2020 - 2031
5.3. Global Biochar Market Attractive Analysis, by Technology
6. Global Biochar Market Volume (Million Tons) and Value (US$ Mn) Analysis, by Application
6.1. Key Findings and Introduction
6.2. Global Biochar Market Volume (Million Tons) and Value (US$ Mn) Forecast, by Application, 2020 - 2031
6.2.1. Global Biochar Market Volume (Million Tons) and Value (US$ Mn) Forecast, by Electricity Generation, 2020 - 2031
6.2.2. Global Biochar Market Volume (Million Tons) and Value (US$ Mn) Forecast, by Agriculture, 2020 - 2031
6.2.3. Global Biochar Market Volume (Million Tons) and Value (US$ Mn) Forecast, by Forestry, 2020 – 2031
6.2.4. Global Biochar Market Volume (Million Tons) and Value (US$ Mn) Forecast, by Others, 2020 - 2031
7. Global Biochar Market Attractive Analysis, by Application
8. Global Biochar Market Analysis, by Region
8.1. Key Findings
8.2. Global Biochar Market Volume (Million Tons) and Value (US$ Mn) Forecast, by Region
8.2.1. North America
8.2.2. Europe
8.2.3. Asia Pacific
8.2.4. Latin America
8.2.5. Middle East & Africa
8.3. Global Biochar Market Attractiveness Analysis, by Region
9. North America Biochar Market Overview
9.1. North America Biochar Market Volume (Million Tons) and Value (US$ Mn) Forecast, by Country
9.2. North America Biochar Market Attractiveness Analysis, by Country
10. Europe Biochar Market Overview
10.1. Europe Biochar Market Volume (Million Tons) and Value (US$ Mn) Forecast, by Country and Sub-region
10.2. Europe Biochar Market Attractiveness Analysis, by Country and Sub-region
11. Asia Pacific Biochar Market Overview
11.1. Asia Pacific Biochar Market Volume (Million Tons) and Value (US$ Mn) Forecast, by Country and Sub-region
11.2. Asia Pacific Biochar Market Attractiveness Analysis, by Country and Sub-region
12. Latin America Biochar Market Overview
12.1. Latin America Biochar Market Volume (Million Tons) and Value (US$ Mn) Forecast, by Country and Sub-region
12.2. Latin America Biochar Market Attractiveness Analysis, by Country and Sub-region
13. Middle East & Africa Biochar Market Overview
13.1. Middle East & Africa Biochar Market Volume (Million Tons) and Value (US$ Mn) Forecast, by Country and Sub-region
13.2. Middle East & Africa Biochar Market Attractiveness Analysis, by Country and Sub-region
14. Competition Landscape
14.1. Competition Matrix
14.2. Biochar Market Share Analysis, by Company (2020)
14.3. Market Footprint Analysis
14.4. Company Profiles
14.4.1. Carbon Gold Ltd
14.4.1.1. Company Details
14.4.1.2. Company Description
14.4.1.3. Business Overview
14.4.2. Genesis Industries
14.4.2.1. Company Details
14.4.2.2. Company Description
14.4.2.3. Business Overview
14.4.3. Black Owl Biochar
14.4.3.1. Company Details
14.4.3.2. Company Description
14.4.3.3. Business Overview
14.4.4. Biochar Now, LLC
14.4.4.1. Company Details
14.4.4.2. Company Description
14.4.4.3. Business Overview
14.4.5. Airex Énergie Inc
14.4.5.1. Company Details
14.4.5.2. Company Description
14.4.5.3. Business Overview
14.4.6. Phoenix Energy
14.4.6.1. Company Details
14.4.6.2. Company Description
14.4.6.3. Business Overview
14.4.6.4. Financial Details
14.4.6.5. Strategic Overview
14.4.7. American BioChar Company.
14.4.7.1. Company Details
14.4.7.2. Company Description
14.4.7.3. Business Overview
14.4.8. Bioforcetech Corp
14.4.8.1. Company Details
14.4.8.2. Company Description
14.4.8.3. Business Overview
14.4.9. ECOERA
14.4.9.1. Company Details
14.4.9.2. Company Description
14.4.9.3. Business Overview
14.4.10. PYROPOWER
14.4.10.1. Company Details
14.4.10.2. Company Description
14.4.10.3. Business Overview
14.4.11. ETIA S.A.S.
14.4.11.1. Company Details
14.4.11.2. Company Description
14.4.11.3. Business Overview
15. Primary Research – Key Insights
16. Appendix
16.1. Research Methodology and Assumptions
List of Tables
Table 01: China Biochar Market Volume (Million Tons) Forecast, by Feedstock, 2020–2031
Table 02: China Biochar Market Value (US$ Mn) Forecast, by Feedstock, 2020–2031
Table 03: China Biochar Market Volume (Million Tons) Forecast, by Technology, 2020–2031
Table 04: China Biochar Market Value (US$ Mn) Forecast, by Technology, 2020–2031
Table 05: China Biochar Market Volume (Million Tons) Forecast, by Application, 2020–2031
Table 06: China Biochar Market Value (US$ Mn) Forecast, by Application, 2020–2031
Table 07: Global Biochar Market Volume (Million Tons) Forecast, by Region, 2020–2031
Table 08: Global Biochar Market Value (US$ Mn) Forecast, by Region, 2020–2031
Table 09: North America Biochar Market Volume (Million Tons) Forecast, by Country, 2020–2031
Table 10: North America Biochar Market Value (US$ Mn) Forecast, by Country, 2020–2031
Table 11: Europe Biochar Market Volume (Million Tons) Forecast, by Country and Sub-region, 2020–2031
Table 12: Europe Biochar Market Value (US$) Forecast, by Country and Sub-region, 2020–2031
Table 13: Asia Pacific Biochar Market Volume (Million Tons) Forecast, by Country and Sub-region, 2020–2031
Table 14: Asia Pacific Biochar Market Value (US$ Mn) Forecast, by Country and Sub-region, 2020–2031
Table 15: Latin America Biochar Market Volume (Million Tons) Forecast, by Country and Sub-region, 2020–2031
Table 16: Latin America Biochar Market Value (US$ Mn) Forecast, by Country and Sub-region, 2020–2031
Table 17: Middle East & Africa Biochar Market Volume (Million Tons) Forecast, by Country and Sub-region, 2020–2031
Table 18: Middle East & Africa Biochar Market Value (US$ Mn) Forecast, by Country and Sub-region, 2020–2031
List of Figures
Figure 01: China Biochar Market Value Share Analysis, by Feedstock
Figure 02: China Biochar Market Attractiveness Analysis, by Feedstock
Figure 03: China Biochar Market Value Share Analysis, by Technology
Figure 04: China Biochar Market Attractiveness Analysis, by Technology
Figure 05: China Biochar Market Value Share Analysis, by Application
Figure 06: China Biochar Market Attractiveness Analysis, by Application
Figure 07: Global Biochar Market Share Analysis, by Region
Figure 08: Global Biochar Market Attractiveness Analysis, by Region
Figure 09: North America Biochar Market Share Analysis, by Country
Figure 10: North America Biochar Market Attractiveness Analysis, by Country
Figure 11: Europe Biochar Market Share Analysis, by Country and Sub-region
Figure 12: Europe Biochar Market Attractiveness Analysis, by Country and Sub-region
Figure 13: Asia Pacific Biochar Market Share Analysis, by Country and Sub-region
Figure 14: Asia Pacific Biochar Market Attractiveness Analysis, by Country and Sub-region
Figure 15: Latin America Biochar Market Share Analysis, by Country and Sub-region
Figure 16: Latin America Biochar Market Attractiveness Analysis, by Country and Sub-region
Figure 17: Middle East & Africa Biochar Market Share Analysis, by Country and Sub-region
Figure 18: Middle East & Africa Biochar Market Attractiveness Analysis, by Country and Sub-region
Copyright © Transparency Market Research, Inc. All Rights reserved
Trust Online


Biochar Market (Forecast, 2021-2031)