
Unlike other markets, COVID-19 (coronavirus) is anticipated to bring positive news for companies operating in the chlor-alkali market. This is due to an unprecedented demand for disinfectant chemicals and spray bottles that help to sanitize surfaces and objects and help to break the chain of the infection. India is one of the key producers of alkali chemicals such as chlorine, bleaching solutions, and sodium hypochlorite that are extensively used in disinfection solutions.
As per the guidelines issued by the Alkali Manufacturers Association of India (AMAI), companies in the chlor-alkali market are increasing awareness about the cautious measures that individuals must follow to avoid any harmful reactions on the skin. Manufacturers are recommending dilution of disinfection chemicals before using them for sanitization of surfaces and objects that are contaminated or infected.
To gauge the scope of customization in our reports Ask for a Sample
There is a growing demand for caustic soda with free flowing properties and possesses high resistance to abrasion. Hence, companies in the chlor-alkali market are making improvements in their production techniques to meet end user demands. For instance, Nouryon - a specialty chemicals supplier, manufactures caustic soda at its membrane electrolysis plant in Frankfurt to meet high quality standards of end users in Western Europe. Such innovations are contributing toward the exponential growth in revenue of caustic soda in the chlor-alkali market.
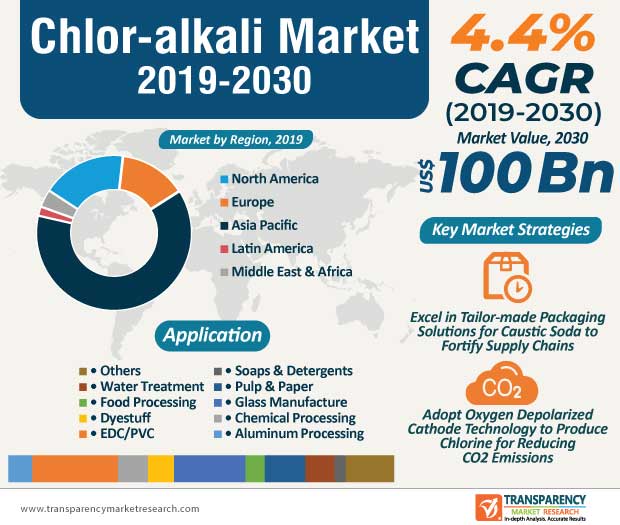
Companies in the market for chlor-alkali are increasing their efficacy in tailor-made packaging solutions to meet sudden and urgent supply demands of clients. Such services help manufacturers to boost their credibility credentials, as customers need not suffer any losses in their production volume. As such, manufacturers are broadening their revenue streams in biodiesel and surfactants production.
Get an idea about the offerings of our report from Report Brochure
High-energy consumption and increased CO2 emissions associated with the production processes of chlorine are some of the drawbacks that companies face in the chlor-alkali market. As such, the market is predicted to advance at a modest CAGR of 4% during the forecast period. Hence, groundbreaking innovations are helping overcome production related drawbacks in the market for chlor-alkali. For instance, recently, on April 3, 2020, manufacturer of high-tech polymer materials, Covestro, announced that its oxygen depolarized cathode (ODC) technology is gaining global recognition whilst providing energy savings and reduced CO2 emissions for the production of chlorine.
The ODC technology is being highly publicized for drastically reducing CO2 emissions during chlorine production. As such, chlorine is anticipated to dictate the second-highest revenue among all products in the market for chlor-alkali. The ODC process is replacing the conventional procedure of hydrogen-producing electrode to suppress the formation of hydrogen, leaving behind application-ready chlorine and caustic soda in the market for chlor-alkali.
Asia Pacific dominates the highest revenue among all regions and the region’s revenue is projected for aggressive growth in the chlor-alkali market. This is evident since companies in India are entering into strategic agreements to tap into value-grab opportunities. For instance, Grasim Industries of leading multinational conglomerate, Aditya Birla Group, announced to acquire the chlor-alkali business of KPR Industries in Andhra Pradesh to deploy expansion plans for aluminum in the state.
Manufacturers in the market for chlor-alkali are increasing efforts to increase their production capabilities in caustic soda to tap opportunities in India’s aluminum sector. As such, companies are strengthening their operations in the East Coast of India. Such strategies to strengthen operations are leading to capacity additions for caustic soda, which is extensively used in the production of aluminum. Manufacturers are unlocking incremental opportunities by exploring sectors of water treatment, viscose staple fiber, pharmaceuticals, and the likes.
Looking for Regional Analysis or Competitive Landscape in Chlor-Alkali Market , ask for a customized report
Analysts’ Viewpoint
The unprecedented demand for disinfection sprays and solutions helps companies in the chlor-alkali market to capitalize on revenue opportunities amidst the COVID-19 crisis. The ODC technology has proved to be a game changer that offer energy savings and has significantly reduced CO2 emissions during the chlorine production.
The caustic soda is being increasingly used to maintain or increase the pH level that helps to reduce corrosion of steel, which is exposed to drilling fluids. Caustic soda cannot be effectively used to raise the pH level in case of high amounts of cations. Hence, companies should increase their research in bioassay information to avoid precipitation of hydroxides, while trying to maintain sufficient pH levels.
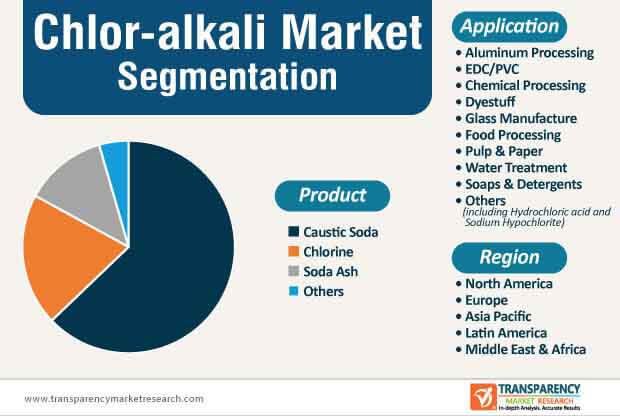
Chlor-alkali Market – Segmentation
TMR’s study on the global chlor-alkali market segments the market based on product, application, and region. Changing market trends and other crucial market dynamics associated with these segments of the global chlor-alkali market are discussed in detail.
|
Product |
|
|
Application |
|
|
Region |
|
1. Executive Summary
2. Market Overview
2.1. Market Segmentation
2.2. Market Definitions
2.3. Market Trends
2.4. Market Dynamics
2.4.1. Drivers
2.4.2. Restraints
2.5. Porters Five Forces Analysis
2.6. Value Chain Analysis
2.6.1. List of Potential Customers
2.7. Regulatory Landscape
3. Global Chlor-alkali Market, Production Output, by Region, 2019
4. Global Chlor-alkali Market, Import-Export Scenario
5. Global Chlor-alkali Pricing Analysis, 2019–2030
5.1. By Product
5.2. By Region
6. Global Chlor-alkali Market Analysis and Forecast, by Product
6.1. Key Findings, by Product
6.2. Global Chlor-alkali Market Volume (Kilo Tons) and Value (US$ Mn) Forecast, by Product, 2019–2030
6.2.1. Caustic Soda
6.2.2. Chlorine
6.2.3. Soda Ash
6.2.4. Others
6.3. Global Chlor-alkali Market Attractiveness Analysis, by Product
7. Global Chlor-alkali Market Analysis and Forecast, by Application
7.1. Key Findings, by Application
7.2. Global Chlor-alkali Market Volume (Kilo Tons) and Value (US$ Mn) Forecast, by Application, 2019–2030
7.2.1. Aluminum Processing
7.2.2. EDC/PVC
7.2.3. Chemical Processing
7.2.4. Dyestuff
7.2.5. Glass Manufacture
7.2.6. Food Processing
7.2.7. Pulp & Paper
7.2.8. Water Treatment
7.2.9. Soaps & Detergents
7.2.10. Others
7.3. Global Chlor-alkali Market Attractiveness Analysis, by Application
8. Regional Outlook - Global Chlor-alkali Market Analysis and Forecast, by Region
8.1. Global Chlor-alkali Market Volume (Kilo Tons) and Value (US$ Mn), by Region, 2019–2030
8.1.1. North America
8.1.2. Europe
8.1.3. Asia Pacific
8.1.4. Latin America
8.1.5. Middle East & Africa
8.2. Global Chlor-alkali Market Attractiveness Analysis, by Region
9. North America Chlor-alkali Market Analysis and Forecast, by Product
9.1. North America Chlor-alkali Market Volume (Kilo Tons) and Value (US$ Mn) Forecast, by Product, 2019–2030
9.1.1. Caustic Soda
9.1.2. Chlorine
9.1.3. Soda Ash
9.1.4. Others
9.2. North America Chlor-alkali Market Attractiveness Analysis, by Product
10. North America Chlor-alkali Market Analysis and Forecast, by Application
10.1. North America Chlor-alkali Market Volume (Kilo Tons) and Value (US$ Mn) Forecast, by Application, 2019–2030
10.1.1. Aluminum Processing
10.1.2. EDC/PVC
10.1.3. Chemical Processing
10.1.4. Dyestuff
10.1.5. Glass Manufacture
10.1.6. Food Processing
10.1.7. Pulp & Paper
10.1.8. Water Treatment
10.1.9. Soaps & Detergents
10.1.10. Others
10.2. North America Chlor-alkali Market Attractiveness Analysis, by Application
10.3. North America Chlor-alkali Market Volume (Kilo Tons) and Value (US$ Mn), by Country, 2019–2030
10.4. U.S. Chlor-alkali Market Volume (Kilo Tons) and Value (US$ Mn), by Product, 2019–2030
10.4.1. Caustic Soda
10.4.2. Chlorine
10.4.3. Soda Ash
10.4.4. Others
10.5. U.S. Chlor-alkali Market Volume (Kilo Tons) and Value (US$ Mn), by Application, 2019–2030
10.5.1. Aluminum Processing
10.5.2. EDC/PVC
10.5.3. Chemical Processing
10.5.4. Dyestuff
10.5.5. Glass Manufacture
10.5.6. Food Processing
10.5.7. Pulp & Paper
10.5.8. Water Treatment
10.5.9. Soaps & Detergents
10.5.10. Others
10.6. Canada Chlor-alkali Market Volume (Kilo Tons) and Value (US$ Mn), by Product, 2019–2030
10.6.1. Caustic Soda
10.6.2. Chlorine
10.6.3. Soda Ash
10.6.4. Others
10.7. Canada Chlor-alkali Market Volume (Kilo Tons) and Value (US$ Mn), by Application, 2019–2030
10.7.1. Aluminum Processing
10.7.2. EDC/PVC
10.7.3. Chemical Processing
10.7.4. Dyestuff
10.7.5. Glass Manufacture
10.7.6. Food Processing
10.7.7. Pulp & Paper
10.7.8. Water Treatment
10.7.9. Soaps & Detergents
10.7.10. Others
10.8. North America Chlor-alkali Market Share & Attractiveness Analysis, by Country, 2019–2030
11. Europe Chlor-alkali Market Analysis and Forecast, by Product
11.1. Europe Chlor-alkali Market Volume (Kilo Tons) and Value (US$ Mn) Forecast, by Product, 2019–2030
11.1.1. Caustic Soda
11.1.2. Chlorine
11.1.3. Soda Ash
11.1.4. Others
11.2. Europe Chlor-alkali Market Attractiveness Analysis, by Product
12. Europe Chlor-alkali Market Analysis and Forecast, by Application
12.1. Europe Chlor-alkali Market Volume (Kilo Tons) and Value (US$ Mn) Forecast, by Application, 2019–2030
12.1.1. Aluminum Processing
12.1.2. EDC/PVC
12.1.3. Chemical Processing
12.1.4. Dyestuff
12.1.5. Glass Manufacture
12.1.6. Food Processing
12.1.7. Pulp & Paper
12.1.8. Water Treatment
12.1.9. Soaps & Detergents
12.1.10. Others
12.2. Europe Chlor-alkali Market Attractiveness Analysis, by Application
12.3. Germany Chlor-alkali Market Volume (Kilo Tons) and Value (US$ Mn), by Product, 2019–2030
12.3.1. Caustic Soda
12.3.2. Chlorine
12.3.3. Soda Ash
12.3.4. Others
12.4. Germany Chlor-alkali Market Volume (Kilo Tons) and Value (US$ Mn), by Application, 2019–2030
12.4.1. Aluminum Processing
12.4.2. EDC/PVC
12.4.3. Chemical Processing
12.4.4. Dyestuff
12.4.5. Glass Manufacture
12.4.6. Food Processing
12.4.7. Pulp & Paper
12.4.8. Water Treatment
12.4.9. Soaps & Detergents
12.4.10. Others
12.5. France Chlor-alkali Market Volume (Kilo Tons) and Value (US$ Mn), by Product, 2019–2030
12.5.1. Caustic Soda
12.5.2. Chlorine
12.5.3. Soda Ash
12.5.4. Others
12.6. France Chlor-alkali Market Volume (Kilo Tons) and Value (US$ Mn), by Application, 2019–2030
12.6.1. Aluminum Processing
12.6.2. EDC/PVC
12.6.3. Chemical Processing
12.6.4. Dyestuff
12.6.5. Glass Manufacture
12.6.6. Food Processing
12.6.7. Pulp & Paper
12.6.8. Water Treatment
12.6.9. Soaps & Detergents
12.6.10. Others
12.7. U.K. Chlor-alkali Market Volume (Kilo Tons) and Value (US$ Mn), by Product, 2019–2030
12.7.1. Caustic Soda
12.7.2. Chlorine
12.7.3. Soda Ash
12.7.4. Others
12.8. U.K. Chlor-alkali Market Volume (Kilo Tons) and Value (US$ Mn), by Application, 2019–2030
12.8.1. Aluminum Processing
12.8.2. EDC/PVC
12.8.3. Chemical Processing
12.8.4. Dyestuff
12.8.5. Glass Manufacture
12.8.6. Food Processing
12.8.7. Pulp & Paper
12.8.8. Water Treatment
12.8.9. Soaps & Detergents
12.8.10. Others
12.9. Italy Chlor-alkali Market Volume (Kilo Tons) and Value (US$ Mn), by Product, 2019–2030
12.9.1. Caustic Soda
12.9.2. Chlorine
12.9.3. Soda Ash
12.9.4. Others
12.10. Italy Chlor-alkali Market Volume (Kilo Tons) and Value (US$ Mn), by Application, 2019–2030
12.10.1. Aluminum Processing
12.10.2. EDC/PVC
12.10.3. Chemical Processing
12.10.4. Dyestuff
12.10.5. Glass Manufacture
12.10.6. Food Processing
12.10.7. Pulp & Paper
12.10.8. Water Treatment
12.10.9. Soaps & Detergents
12.10.10. Others
12.11. Spain Chlor-alkali Market Volume (Kilo Tons) and Value (US$ Mn), by Product, 2019–2030
12.11.1. Caustic Soda
12.11.2. Chlorine
12.11.3. Soda Ash
12.11.4. Others
12.12. Spain Chlor-alkali Market Volume (Kilo Tons) and Value (US$ Mn), by Application, 2019–2030
12.12.1. Aluminum Processing
12.12.2. EDC/PVC
12.12.3. Chemical Processing
12.12.4. Dyestuff
12.12.5. Glass Manufacture
12.12.6. Food Processing
12.12.7. Pulp & Paper
12.12.8. Water Treatment
12.12.9. Soaps & Detergents
12.12.10. Others
12.13. Russia & CIS Chlor-alkali Market Volume (Kilo Tons) and Value (US$ Mn), by Product, 2019–2030
12.13.1. Caustic Soda
12.13.2. Chlorine
12.13.3. Soda Ash
12.13.4. Others
12.14. Russia & CIS Chlor-alkali Market Volume (Kilo Tons) and Value (US$ Mn), by Application, 2019–2030
12.14.1. Aluminum Processing
12.14.2. EDC/PVC
12.14.3. Chemical Processing
12.14.4. Dyestuff
12.14.5. Glass Manufacture
12.14.6. Food Processing
12.14.7. Pulp & Paper
12.14.8. Water Treatment
12.14.9. Soaps & Detergents
12.14.10. Others
12.15. Rest of Europe Chlor-alkali Market Volume (Kilo Tons) and Value (US$ Mn), by Product, 2019–2030
12.15.1. Caustic Soda
12.15.2. Chlorine
12.15.3. Soda Ash
12.15.4. Others
12.16. Rest of Europe Chlor-alkali Market Volume (Kilo Tons) and Value (US$ Mn), by Application, 2019–2030
12.16.1. Aluminum Processing
12.16.2. EDC/PVC
12.16.3. Chemical Processing
12.16.4. Dyestuff
12.16.5. Glass Manufacture
12.16.6. Food Processing
12.16.7. Pulp & Paper
12.16.8. Water Treatment
12.16.9. Soaps & Detergents
12.16.10. Others
12.17. Europe Chlor-alkali Market Share & Attractiveness Analysis, by Country and Sub-region, 2019–2030
13. Asia Pacific Chlor-alkali Market Analysis and Forecast, by Product
13.1. Asia Pacific Chlor-alkali Market Volume (Kilo Tons) and Value (US$ Mn) Forecast, by Product, 2019–2030
13.1.1. Caustic Soda
13.1.2. Chlorine
13.1.3. Soda Ash
13.1.4. Others
13.2. Asia Pacific Chlor-alkali Market Attractiveness Analysis, by Product
14. Asia Pacific Chlor-alkali Market Analysis and Forecast, by Application
14.1. Asia Pacific Chlor-alkali Market Volume (Kilo Tons) and Value (US$ Mn) Forecast, by Application, 2019–2030
14.1.1. Aluminum Processing
14.1.2. EDC/PVC
14.1.3. Chemical Processing
14.1.4. Dyestuff
14.1.5. Glass Manufacture
14.1.6. Food Processing
14.1.7. Pulp & Paper
14.1.8. Water Treatment
14.1.9. Soaps & Detergents
14.1.10. Others
14.2. Asia Pacific Chlor-alkali Market Attractiveness Analysis, by Application
14.3. China Chlor-alkali Market Volume (Kilo Tons) and Value (US$ Mn), by Product, 2019–2030
14.3.1. Caustic Soda
14.3.2. Chlorine
14.3.3. Soda Ash
14.3.4. Others
14.4. China Chlor-alkali Market Volume (Kilo Tons) and Value (US$ Mn), by Application, 2019–2030
14.4.1. Aluminum Processing
14.4.2. EDC/PVC
14.4.3. Chemical Processing
14.4.4. Dyestuff
14.4.5. Glass Manufacture
14.4.6. Food Processing
14.4.7. Pulp & Paper
14.4.8. Water Treatment
14.4.9. Soaps & Detergents
14.4.10. Others
14.5. India Chlor-alkali Market Volume (Kilo Tons) and Value (US$ Mn), by Product, 2019–2030
14.5.1. Caustic Soda
14.5.2. Chlorine
14.5.3. Soda Ash
14.5.4. Others
14.6. India Chlor-alkali Market Volume (Kilo Tons) and Value (US$ Mn), by Application, 2019–2030
14.6.1. Aluminum Processing
14.6.2. EDC/PVC
14.6.3. Chemical Processing
14.6.4. Dyestuff
14.6.5. Glass Manufacture
14.6.6. Food Processing
14.6.7. Pulp & Paper
14.6.8. Water Treatment
14.6.9. Soaps & Detergents
14.6.10. Others
14.7. Japan Chlor-alkali Market Volume (Kilo Tons) and Value (US$ Mn), by Product, 2019–2030
14.7.1. Caustic Soda
14.7.2. Chlorine
14.7.3. Soda Ash
14.7.4. Others
14.8. Japan Chlor-alkali Market Volume (Kilo Tons) and Value (US$ Mn), by Application, 2019–2030
14.8.1. Aluminum Processing
14.8.2. EDC/PVC
14.8.3. Chemical Processing
14.8.4. Dyestuff
14.8.5. Glass Manufacture
14.8.6. Food Processing
14.8.7. Pulp & Paper
14.8.8. Water Treatment
14.8.9. Soaps & Detergents
14.8.10. Others
14.9. ASEAN Chlor-alkali Market Volume (Kilo Tons) and Value (US$ Mn), by Product, 2019–2030
14.9.1. Caustic Soda
14.9.2. Chlorine
14.9.3. Soda Ash
14.9.4. Others
14.10. ASEAN Chlor-alkali Market Volume (Kilo Tons) and Value (US$ Mn), by Application, 2019–2030
14.10.1. Aluminum Processing
14.10.2. EDC/PVC
14.10.3. Chemical Processing
14.10.4. Dyestuff
14.10.5. Glass Manufacture
14.10.6. Food Processing
14.10.7. Pulp & Paper
14.10.8. Water Treatment
14.10.9. Soaps & Detergents
14.10.10. Others
14.11. Rest of Asia Pacific Chlor-alkali Market Volume (Kilo Tons) and Value (US$ Mn), by Product, 2019–2030
14.11.1. Caustic Soda
14.11.2. Chlorine
14.11.3. Soda Ash
14.11.4. Others
14.12. Rest of Asia Pacific Chlor-alkali Market Volume (Kilo Tons) and Value (US$ Mn), by Application, 2019–2030
14.12.1. Aluminum Processing
14.12.2. EDC/PVC
14.12.3. Chemical Processing
14.12.4. Dyestuff
14.12.5. Glass Manufacture
14.12.6. Food Processing
14.12.7. Pulp & Paper
14.12.8. Water Treatment
14.12.9. Soaps & Detergents
14.12.10. Others
14.13. Asia Pacific Chlor-alkali Market Share & Attractiveness Analysis, by Country and Sub-region, 2019–2030
15. Latin America Chlor-alkali Market Analysis and Forecast, by Product
15.1. Latin America Chlor-alkali Market Volume (Kilo Tons) and Value (US$ Mn) Forecast, by Product, 2019–2030
15.1.1. Caustic Soda
15.1.2. Chlorine
15.1.3. Soda Ash
15.1.4. Others
15.2. Latin America Chlor-alkali Market Attractiveness Analysis, by Product
16. Latin America Chlor-alkali Market Analysis and Forecast, by Application
16.1. Latin America Chlor-alkali Market Volume (Kilo Tons) and Value (US$ Mn) Forecast, by Application, 2019–2030
16.1.1. Aluminum Processing
16.1.2. EDC/PVC
16.1.3. Chemical Processing
16.1.4. Dyestuff
16.1.5. Glass Manufacture
16.1.6. Food Processing
16.1.7. Pulp & Paper
16.1.8. Water Treatment
16.1.9. Soaps & Detergents
16.1.10. Others
16.2. Latin America Chlor-alkali Market Attractiveness Analysis, by Application
16.3. Brazil Chlor-alkali Market Volume (Kilo Tons) and Value (US$ Mn), by Product, 2019–2030
16.3.1. Caustic Soda
16.3.2. Chlorine
16.3.3. Soda Ash
16.3.4. Others
16.4. Brazil Chlor-alkali Market Volume (Kilo Tons) and Value (US$ Mn), by Application, 2019–2030
16.4.1. Aluminum Processing
16.4.2. EDC/PVC
16.4.3. Chemical Processing
16.4.4. Dyestuff
16.4.5. Glass Manufacture
16.4.6. Food Processing
16.4.7. Pulp & Paper
16.4.8. Water Treatment
16.4.9. Soaps & Detergents
16.4.10. Others
16.5. Mexico Chlor-alkali Market Volume (Kilo Tons) and Value (US$ Mn), by Product, 2019–2030
16.5.1. Caustic Soda
16.5.2. Chlorine
16.5.3. Soda Ash
16.5.4. Others
16.6. Mexico Chlor-alkali Market Volume (Kilo Tons) and Value (US$ Mn), by Application, 2019–2030
16.6.1. Aluminum Processing
16.6.2. EDC/PVC
16.6.3. Chemical Processing
16.6.4. Dyestuff
16.6.5. Glass Manufacture
16.6.6. Food Processing
16.6.7. Pulp & Paper
16.6.8. Water Treatment
16.6.9. Soaps & Detergents
16.6.10. Others
16.7. Rest of Latin America Chlor-alkali Market Volume (Kilo Tons) and Value (US$ Mn), by Product, 2019–2030
16.7.1. Caustic Soda
16.7.2. Chlorine
16.7.3. Soda Ash
16.7.4. Others
16.8. Rest of Latin America Chlor-alkali Market Volume (Kilo Tons) and Value (US$ Mn), by Application, 2019–2030
16.8.1. Aluminum Processing
16.8.2. EDC/PVC
16.8.3. Chemical Processing
16.8.4. Dyestuff
16.8.5. Glass Manufacture
16.8.6. Food Processing
16.8.7. Pulp & Paper
16.8.8. Water Treatment
16.8.9. Soaps & Detergents
16.8.10. Others
16.9. Latin America Chlor-alkali Market Share & Attractiveness Analysis, by Country and Sub-region, 2019–2030
17. Middle East & Africa Chlor-alkali Market Analysis and Forecast, by Product
17.1. Middle East & Africa Chlor-alkali Market Volume (Kilo Tons) and Value (US$ Mn) Forecast, by Product, 2019–2030
17.1.1. Caustic Soda
17.1.2. Chlorine
17.1.3. Soda Ash
17.1.4. Others
17.2. Middle East & Africa Chlor-alkali Market Attractiveness Analysis, by Product
18. Middle East & Africa Chlor-alkali Market Analysis and Forecast, by Application
18.1. Middle East & Africa Chlor-alkali Market Volume (Kilo Tons) and Value (US$ Mn) Forecast, by Application, 2019–2030
18.1.1. Aluminum Processing
18.1.2. EDC/PVC
18.1.3. Chemical Processing
18.1.4. Dyestuff
18.1.5. Glass Manufacture
18.1.6. Food Processing
18.1.7. Pulp & Paper
18.1.8. Water Treatment
18.1.9. Soaps & Detergents
18.1.10. Others
18.2. Middle East & Africa Chlor-alkali Market Attractiveness Analysis, by Application
18.3. GCC Chlor-alkali Market Volume (Kilo Tons) and Value (US$ Mn), by Product, 2019–2030
18.3.1. Caustic Soda
18.3.2. Chlorine
18.3.3. Soda Ash
18.3.4. Others
18.4. GCC Chlor-alkali Market Volume (Kilo Tons) and Value (US$ Mn), by Application, 2019–2030
18.4.1. Aluminum Processing
18.4.2. EDC/PVC
18.4.3. Chemical Processing
18.4.4. Dyestuff
18.4.5. Glass Manufacture
18.4.6. Food Processing
18.4.7. Pulp & Paper
18.4.8. Water Treatment
18.4.9. Soaps & Detergents
18.4.10. Others
18.5. South Africa Chlor-alkali Market Volume (Kilo Tons) and Value (US$ Mn), by Product, 2019–2030
18.5.1. Caustic Soda
18.5.2. Chlorine
18.5.3. Soda Ash
18.5.4. Others
18.6. South Africa Chlor-alkali Market Volume (Kilo Tons) and Value (US$ Mn), by Application, 2019–2030
18.6.1. Aluminum Processing
18.6.2. EDC/PVC
18.6.3. Chemical Processing
18.6.4. Dyestuff
18.6.5. Glass Manufacture
18.6.6. Food Processing
18.6.7. Pulp & Paper
18.6.8. Water Treatment
18.6.9. Soaps & Detergents
18.6.10. Others
18.7. Rest of Middle East & Africa Chlor-alkali Market Volume (Kilo Tons) and Value (US$ Mn), by Product, 2019–2030
18.7.1. Caustic Soda
18.7.2. Chlorine
18.7.3. Soda Ash
18.7.4. Others
18.8. Rest of Middle East & Africa Chlor-alkali Market Volume (Kilo Tons) and Value (US$ Mn), by Application, 2019–2030
18.8.1. Aluminum Processing
18.8.2. EDC/PVC
18.8.3. Chemical Processing
18.8.4. Dyestuff
18.8.5. Glass Manufacture
18.8.6. Food Processing
18.8.7. Pulp & Paper
18.8.8. Water Treatment
18.8.9. Soaps & Detergents
18.8.10. Others
18.9. Middle East & Africa Chlor-alkali Market Share & Attractiveness Analysis, by Country and Sub-region, 2019–2030
19. Competition Landscape
19.1. Global Chlor-alkali Market Share Analysis, by Company (2018)
19.2. Competition Matrix, by Key Players
19.3. Company Profiles
19.3.1. Dow
19.3.1.1. Company Description
19.3.1.2. Business Overview
19.3.1.3. Financial Overview
19.3.2. Akzo Nobel N.V
19.3.2.1. Company Description
19.3.2.2. Business Overview
19.3.2.3. Financial Overview
19.3.2.4. Strategic Overview
19.3.3. Solvay
19.3.3.1. Company Description
19.3.3.2. Business Overview
19.3.3.3. Financial Overview
19.3.3.4. Strategic Overview
19.3.4. Tata Chemicals Ltd.
19.3.4.1. Company Description
19.3.4.2. Business Overview
19.3.4.3. Financial Overview
19.3.4.4. Strategic Overview
19.3.5. INEOS
19.3.5.1. Company Description
19.3.5.2. Business Overview
19.3.5.3. Financial Overview
19.3.5.4. Strategic Overview
19.3.6. Occidental Petroleum Corporation
19.3.6.1. Company Description
19.3.6.2. Business Overview
19.3.6.3. Financial Overview
19.3.7. NIRMA Limited
19.3.7.1. Company Description
19.3.7.2. Business Overview
19.3.7.3. Financial Overview
19.3.8. Olin Corporation
19.3.8.1. Company Description
19.3.8.2. Business Overview
19.3.8.3. Financial Overview
19.3.8.4. Strategic Overview
19.3.9. Kemira
19.3.9.1. Company Description
19.3.9.2. Business Overview
19.3.9.3. Financial Overview
19.3.10. Tosoh Corporation
19.3.10.1. Company Description
19.3.10.2. Business Overview
19.3.10.3. Financial Overview
19.3.10.4. Strategic Overview
19.3.11. Hanwha Chemical Corporation
19.3.11.1. Company Description
19.3.11.2. Business Overview
19.3.11.3. Financial Overview
19.3.12. Vynova Group
19.3.12.1. Company Description
19.3.12.2. Business Overview
19.3.12.3. Financial Overview
19.3.12.4. Strategic Overview
19.3.13. DCM Shriram
19.3.13.1. Company Description
19.3.13.2. Business Overview
19.3.13.3. Financial Overview
19.3.13.4. Strategic Overview
19.3.14. Aditya Birla Chemicals
19.3.14.1. Company Description
19.3.14.2. Business Overview
19.3.14.3. Financial Overview
19.3.15. AGC Inc.
19.3.15.1. Company Description
19.3.15.2. Business Overview
19.3.15.3. Financial Overview
19.3.15.4. Strategic Overview
20. Key Primary Insights
List of Tables
Table 1 Global Chlor-alkali Market Volume (Kilo Tons) and Value (US$ Mn) Forecast, by Product, 2019–2030
Table 2 Global Chlor-alkali Market Volume (Kilo Tons) and Value (US$ Mn) Forecast, by Application, 2019–2030
Table 3 North America Chlor-alkali Market Volume (Kilo Tons) and Value (US$ Mn) Forecast, by Product, 2019–2030
Table 4 North America Chlor-alkali Market Volume (Kilo Tons) and Value (US$ Mn) Forecast, by Application, 2019–2030
Table 5 North America Chlor-alkali Market Volume (Kilo Tons) and Value (US$ Mn) Forecast, by Country, 2019–2030
Table 6 U.S. Chlor-alkali Market Volume (Kilo Tons) and Value (US$ Mn) Forecast, by Product, 2019–2030
Table 7 U.S. Chlor-alkali Market Volume (Kilo Tons) and Value (US$ Mn) Forecast, by Application, 2019–2030
Table 8 Canada Chlor-alkali Market Volume (Kilo Tons) and Value (US$ Mn) Forecast, by Product, 2019–2030
Table 9 Canada Chlor-alkali Market Volume (Kilo Tons) and Value (US$ Mn) Forecast, by Application, 2019–2030
Table 10 Europe Chlor-alkali Market Volume (Kilo Tons) and Value (US$ Mn) Forecast, by Product, 2019–2030
Table 11 Europe Chlor-alkali Market Volume (Kilo Tons) and Value (US$ Mn) Forecast, by Application, 2019–2030
Table 12 Europe Chlor-alkali Market Volume (Kilo Tons) and Value (US$ Mn) Forecast, by Country and Sub-region, 2019–2030
Table 13 Germany Chlor-alkali Market Volume (Kilo Tons) and Value (US$ Mn) Forecast, by Product, 2019–2030
Table 14 Germany Chlor-alkali Market Volume (Kilo Tons) and Value (US$ Mn) Forecast, by Application, 2019–2030
Table 15 France Chlor-alkali Market Volume (Kilo Tons) and Value (US$ Mn) Forecast, by Product, 2019–2030
Table 16 France Chlor-alkali Market Volume (Kilo Tons) and Value (US$ Mn) Forecast, by Application, 2019–2030
Table 17 U.K. Chlor-alkali Market Volume (Kilo Tons) and Value (US$ Mn) Forecast, by Product, 2019–2030
Table 18 U.K. Chlor-alkali Market Volume (Kilo Tons) and Value (US$ Mn) Forecast, by Application, 2019–2030
Table 19 Italy Chlor-alkali Market Volume (Kilo Tons) and Value (US$ Mn) Forecast, by Product, 2019–2030
Table 20 Italy Chlor-alkali Market Volume (Kilo Tons) and Value (US$ Mn) Forecast, by Application, 2019–2030
Table 21 Spain Chlor-alkali Market Volume (Kilo Tons) and Value (US$ Mn) Forecast, by Product, 2019–2030
Table 22 Spain Chlor-alkali Market Volume (Kilo Tons) and Value (US$ Mn) Forecast, by Application, 2019–2030
Table 23 Russia & CIS Chlor-alkali Market Volume (Kilo Tons) and Value (US$ Mn) Forecast, by Product, 2019–2030
Table 24 Russia & CIS Chlor-alkali Market Volume (Kilo Tons) and Value (US$ Mn) Forecast, by Application, 2019–2030
Table 25 Rest of Europe Chlor-alkali Market Volume (Kilo Tons) and Value (US$ Mn) Forecast, by Product, 2019–2030
Table 26 Rest of Europe Chlor-alkali Market Volume (Kilo Tons) and Value (US$ Mn) Forecast, by Application, 2019–2030
Table 27 Asia Pacific Chlor-alkali Market Volume (Kilo Tons) and Value (US$ Mn) Forecast, by Product, 2019–2030
Table 28 Asia Pacific Chlor-alkali Market Volume (Kilo Tons) and Value (US$ Mn) Forecast, by Application, 2019–2030
Table 29 Asia Pacific Chlor-alkali Market Volume (Kilo Tons) and Value (US$ Mn) Forecast, by Country and Sub-region, 2019–2030
Table 30 China Chlor-alkali Market Volume (Kilo Tons) and Value (US$ Mn) Forecast, by Product, 2019–2030
Table 31 China Chlor-alkali Market Volume (Kilo Tons) and Value (US$ Mn) Forecast, by Application, 2019–2030
Table 32 Japan Chlor-alkali Market Volume (Kilo Tons) and Value (US$ Mn) Forecast, by Product, 2019–2030
Table 33 Japan Chlor-alkali Market Volume (Kilo Tons) and Value (US$ Mn) Forecast, by Application, 2019–2030
Table 34 India Chlor-alkali Market Volume (Kilo Tons) and Value (US$ Mn) Forecast, by Product, 2019–2030
Table 35 India Chlor-alkali Market Volume (Kilo Tons) and Value (US$ Mn) Forecast, by Application, 2019–2030
Table 36 ASEAN Chlor-alkali Market Volume (Kilo Tons) and Value (US$ Mn) Forecast, by Product, 2019–2030
Table 37 ASEAN Chlor-alkali Market Volume (Kilo Tons) and Value (US$ Mn) Forecast, by Application, 2019–2030
Table 38 Rest of Asia Pacific Chlor-alkali Market Volume (Kilo Tons) and Value (US$ Mn) Forecast, by Product, 2019–2030
Table 39 Rest of Asia Pacific Chlor-alkali Market Volume (Kilo Tons) and Value (US$ Mn) Forecast, by Application, 2019–2030
Table 40 Latin America Chlor-alkali Market Volume (Kilo Tons) and Value (US$ Mn) Forecast, by Product, 2019–2030
Table 41 Latin America Chlor-alkali Market Volume (Kilo Tons) and Value (US$ Mn) Forecast, by Application, 2019–2030
Table 42 Latin America Chlor-alkali Market Volume (Kilo Tons) and Value (US$ Mn) Forecast, by Country and Sub-region, 2019–2030
Table 43 Brazil Chlor-alkali Market Volume (Kilo Tons) and Value (US$ Mn) Forecast, by Product, 2019–2030
Table 44 Brazil Chlor-alkali Market Volume (Kilo Tons) and Value (US$ Mn) Forecast, by Application, 2019–2030
Table 45 Mexico Chlor-alkali Market Volume (Kilo Tons) and Value (US$ Mn) Forecast, by Product, 2019–2030
Table 46 Mexico Chlor-alkali Market Volume (Kilo Tons) and Value (US$ Mn) Forecast, by Application, 2019–2030
Table 47 Rest of Latin America Chlor-alkali Market Volume (Kilo Tons) and Value (US$ Mn) Forecast, by Product, 2019–2030
Table 48 Rest of Latin America Chlor-alkali Market Volume (Kilo Tons) and Value (US$ Mn) Forecast, by Application, 2019–2030
Table 49 Middle East & Africa Chlor-alkali Market Volume (Kilo Tons) and Value (US$ Mn) Forecast, by Product, 2019–2030
Table 50 Middle East & Africa Chlor-alkali Market Volume (Kilo Tons) and Value (US$ Mn) Forecast, by Application, 2019–2030
Table 51 Middle East & Africa Chlor-alkali Market Volume (Kilo Tons) and Value (US$ Mn) Forecast, by Country and Sub-region, 2019–2030
Table 52 GCC Chlor-alkali Market Volume (Kilo Tons) and Value (US$ Mn) Forecast, by Product, 2019–2030
Table 53 GCC Chlor-alkali Market Volume (Kilo Tons) and Value (US$ Mn) Forecast, by Application, 2019–2030
Table 54 South Africa Chlor-alkali Market Volume (Kilo Tons) and Value (US$ Mn) Forecast, by Product, 2019–2030
Table 55 South Africa Chlor-alkali Market Volume (Kilo Tons) and Value (US$ Mn) Forecast, by Application, 2019–2030
Table 56 Rest of Middle East & Africa Chlor-alkali Market Volume (Kilo Tons) and Value (US$ Mn) Forecast, by Product, 2019–2030
Table 57 Rest of Middle East & Africa Chlor-alkali Market Volume (Kilo Tons) and Value (US$ Mn) Forecast, by Application, 2019–2030
List of Figures
Figure 1 Global Chlor-alkali Market Share Analysis, by Product
Figure 2 Global Chlor-alkali Market Attractiveness Analysis, by Product
Figure 3 Global Chlor-alkali Market Volume (Kilo Tons) and Value (US$ Mn), 2019–2030
Figure 4 Global Chlor-alkali Market Share Analysis, by Application
Figure 5 Global Chlor-alkali Market Attractiveness Analysis, by Application
Figure 6 North America Chlor-alkali Market Volume (Kilo Tons) and Value (US$ Mn), 2019–2030
Figure 7 North America Chlor-alkali Market Share Analysis, by Product
Figure 8 North America Chlor-alkali Market Attractiveness Analysis, by Product
Figure 9 North America Chlor-alkali Market Share Analysis, by Application
Figure 10 North America Chlor-alkali Market Attractiveness Analysis, by Application
Figure 11 North America Chlor-alkali Market Share Analysis, by Country
Figure 12 North America Chlor-alkali Market Attractiveness Analysis, by Country
Figure 13 Europe Chlor-alkali Market Volume (Kilo Tons) and Value (US$ Mn), 2019–2030
Figure 14 Europe Chlor-alkali Market Share Analysis, by Product
Figure 15 Europe Chlor-alkali Market Attractiveness Analysis, by Product
Figure 16 Europe Chlor-alkali Market Share Analysis, by Application
Figure 17 Europe Chlor-alkali Market Attractiveness Analysis, by Application
Figure 18 Europe Chlor-alkali Market Share Analysis, by Country and Sub-region
Figure 19 Europe Chlor-alkali Market Attractiveness Analysis, by Country and Sub-region
Figure 20 Asia Pacific Chlor-alkali Market Volume (Kilo Tons) and Value (US$ Mn), 2019–2030
Figure 21 Asia Pacific Chlor-alkali Market Share Analysis, by Product
Figure 22 Asia Pacific Chlor-alkali Market Attractiveness Analysis, by Product
Figure 23 Asia Pacific Chlor-alkali Market Share Analysis, by Application
Figure 24 Asia Pacific Chlor-alkali Market Attractiveness Analysis, by Application
Figure 25 Asia Pacific Chlor-alkali Market Share Analysis, by Country and Sub-region
Figure 26 Asia Pacific Chlor-alkali Market Attractiveness Analysis, by Country and Sub-region
Figure 27 Latin America Chlor-alkali Market Volume (Kilo Tons) and Value (US$ Mn), 2019–2030
Figure 28 Latin America Chlor-alkali Market Share Analysis, by Product
Figure 29 Latin America Chlor-alkali Market Attractiveness Analysis, by Product
Figure 30 Latin America Chlor-alkali Market Share Analysis, by Application
Figure 31 Latin America Chlor-alkali Market Attractiveness Analysis, by Application
Figure 32 Latin America Chlor-alkali Market Share Analysis, by Country and Sub-region
Figure 33 Latin America Chlor-alkali Market Attractiveness Analysis, by Country and Sub-region
Figure 34 Middle East & Africa Chlor-alkali Market Volume (Kilo Tons) and Value (US$ Mn), 2019–2030
Figure 35 Middle East & Africa Chlor-alkali Market Share Analysis, by Product
Figure 36 Middle East & Africa Chlor-alkali Market Attractiveness Analysis, by Product
Figure 37 Middle East & Africa Chlor-alkali Market Share Analysis, by Application
Figure 38 Middle East & Africa Chlor-alkali Market Attractiveness Analysis, by Application
Figure 39 Middle East & Africa Chlor-alkali Market Share Analysis, by Country and Sub-region
Figure 40 Middle East & Africa Chlor-alkali Market Attractiveness Analysis, by Country and Sub-region
Figure 41 Chlor-alkali Market Share Analysis, by Company
Copyright © Transparency Market Research, Inc. All Rights reserved
Trust Online


Chlor-alkali Market