
Global 3D Animation Market: Snapshot
The global 3D animation market has grown hand in hand with the rising use of digital imaging and modeling technologies and has now become an integral part of several end use sectors. The global 3D animation market is likely to undergo rapid growth over the 2017-2022 forecast period due to consistent growth in demand from leading end users such as the media and entertainment sector. The rising utility of 3D animation technology due to complementary upgrades in other areas of the digital imaging sector is likely to drive smooth growth of the global 3D animation market over the coming years. The global 3D animation market is likely to exhibit a strong 14.5% CAGR over the 2017-2022 forecast period, according to Transparency Market Research.
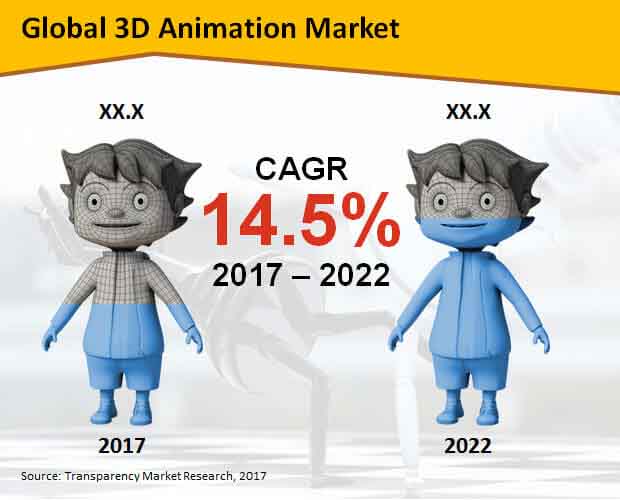
The global 3D animation market is likely to reach a valuation of US$13.6 bn by the end of 2017 and further rise to US$26.8 bn by the end of 2022. Growth of the global 3D animation market is driven primarily by the growing sophistication of 3D animation technology, which has diversified its utility and stretched the boundaries of what the 3D animation market is capable of and where it can be applied.
Video Cards and GPU to Remain Dominant Hardware Component in 3D Animation Market
By hardware type, the report segments the global 3D animation market into video card and GPU, motion capturing systems, workstations, and other hardware. Of these, video cards and GPU are likely to remain the dominant contributor to the global 3D animation market in the coming years due to the crucial importance of these components of the final output of the 3D animation processes. The video cards and GPU segment accounted for 35.7% of the global 3D animation market in 2017, with a valuation of more than US$4.8 bn, and is likely to rise to a valuation of US$9.7 bn by the end of 2022, accounting for 36.4% of the global 3D animation market.
Media and Entertainment Industry to Dominate Demand from 3D Animation Market
By end use, the global 3D animation market is segmented into media and entertainment, construction and engineering, architecture, manufacturing, healthcare, education, and others. The media and entertainment sector is likely to dominate demand from the global 3D animation market over the 2017-2022 forecast period due to the diverse applicability of 3D animation in the entertainment sector. The construction and engineering and manufacturing sectors are likely to remain important contributors to the global 3D animation market due to the rising prominence of 3D modeling in these sectors.
North America to Remain Leading Regional Market for 3D Animation
Geographically, the global 3D animation market is dominated by North America, which accounted for more than a third of the global market in 2017. The North America 3D animation market is likely to reach a valuation of US$4.6 bn by the end of 2017 and further rise to close to US$10.4 bn by the end of 2022, at an attractive 17.4% CAGR therein. This will ensure North America remaining the dominant regional contributor to the global 3D animation market over the 2017-2022 forecast period.
Global 3D Animation Market: Competitive Dynamics
Leading companies in the global 3D animation market include Autodesk Inc., Adobe Systems Inc., Nemetschek SE, NewTek Inc., NVIDIA Corp., Side Effects Software Inc., Smith Micro Software Inc., Intel Corp., BOXX Technologies Inc., and Advanced Micro Devices Inc. The global 3D animation market could witness the entry of several new players over the coming years due to the lucrative prospects of the market over the 2017-2022 forecast period.
Increasing Use of Digital Collaterals for Corporate Branding to Drive Sales across the Global 3D Animation Market
Presence of an ever-evolving digital industry has created new avenues for growth across the global 3D animation market. There has been an increase in the use of animated videos for online promotions and social engagement by corporate house and large brands. The central role played by 3D animations towards enhancing the brand presence of companies has given an impetus to the growth of the global market. Furthermore, the entertainment industry has also emerged as a prominent consumer of 3D animations in recent years. Until a decade ago, animated movies and series were only on the periphery of the entertainment industry. However, with passage of time, the relevance of these animations in the entertainment industry has become more pronounced.
1. Global 3D Animation Market - Executive Summary
2. Global 3D Animation Market Overview
2.1. Introduction
2.1.1. Global 3D Animation Market Taxonomy
2.1.2. Global 3D Animation Market Definition
2.2. Global 3D Animation Market Size (US$ Mn) and Forecast, 2012-2022
2.2.1. Global 3D Animation Market Y-o-Y Growth
2.3. Global 3D Animation Market Dynamics
2.4. Value Chain
2.5. Key Contracts
2.6. Regional Trends
2.7. Software providers List
2.8. Competitive landscape
2.9. Key Participants Market Presence (Intensity Map) By Region
3. Global 3D Animation Market Analysis and Forecast By Hardware
3.1. Global 3D Animation Market Size and Forecast By Hardware, 2012-2022
3.1.1. Video Card & GPU Market Size and Forecast, 2012-2022
3.1.1.1. Revenue (US$ Mn) Comparison, By Region
3.1.1.2. Market Share Comparison, By Region
3.1.1.3. Y-o-Y growth Comparison, By Region
3.1.2. Motion Capturing Systems Market Size and Forecast, 2012-2022
3.1.2.1. Revenue (US$ Mn) Comparison, By Region
3.1.2.2. Market Share Comparison, By Region
3.1.2.3. Y-o-Y growth Comparison, By Region
3.1.3. Workstation Market Size and Forecast, 2012-2022
3.1.3.1. Revenue (US$ Mn) Comparison, By Region
3.1.3.2. Market Share Comparison, By Region
3.1.3.3. Y-o-Y growth Comparison, By Region
3.1.4. Other Hardware Market Size and Forecast, 2012-2022
3.1.4.1. Revenue (US$ Mn) Comparison, By Region
3.1.4.2. Market Share Comparison, By Region
3.1.4.3. Y-o-Y growth Comparison, By Region
4. Global 3D Animation Market Analysis and Forecast By Software
4.1. Global 3D Animation Market Size and Forecast By Software , 2012-2022
4.1.1. Plug-in Software Market Size and Forecast, 2012-2022
4.1.1.1. Revenue (US$ Mn) Comparison, By Region
4.1.1.2. Market Share Comparison, By Region
4.1.1.3. Y-o-Y growth Comparison, By Region
4.1.2. Software Platform Market Size and Forecast, 2012-2022
4.1.2.1. Revenue (US$ Mn) Comparison, By Region
4.1.2.2. Market Share Comparison, By Region
4.1.2.3. Y-o-Y growth Comparison, By Region
4.1.3. SDK Market Size and Forecast, 2012-2022
4.1.3.1. Revenue (US$ Mn) Comparison, By Region
4.1.3.2. Market Share Comparison, By Region
4.1.3.3. Y-o-Y growth Comparison, By Region
4.1.4. Others Market Size and Forecast, 2012-2022
4.1.4.1. Revenue (US$ Mn) Comparison, By Region
4.1.4.2. Market Share Comparison, By Region
4.1.4.3. Y-o-Y growth Comparison, By Region
5. Global 3D Animation Market Analysis and Forecast By Deployment
5.1. Global 3D Animation Market Size and Forecast By Deployment, 2012-2022
5.1.1. On-Premises Market Size and Forecast, 2012-2022
5.1.1.1. Revenue (US$ Mn) Comparison, By Region
5.1.1.2. Market Share Comparison, By Region
5.1.1.3. Y-o-Y growth Comparison, By Region
5.1.2. Cloud Market Size and Forecast, 2012-2022
5.1.2.1. Revenue (US$ Mn) Comparison, By Region
5.1.2.2. Market Share Comparison, By Region
5.1.2.3. Y-o-Y growth Comparison, By Region
6. Global 3D Animation Market Analysis and Forecast By Industry
6.1. Global 3D Animation Market Size and Forecast By Industry, 2012-2022
6.1.1. Media & Entertainment Market Size and Forecast, 2012-2022
6.1.1.1. Revenue (US$ Mn) Comparison, By Region
6.1.1.2. Market Share Comparison, By Region
6.1.1.3. Y-o-Y growth Comparison, By Region
6.1.2. Construction & Engineering Market Size and Forecast, 2012-2022
6.1.2.1. Revenue (US$ Mn) Comparison, By Region
6.1.2.2. Market Share Comparison, By Region
6.1.2.3. Y-o-Y growth Comparison, By Region
6.1.3. Architecture Market Size and Forecast, 2012-2022
6.1.3.1. Revenue (US$ Mn) Comparison, By Region
6.1.3.2. Market Share Comparison, By Region
6.1.3.3. Y-o-Y growth Comparison, By Region
6.1.4. Manufacturing Market Size and Forecast, 2012-2022
6.1.4.1. Revenue (US$ Mn) Comparison, By Region
6.1.4.2. Market Share Comparison, By Region
6.1.4.3. Y-o-Y growth Comparison, By Region
6.1.5. Healthcare Market Size and Forecast, 2012-2022
6.1.5.1. Revenue (US$ Mn) Comparison, By Region
6.1.5.2. Market Share Comparison, By Region
6.1.5.3. Y-o-Y growth Comparison, By Region
6.1.6. Education Market Size and Forecast, 2012-2022
6.1.6.1. Revenue (US$ Mn) Comparison, By Region
6.1.6.2. Market Share Comparison, By Region
6.1.6.3. Y-o-Y growth Comparison, By Region
6.1.7. Other Industry Market Size and Forecast, 2012-2022
6.1.7.1. Revenue (US$ Mn) Comparison, By Region
6.1.7.2. Market Share Comparison, By Region
6.1.7.3. Y-o-Y growth Comparison, By Region
7. Global 3D Animation Market Analysis and Forecast By Region
7.1. Global 3D Animation Market Size and Forecast, 2012-2022
7.1.1. North America 3D Animation Market Size and Forecast, 2012-2022
7.1.1.1. Revenue (US$ Mn) Comparison, By Hardware
7.1.1.2. Revenue (US$ Mn) Comparison, By Software
7.1.1.3. Revenue (US$ Mn) Comparison, By Deployment
7.1.1.4. Revenue (US$ Mn) Comparison, By Industry
7.1.2. Latin America 3D Animation Market Size and Forecast, 2012-2022
7.1.2.1. Revenue (US$ Mn) Comparison, By Hardware
7.1.2.2. Revenue (US$ Mn) Comparison, By Software
7.1.2.3. Revenue (US$ Mn) Comparison, By Deployment
7.1.2.4. Revenue (US$ Mn) Comparison, By Industry
7.1.3. Europe 3D Animation Market Size and Forecast, 2012-2022
7.1.3.1. Revenue (US$ Mn) Comparison, By Hardware
7.1.3.2. Revenue (US$ Mn) Comparison, By Software
7.1.3.3. Revenue (US$ Mn) Comparison, By Deployment
7.1.3.4. Revenue (US$ Mn) Comparison, By Industry
7.1.4. Japan 3D Animation Market Size and Forecast, 2012-2022
7.1.4.1. Revenue (US$ Mn) Comparison, By Hardware
7.1.4.2. Revenue (US$ Mn) Comparison, By Software
7.1.4.3. Revenue (US$ Mn) Comparison, By Deployment
7.1.4.4. Revenue (US$ Mn) Comparison, By Industry
7.1.5. APEJ 3D Animation Market Size and Forecast, 2012-2022
7.1.5.1. Revenue (US$ Mn) Comparison, By Hardware
7.1.5.2. Revenue (US$ Mn) Comparison, By Software
7.1.5.3. Revenue (US$ Mn) Comparison, By Deployment
7.1.5.4. Revenue (US$ Mn) Comparison, By Industry
7.1.6. MEA 3D Animation Market Size and Forecast, 2012-2022
7.1.6.1. Revenue (US$ Mn) Comparison, By Hardware
7.1.6.2. Revenue (US$ Mn) Comparison, By Software
7.1.6.3. Revenue (US$ Mn) Comparison, By Deployment
7.1.6.4. Revenue (US$ Mn) Comparison, By Industry
8. North America 3D Animation Market Analysis and Forecast, By Country, 2012-2022
8.1. US 3D Animation Market Size and Forecast, 2012-2022
8.1.1. Revenue (US$ Mn) Comparison, By Hardware
8.1.2. Revenue (US$ Mn) Comparison, By Software
8.1.3. Revenue (US$ Mn) Comparison, By Deployment
8.1.4. Revenue (US$ Mn) Comparison, By Industry
8.2. Canada 3D Animation Market Size and Forecast, 2012-2022
8.2.1. Revenue (US$ Mn) Comparison, By Hardware
8.2.2. Revenue (US$ Mn) Comparison, By Software
8.2.3. Revenue (US$ Mn) Comparison, By Deployment
8.2.4. Revenue (US$ Mn) Comparison, By Industry
9. Latin America 3D Animation Market Analysis and Forecast, By Country, 2012-2022
9.1. Brazil 3D Animation Market Size and Forecast, 2012-2022
9.1.1. Revenue (US$ Mn) Comparison, By Hardware
9.1.2. Revenue (US$ Mn) Comparison, By Software
9.1.3. Revenue (US$ Mn) Comparison, By Deployment
9.1.4. Revenue (US$ Mn) Comparison, By Industry
9.2. Mexico 3D Animation Market Size and Forecast, 2012-2022
9.2.1. Revenue (US$ Mn) Comparison, By Hardware
9.2.2. Revenue (US$ Mn) Comparison, By Software
9.2.3. Revenue (US$ Mn) Comparison, By Deployment
9.2.4. Revenue (US$ Mn) Comparison, By Industry
9.3. Argentina 3D Animation Market Size and Forecast, 2012-2022
9.3.1. Revenue (US$ Mn) Comparison, By Hardware
9.3.2. Revenue (US$ Mn) Comparison, By Software
9.3.3. Revenue (US$ Mn) Comparison, By Deployment
9.3.4. Revenue (US$ Mn) Comparison, By Industry
10. Europe 3D Animation Market Analysis and Forecast, By Country, 2012-2022
10.1. Germany 3D Animation Market Size and Forecast, 2012-2022
10.1.1. Revenue (US$ Mn) Comparison, By Hardware
10.1.2. Revenue (US$ Mn) Comparison, By Software
10.1.3. Revenue (US$ Mn) Comparison, By Deployment
10.1.4. Revenue (US$ Mn) Comparison, By Industry
10.2. UK 3D Animation Market Size and Forecast, 2012-2022
10.2.1. Revenue (US$ Mn) Comparison, By Hardware
10.2.2. Revenue (US$ Mn) Comparison, By Software
10.2.3. Revenue (US$ Mn) Comparison, By Deployment
10.2.4. Revenue (US$ Mn) Comparison, By Industry
10.3. France 3D Animation Market Size and Forecast, 2012-2022
10.3.1. Revenue (US$ Mn) Comparison, By Hardware
10.3.2. Revenue (US$ Mn) Comparison, By Software
10.3.3. Revenue (US$ Mn) Comparison, By Deployment
10.3.4. Revenue (US$ Mn) Comparison, By Industry
10.4. Spain 3D Animation Market Size and Forecast, 2012-2022
10.4.1. Revenue (US$ Mn) Comparison, By Hardware
10.4.2. Revenue (US$ Mn) Comparison, By Software
10.4.3. Revenue (US$ Mn) Comparison, By Deployment
10.4.4. Revenue (US$ Mn) Comparison, By Industry
10.5. Italy 3D Animation Market Size and Forecast, 2012-2022
10.5.1. Revenue (US$ Mn) Comparison, By Hardware
10.5.2. Revenue (US$ Mn) Comparison, By Software
10.5.3. Revenue (US$ Mn) Comparison, By Deployment
10.5.4. Revenue (US$ Mn) Comparison, By Industry
10.6. Nordic 3D Animation Market Size and Forecast, 2012-2022
10.6.1. Revenue (US$ Mn) Comparison, By Hardware
10.6.2. Revenue (US$ Mn) Comparison, By Software
10.6.3. Revenue (US$ Mn) Comparison, By Deployment
10.6.4. Revenue (US$ Mn) Comparison, By Industry
11. Japan 3D Animation Market Analysis and Forecast, By Country, 2012-2022
11.1. Japan 3D Animation Market Size and Forecast, 2012-2022
11.1.1. Revenue (US$ Mn) Comparison, By Hardware
11.1.2. Revenue (US$ Mn) Comparison, By Software
11.1.3. Revenue (US$ Mn) Comparison, By Deployment
11.1.4. Revenue (US$ Mn) Comparison, By Industry
12. APEJ 3D Animation Market Analysis and Forecast, By Country, 2012-2022
12.1. China 3D Animation Market Size and Forecast, 2012-2022
12.1.1. Revenue (US$ Mn) Comparison, By Hardware
12.1.2. Revenue (US$ Mn) Comparison, By Software
12.1.3. Revenue (US$ Mn) Comparison, By Deployment
12.1.4. Revenue (US$ Mn) Comparison, By Industry
12.2. India 3D Animation Market Size and Forecast, 2012-2022
12.2.1. Revenue (US$ Mn) Comparison, By Hardware
12.2.2. Revenue (US$ Mn) Comparison, By Software
12.2.3. Revenue (US$ Mn) Comparison, By Deployment
12.2.4. Revenue (US$ Mn) Comparison, By Industry
12.3. Malaysia 3D Animation Market Size and Forecast, 2012-2022
12.3.1. Revenue (US$ Mn) Comparison, By Hardware
12.3.2. Revenue (US$ Mn) Comparison, By Software
12.3.3. Revenue (US$ Mn) Comparison, By Deployment
12.3.4. Revenue (US$ Mn) Comparison, By Industry
12.4. Thailand 3D Animation Market Size and Forecast, 2012-2022
12.4.1. Revenue (US$ Mn) Comparison, By Hardware
12.4.2. Revenue (US$ Mn) Comparison, By Software
12.4.3. Revenue (US$ Mn) Comparison, By Deployment
12.4.4. Revenue (US$ Mn) Comparison, By Industry
12.5. Singapore 3D Animation Market Size and Forecast, 2012-2022
12.5.1. Revenue (US$ Mn) Comparison, By Hardware
12.5.2. Revenue (US$ Mn) Comparison, By Software
12.5.3. Revenue (US$ Mn) Comparison, By Deployment
12.5.4. Revenue (US$ Mn) Comparison, By Industry
12.6. Australia 3D Animation Market Size and Forecast, 2012-2022
12.6.1. Revenue (US$ Mn) Comparison, By Hardware
12.6.2. Revenue (US$ Mn) Comparison, By Software
12.6.3. Revenue (US$ Mn) Comparison, By Deployment
12.6.4. Revenue (US$ Mn) Comparison, By Industry
13. MEA 3D Animation Market Analysis and Forecast, By Country, 2012-2022
13.1. GCC Countries 3D Animation Market Size and Forecast, 2012-2022
13.1.1. Revenue (US$ Mn) Comparison, By Hardware
13.1.2. Revenue (US$ Mn) Comparison, By Software
13.1.3. Revenue (US$ Mn) Comparison, By Deployment
13.1.4. Revenue (US$ Mn) Comparison, By Industry
13.2. South Africa 3D Animation Market Size and Forecast, 2012-2022
13.2.1. Revenue (US$ Mn) Comparison, By Hardware
13.2.2. Revenue (US$ Mn) Comparison, By Software
13.2.3. Revenue (US$ Mn) Comparison, By Deployment
13.2.4. Revenue (US$ Mn) Comparison, By Industry
13.3. Nigeria 3D Animation Market Size and Forecast, 2012-2022
13.3.1. Revenue (US$ Mn) Comparison, By Hardware
13.3.2. Revenue (US$ Mn) Comparison, By Software
13.3.3. Revenue (US$ Mn) Comparison, By Deployment
13.3.4. Revenue (US$ Mn) Comparison, By Industry
13.4. Israel 3D Animation Market Size and Forecast, 2012-2022
13.4.1. Revenue (US$ Mn) Comparison, By Hardware
13.4.2. Revenue (US$ Mn) Comparison, By Software
13.4.3. Revenue (US$ Mn) Comparison, By Deployment
13.4.4. Revenue (US$ Mn) Comparison, By Industry
14. Global 3D Animation Market Company Share, Competition Landscape and Company Profiles
14.1. Company Share Analysis
14.2. Competition Landscape
14.3. Company Profiles
14.3.1. Autodesk Inc.
14.3.2.Adobe Systems, Inc.
14.3.3. Nemetschek SE
14.3.4.NewTek, Inc.
14.3.5.NVIDIA Corp.
14.3.6.Side Effects Software Inc.
14.3.7.Smith Micro Software, Inc.
14.3.8.Intel Corp.
14.3.9. BOXX Technologies, Inc.
14.3.10. Advanced Micro Devices, Inc.
15. Research Methodology
16. Secondary and Primary Sources
17. Assumptions and Acronyms
18. Disclaimer
List of Tables
TABLE 1 Global 3D Animation Market Value (US$ Mn), 2012-2016
TABLE 2 Global 3D Animation Market Value (US$ Mn), 2017-2022
TABLE 3 Global 3D Animation Market Value (US$ Mn) and Y-o-Y, 2015-2022
TABLE 4 Global Video Card & GPU Segment Value (US$ Mn), By Region 2012-2016
TABLE 5 Global Video Card & GPU Segment Value (US$ Mn), By Region 2017-2022
TABLE 6 Global Video Card & GPU Segment Market Share, By Region 2012-2016
TABLE 7 Global Video Card & GPU Segment Market Share, By Region 2017-2022
TABLE 8 Global Video Card & GPU Segment Y-o-Y, By Region 2015-2022
TABLE 9 Global Motion Capturing Systems Segment Value (US$ Mn), By Region 2012-2016
TABLE 10 Global Motion Capturing Systems Segment Value (US$ Mn), By Region 2017-2022
TABLE 11 Global Motion Capturing Systems Segment Market Share, By Region 2012-2016
TABLE 12 Global Motion Capturing Systems Segment Market Share, By Region 2017-2022
TABLE 13 Global Motion Capturing Systems Segment Y-o-Y, By Region 2015-2022
TABLE 14 Global Workstation Segment Value (US$ Mn), By Region 2012-2016
TABLE 15 Global Workstation Segment Value (US$ Mn), By Region 2017-2022
TABLE 16 Global Workstation Segment Market Share, By Region 2012-2016
TABLE 17 Global Workstation Segment Market Share, By Region 2017-2022
TABLE 18 Global Workstation Segment Y-o-Y, By Region 2015-2022
TABLE 19 Global Other Hardware Segment Value (US$ Mn), By Region 2012-2016
TABLE 20 Global Other Hardware Segment Value (US$ Mn), By Region 2017-2022
TABLE 21 Global Other Hardware Segment Market Share, By Region 2012-2016
TABLE 22 Global Other Hardware Segment Market Share, By Region 2017-2022
TABLE 23 Global Other Hardware Segment Y-o-Y, By Region 2015-2022
TABLE 24 Global Plug-in Software Segment Value (US$ Mn), By Region 2012-2016
TABLE 25 Global Plug-in Software Segment Value (US$ Mn), By Region 2017-2022
TABLE 26 Global Plug-in Software Segment Market Share, By Region 2012-2016
TABLE 27 Global Plug-in Software Segment Market Share, By Region 2017-2022
TABLE 28 Global Plug-in Software Segment Y-o-Y, By Region 2015-2022
TABLE 29 Global Software Platform Segment Value (US$ Mn), By Region 2012-2016
TABLE 30 Global Software Platform Segment Value (US$ Mn), By Region 2017-2022
TABLE 31 Global Software Platform Segment Market Share, By Region 2012-2016
TABLE 32 Global Software Platform Segment Market Share, By Region 2017-2022
TABLE 33 Global Software Platform Segment Y-o-Y, By Region 2015-2022
TABLE 34 Global SDK Segment Value (US$ Mn), By Region 2012-2016
TABLE 35 Global SDK Segment Value (US$ Mn), By Region 2017-2022
TABLE 36 Global SDK Segment Market Share, By Region 2012-2016
TABLE 37 Global SDK Segment Market Share, By Region 2017-2022
TABLE 38 Global SDK Segment Y-o-Y, By Region 2015-2022
TABLE 39 Global Others Segment Value (US$ Mn), By Region 2012-2016
TABLE 40 Global Others Segment Value (US$ Mn), By Region 2017-2022
TABLE 41 Global Others Segment Market Share, By Region 2012-2016
TABLE 42 Global Others Segment Market Share, By Region 2017-2022
TABLE 43 Global Others Segment Y-o-Y, By Region 2015-2022
TABLE 44 Global On-Premises Segment Value (US$ Mn), By Region 2012-2016
TABLE 45 Global On-Premises Segment Value (US$ Mn), By Region 2017-2022
TABLE 46 Global On-Premises Segment Market Share, By Region 2012-2016
TABLE 47 Global On-Premises Segment Market Share, By Region 2017-2022
TABLE 48 Global On-Premises Segment Y-o-Y, By Region 2015-2022
TABLE 49 Global Cloud Segment Value (US$ Mn), By Region 2012-2016
TABLE 50 Global Cloud Segment Value (US$ Mn), By Region 2017-2022
TABLE 51 Global Cloud Segment Market Share, By Region 2012-2016
TABLE 52 Global Cloud Segment Market Share, By Region 2017-2022
TABLE 53 Global Cloud Segment Y-o-Y, By Region 2015-2022
TABLE 54 Global Media & Entertainment Segment Value (US$ Mn), By Region 2012-2016
TABLE 55 Global Media & Entertainment Segment Value (US$ Mn), By Region 2017-2022
TABLE 56 Global Media & Entertainment Segment Market Share, By Region 2012-2016
TABLE 57 Global Media & Entertainment Segment Market Share, By Region 2017-2022
TABLE 58 Global Media & Entertainment Segment Y-o-Y, By Region 2015-2022
TABLE 59 Global Construction & Engineering Segment Value (US$ Mn), By Region 2012-2016
TABLE 60 Global Construction & Engineering Segment Value (US$ Mn), By Region 2017-2022
TABLE 61 Global Construction & Engineering Segment Market Share, By Region 2012-2016
TABLE 62 Global Construction & Engineering Segment Market Share, By Region 2017-2022
TABLE 63 Global Construction & Engineering Segment Y-o-Y, By Region 2015-2022
TABLE 64 Global Architecture Segment Value (US$ Mn), By Region 2012-2016
TABLE 65 Global Architecture Segment Value (US$ Mn), By Region 2017-2022
TABLE 66 Global Architecture Segment Market Share, By Region 2012-2016
TABLE 67 Global Architecture Segment Market Share, By Region 2017-2022
TABLE 68 Global Architecture Segment Y-o-Y, By Region 2015-2022
TABLE 69 Global Manufacturing Segment Value (US$ Mn), By Region 2012-2016
TABLE 70 Global Manufacturing Segment Value (US$ Mn), By Region 2017-2022
TABLE 71 Global Manufacturing Segment Market Share, By Region 2012-2016
TABLE 72 Global Manufacturing Segment Market Share, By Region 2017-2022
TABLE 73 Global Manufacturing Segment Y-o-Y, By Region 2015-2022
TABLE 74 Global Healthcare Segment Value (US$ Mn), By Region 2012-2016
TABLE 75 Global Healthcare Segment Value (US$ Mn), By Region 2017-2022
TABLE 76 Global Healthcare Segment Market Share, By Region 2012-2016
TABLE 77 Global Healthcare Segment Market Share, By Region 2017-2022
TABLE 78 Global Healthcare Segment Y-o-Y, By Region 2015-2022
TABLE 79 Global Education Segment Value (US$ Mn), By Region 2012-2016
TABLE 80 Global Education Segment Value (US$ Mn), By Region 2017-2022
TABLE 81 Global Education Segment Market Share, By Region 2012-2016
TABLE 82 Global Education Segment Market Share, By Region 2017-2022
TABLE 83 Global Education Segment Y-o-Y, By Region 2015-2022
TABLE 84 Global Other Industry Segment Value (US$ Mn), By Region 2012-2016
TABLE 85 Global Other Industry Segment Value (US$ Mn), By Region 2017-2022
TABLE 86 Global Other Industry Segment Market Share, By Region 2012-2016
TABLE 87 Global Other Industry Segment Market Share, By Region 2017-2022
TABLE 88 Global Other Industry Segment Y-o-Y, By Region 2015-2022
TABLE 89 North America 3D Animation Market Value (US$ Mn), By Hardware2012-2016
TABLE 90 North America 3D Animation Market Value (US$ Mn), By Hardware2017-2022
TABLE 91 North America 3D Animation Market Value (US$ Mn), By Software 2012-2016
TABLE 92 North America 3D Animation Market Value (US$ Mn), By Software 2017-2022
TABLE 93 North America 3D Animation Market Value (US$ Mn), By Deployment2012-2016
TABLE 94 North America 3D Animation Market Value (US$ Mn), By Deployment2017-2022
TABLE 95 North America 3D Animation Market Value (US$ Mn), By Industry2012-2016
TABLE 96 North America 3D Animation Market Value (US$ Mn), By Industry2017-2022
TABLE 97 Latin America 3D Animation Market Value (US$ Mn), By Hardware2012-2016
TABLE 98 Latin America 3D Animation Market Value (US$ Mn), By Hardware2017-2022
TABLE 99 Latin America 3D Animation Market Value (US$ Mn), By Software 2012-2016
TABLE 100 Latin America 3D Animation Market Value (US$ Mn), By Software 2017-2022
TABLE 101 Latin America 3D Animation Market Value (US$ Mn), By Deployment2012-2016
TABLE 102 Latin America 3D Animation Market Value (US$ Mn), By Deployment2017-2022
TABLE 103 Latin America 3D Animation Market Value (US$ Mn), By Industry2012-2016
TABLE 104 Latin America 3D Animation Market Value (US$ Mn), By Industry2017-2022
TABLE 105 Europe 3D Animation Market Value (US$ Mn), By Hardware2012-2016
TABLE 106 Europe 3D Animation Market Value (US$ Mn), By Hardware2017-2022
TABLE 107 Europe 3D Animation Market Value (US$ Mn), By Software 2012-2016
TABLE 108 Europe 3D Animation Market Value (US$ Mn), By Software 2017-2022
TABLE 109 Europe 3D Animation Market Value (US$ Mn), By Deployment2012-2016
TABLE 110 Europe 3D Animation Market Value (US$ Mn), By Deployment2017-2022
TABLE 111 Europe 3D Animation Market Value (US$ Mn), By Industry2012-2016
TABLE 112 Europe 3D Animation Market Value (US$ Mn), By Industry2017-2022
TABLE 113 Japan 3D Animation Market Value (US$ Mn), By Hardware2012-2016
TABLE 114 Japan 3D Animation Market Value (US$ Mn), By Hardware2017-2022
TABLE 115 Japan 3D Animation Market Value (US$ Mn), By Software 2012-2016
TABLE 116 Japan 3D Animation Market Value (US$ Mn), By Software 2017-2022
TABLE 117 Japan 3D Animation Market Value (US$ Mn), By Deployment2012-2016
TABLE 118 Japan 3D Animation Market Value (US$ Mn), By Deployment2017-2022
TABLE 119 Japan 3D Animation Market Value (US$ Mn), By Industry2012-2016
TABLE 120 Japan 3D Animation Market Value (US$ Mn), By Industry2017-2022
TABLE 121 APEJ 3D Animation Market Value (US$ Mn), By Hardware2012-2016
TABLE 122 APEJ 3D Animation Market Value (US$ Mn), By Hardware2017-2022
TABLE 123 APEJ 3D Animation Market Value (US$ Mn), By Software 2012-2016
TABLE 124 APEJ 3D Animation Market Value (US$ Mn), By Software 2017-2022
TABLE 125 APEJ 3D Animation Market Value (US$ Mn), By Deployment2012-2016
TABLE 126 APEJ 3D Animation Market Value (US$ Mn), By Deployment2017-2022
TABLE 127 APEJ 3D Animation Market Value (US$ Mn), By Industry2012-2016
TABLE 128 APEJ 3D Animation Market Value (US$ Mn), By Industry2017-2022
TABLE 129 MEA 3D Animation Market Value (US$ Mn), By Hardware2012-2016
TABLE 130 MEA 3D Animation Market Value (US$ Mn), By Hardware2017-2022
TABLE 131 MEA 3D Animation Market Value (US$ Mn), By Software 2012-2016
TABLE 132 MEA 3D Animation Market Value (US$ Mn), By Software 2017-2022
TABLE 133 MEA 3D Animation Market Value (US$ Mn), By Deployment2012-2016
TABLE 134 MEA 3D Animation Market Value (US$ Mn), By Deployment2017-2022
TABLE 135 MEA 3D Animation Market Value (US$ Mn), By Industry2012-2016
TABLE 136 MEA 3D Animation Market Value (US$ Mn), By Industry2017-2022
TABLE 137 US 3D Animation Market Value (US$ Mn), By Hardware2012-2016
TABLE 138 US 3D Animation Market Value (US$ Mn), By Hardware2017-2022
TABLE 139 US 3D Animation Market Value (US$ Mn), By Software 2012-2016
TABLE 140 US 3D Animation Market Value (US$ Mn), By Software 2017-2022
TABLE 141 US 3D Animation Market Value (US$ Mn), By Deployment2012-2016
TABLE 142 US 3D Animation Market Value (US$ Mn), By Deployment2017-2022
TABLE 143 US 3D Animation Market Value (US$ Mn), By Industry2012-2016
TABLE 144 US 3D Animation Market Value (US$ Mn), By Industry2017-2022
TABLE 145 Canada 3D Animation Market Value (US$ Mn), By Hardware2012-2016
TABLE 146 Canada 3D Animation Market Value (US$ Mn), By Hardware2017-2022
TABLE 147 Canada 3D Animation Market Value (US$ Mn), By Software 2012-2016
TABLE 148 Canada 3D Animation Market Value (US$ Mn), By Software 2017-2022
TABLE 149 Canada 3D Animation Market Value (US$ Mn), By Deployment2012-2016
TABLE 150 Canada 3D Animation Market Value (US$ Mn), By Deployment2017-2022
TABLE 151 Canada 3D Animation Market Value (US$ Mn), By Industry2012-2016
TABLE 152 Canada 3D Animation Market Value (US$ Mn), By Industry2017-2022
TABLE 153 Brazil 3D Animation Market Value (US$ Mn), By Hardware2012-2016
TABLE 154 Brazil 3D Animation Market Value (US$ Mn), By Hardware2017-2022
TABLE 155 Brazil 3D Animation Market Value (US$ Mn), By Software 2012-2016
TABLE 156 Brazil 3D Animation Market Value (US$ Mn), By Software 2017-2022
TABLE 157 Brazil 3D Animation Market Value (US$ Mn), By Deployment2012-2016
TABLE 158 Brazil 3D Animation Market Value (US$ Mn), By Deployment2017-2022
TABLE 159 Brazil 3D Animation Market Value (US$ Mn), By Industry2012-2016
TABLE 160 Brazil 3D Animation Market Value (US$ Mn), By Industry2017-2022
TABLE 161 Mexico 3D Animation Market Value (US$ Mn), By Hardware2012-2016
TABLE 162 Mexico 3D Animation Market Value (US$ Mn), By Hardware2017-2022
TABLE 163 Mexico 3D Animation Market Value (US$ Mn), By Software 2012-2016
TABLE 164 Mexico 3D Animation Market Value (US$ Mn), By Software 2017-2022
TABLE 165 Mexico 3D Animation Market Value (US$ Mn), By Deployment2012-2016
TABLE 166 Mexico 3D Animation Market Value (US$ Mn), By Deployment2017-2022
TABLE 167 Mexico 3D Animation Market Value (US$ Mn), By Industry2012-2016
TABLE 168 Mexico 3D Animation Market Value (US$ Mn), By Industry2017-2022
TABLE 169 Argentina 3D Animation Market Value (US$ Mn), By Hardware2012-2016
TABLE 170 Argentina 3D Animation Market Value (US$ Mn), By Hardware2017-2022
TABLE 171 Argentina 3D Animation Market Value (US$ Mn), By Software 2012-2016
TABLE 172 Argentina 3D Animation Market Value (US$ Mn), By Software 2017-2022
TABLE 173 Argentina 3D Animation Market Value (US$ Mn), By Deployment2012-2016
TABLE 174 Argentina 3D Animation Market Value (US$ Mn), By Deployment2017-2022
TABLE 175 Argentina 3D Animation Market Value (US$ Mn), By Industry2012-2016
TABLE 176 Argentina 3D Animation Market Value (US$ Mn), By Industry2017-2022
TABLE 177 Germany 3D Animation Market Value (US$ Mn), By Hardware2012-2016
TABLE 178 Germany 3D Animation Market Value (US$ Mn), By Hardware2017-2022
TABLE 179 Germany 3D Animation Market Value (US$ Mn), By Software 2012-2016
TABLE 180 Germany 3D Animation Market Value (US$ Mn), By Software 2017-2022
TABLE 181 Germany 3D Animation Market Value (US$ Mn), By Deployment2012-2016
TABLE 182 Germany 3D Animation Market Value (US$ Mn), By Deployment2017-2022
TABLE 183 Germany 3D Animation Market Value (US$ Mn), By Industry2012-2016
TABLE 184 Germany 3D Animation Market Value (US$ Mn), By Industry2017-2022
TABLE 185 UK 3D Animation Market Value (US$ Mn), By Hardware2012-2016
TABLE 186 UK 3D Animation Market Value (US$ Mn), By Hardware2017-2022
TABLE 187 UK 3D Animation Market Value (US$ Mn), By Software 2012-2016
TABLE 188 UK 3D Animation Market Value (US$ Mn), By Software 2017-2022
TABLE 189 UK 3D Animation Market Value (US$ Mn), By Deployment2012-2016
TABLE 190 UK 3D Animation Market Value (US$ Mn), By Deployment2017-2022
TABLE 191 UK 3D Animation Market Value (US$ Mn), By Industry2012-2016
TABLE 192 UK 3D Animation Market Value (US$ Mn), By Industry2017-2022
TABLE 193 France 3D Animation Market Value (US$ Mn), By Hardware2012-2016
TABLE 194 France 3D Animation Market Value (US$ Mn), By Hardware2017-2022
TABLE 195 France 3D Animation Market Value (US$ Mn), By Software 2012-2016
TABLE 196 France 3D Animation Market Value (US$ Mn), By Software 2017-2022
TABLE 197 France 3D Animation Market Value (US$ Mn), By Deployment2012-2016
TABLE 198 France 3D Animation Market Value (US$ Mn), By Deployment2017-2022
TABLE 199 France 3D Animation Market Value (US$ Mn), By Industry2012-2016
TABLE 200 France 3D Animation Market Value (US$ Mn), By Industry2017-2022
TABLE 201 Spain 3D Animation Market Value (US$ Mn), By Hardware2012-2016
TABLE 202 Spain 3D Animation Market Value (US$ Mn), By Hardware2017-2022
TABLE 203 Spain 3D Animation Market Value (US$ Mn), By Software 2012-2016
TABLE 204 Spain 3D Animation Market Value (US$ Mn), By Software 2017-2022
TABLE 205 Spain 3D Animation Market Value (US$ Mn), By Deployment2012-2016
TABLE 206 Spain 3D Animation Market Value (US$ Mn), By Deployment2017-2022
TABLE 207 Spain 3D Animation Market Value (US$ Mn), By Industry2012-2016
TABLE 208 Spain 3D Animation Market Value (US$ Mn), By Industry2017-2022
TABLE 209 Italy 3D Animation Market Value (US$ Mn), By Hardware2012-2016
TABLE 210 Italy 3D Animation Market Value (US$ Mn), By Hardware2017-2022
TABLE 211 Italy 3D Animation Market Value (US$ Mn), By Software 2012-2016
TABLE 212 Italy 3D Animation Market Value (US$ Mn), By Software 2017-2022
TABLE 213 Italy 3D Animation Market Value (US$ Mn), By Deployment2012-2016
TABLE 214 Italy 3D Animation Market Value (US$ Mn), By Deployment2017-2022
TABLE 215 Italy 3D Animation Market Value (US$ Mn), By Industry2012-2016
TABLE 216 Italy 3D Animation Market Value (US$ Mn), By Industry2017-2022
TABLE 217 Nordic 3D Animation Market Value (US$ Mn), By Hardware2012-2016
TABLE 218 Nordic 3D Animation Market Value (US$ Mn), By Hardware2017-2022
TABLE 219 Nordic 3D Animation Market Value (US$ Mn), By Software 2012-2016
TABLE 220 Nordic 3D Animation Market Value (US$ Mn), By Software 2017-2022
TABLE 221 Nordic 3D Animation Market Value (US$ Mn), By Deployment2012-2016
TABLE 222 Nordic 3D Animation Market Value (US$ Mn), By Deployment2017-2022
TABLE 223 Nordic 3D Animation Market Value (US$ Mn), By Industry2012-2016
TABLE 224 Nordic 3D Animation Market Value (US$ Mn), By Industry2017-2022
TABLE 225 Japan 3D Animation Market Value (US$ Mn), By Hardware2012-2016
TABLE 226 Japan 3D Animation Market Value (US$ Mn), By Hardware2017-2022
TABLE 227 Japan 3D Animation Market Value (US$ Mn), By Software 2012-2016
TABLE 228 Japan 3D Animation Market Value (US$ Mn), By Software 2017-2022
TABLE 229 Japan 3D Animation Market Value (US$ Mn), By Deployment2012-2016
TABLE 230 Japan 3D Animation Market Value (US$ Mn), By Deployment2017-2022
TABLE 231 Japan 3D Animation Market Value (US$ Mn), By Industry2012-2016
TABLE 232 Japan 3D Animation Market Value (US$ Mn), By Industry2017-2022
TABLE 233 China 3D Animation Market Value (US$ Mn), By Hardware2012-2016
TABLE 234 China 3D Animation Market Value (US$ Mn), By Hardware2017-2022
TABLE 235 China 3D Animation Market Value (US$ Mn), By Software 2012-2016
TABLE 236 China 3D Animation Market Value (US$ Mn), By Software 2017-2022
TABLE 237 China 3D Animation Market Value (US$ Mn), By Deployment2012-2016
TABLE 238 China 3D Animation Market Value (US$ Mn), By Deployment2017-2022
TABLE 239 China 3D Animation Market Value (US$ Mn), By Industry2012-2016
TABLE 240 China 3D Animation Market Value (US$ Mn), By Industry2017-2022
TABLE 241 India 3D Animation Market Value (US$ Mn), By Hardware2012-2016
TABLE 242 India 3D Animation Market Value (US$ Mn), By Hardware2017-2022
TABLE 243 India 3D Animation Market Value (US$ Mn), By Software 2012-2016
TABLE 244 India 3D Animation Market Value (US$ Mn), By Software 2017-2022
TABLE 245 India 3D Animation Market Value (US$ Mn), By Deployment2012-2016
TABLE 246 India 3D Animation Market Value (US$ Mn), By Deployment2017-2022
TABLE 247 India 3D Animation Market Value (US$ Mn), By Industry2012-2016
TABLE 248 India 3D Animation Market Value (US$ Mn), By Industry2017-2022
TABLE 249 Malaysia 3D Animation Market Value (US$ Mn), By Hardware2012-2016
TABLE 250 Malaysia 3D Animation Market Value (US$ Mn), By Hardware2017-2022
TABLE 251 Malaysia 3D Animation Market Value (US$ Mn), By Software 2012-2016
TABLE 252 Malaysia 3D Animation Market Value (US$ Mn), By Software 2017-2022
TABLE 253 Malaysia 3D Animation Market Value (US$ Mn), By Deployment2012-2016
TABLE 254 Malaysia 3D Animation Market Value (US$ Mn), By Deployment2017-2022
TABLE 255 Malaysia 3D Animation Market Value (US$ Mn), By Industry2012-2016
TABLE 256 Malaysia 3D Animation Market Value (US$ Mn), By Industry2017-2022
TABLE 257 Thailand 3D Animation Market Value (US$ Mn), By Hardware2012-2016
TABLE 258 Thailand 3D Animation Market Value (US$ Mn), By Hardware2017-2022
TABLE 259 Thailand 3D Animation Market Value (US$ Mn), By Software 2012-2016
TABLE 260 Thailand 3D Animation Market Value (US$ Mn), By Software 2017-2022
TABLE 261 Thailand 3D Animation Market Value (US$ Mn), By Deployment2012-2016
TABLE 262 Thailand 3D Animation Market Value (US$ Mn), By Deployment2017-2022
TABLE 263 Thailand 3D Animation Market Value (US$ Mn), By Industry2012-2016
TABLE 264 Thailand 3D Animation Market Value (US$ Mn), By Industry2017-2022
TABLE 265 Singapore 3D Animation Market Value (US$ Mn), By Hardware2012-2016
TABLE 266 Singapore 3D Animation Market Value (US$ Mn), By Hardware2017-2022
TABLE 267 Singapore 3D Animation Market Value (US$ Mn), By Software 2012-2016
TABLE 268 Singapore 3D Animation Market Value (US$ Mn), By Software 2017-2022
TABLE 269 Singapore 3D Animation Market Value (US$ Mn), By Deployment2012-2016
TABLE 270 Singapore 3D Animation Market Value (US$ Mn), By Deployment2017-2022
TABLE 271 Singapore 3D Animation Market Value (US$ Mn), By Industry2012-2016
TABLE 272 Singapore 3D Animation Market Value (US$ Mn), By Industry2017-2022
TABLE 273 Australia 3D Animation Market Value (US$ Mn), By Hardware2012-2016
TABLE 274 Australia 3D Animation Market Value (US$ Mn), By Hardware2017-2022
TABLE 275 Australia 3D Animation Market Value (US$ Mn), By Software 2012-2016
TABLE 276 Australia 3D Animation Market Value (US$ Mn), By Software 2017-2022
TABLE 277 Australia 3D Animation Market Value (US$ Mn), By Deployment2012-2016
TABLE 278 Australia 3D Animation Market Value (US$ Mn), By Deployment2017-2022
TABLE 279 Australia 3D Animation Market Value (US$ Mn), By Industry2012-2016
TABLE 280 Australia 3D Animation Market Value (US$ Mn), By Industry2017-2022
TABLE 281 GCC Countries 3D Animation Market Value (US$ Mn), By Hardware2012-2016
TABLE 282 GCC Countries 3D Animation Market Value (US$ Mn), By Hardware2017-2022
TABLE 283 GCC Countries 3D Animation Market Value (US$ Mn), By Software 2012-2016
TABLE 284 GCC Countries 3D Animation Market Value (US$ Mn), By Software 2017-2022
TABLE 285 GCC Countries 3D Animation Market Value (US$ Mn), By Deployment2012-2016
TABLE 286 GCC Countries 3D Animation Market Value (US$ Mn), By Deployment2017-2022
TABLE 287 GCC Countries 3D Animation Market Value (US$ Mn), By Industry2012-2016
TABLE 288 GCC Countries 3D Animation Market Value (US$ Mn), By Industry2017-2022
TABLE 289 South Africa 3D Animation Market Value (US$ Mn), By Hardware2012-2016
TABLE 290 South Africa 3D Animation Market Value (US$ Mn), By Hardware2017-2022
TABLE 291 South Africa 3D Animation Market Value (US$ Mn), By Software 2012-2016
TABLE 292 South Africa 3D Animation Market Value (US$ Mn), By Software 2017-2022
TABLE 293 South Africa 3D Animation Market Value (US$ Mn), By Deployment2012-2016
TABLE 294 South Africa 3D Animation Market Value (US$ Mn), By Deployment2017-2022
TABLE 295 South Africa 3D Animation Market Value (US$ Mn), By Industry2012-2016
TABLE 296 South Africa 3D Animation Market Value (US$ Mn), By Industry2017-2022
TABLE 297 Nigeria 3D Animation Market Value (US$ Mn), By Hardware2012-2016
TABLE 298 Nigeria 3D Animation Market Value (US$ Mn), By Hardware2017-2022
TABLE 299 Nigeria 3D Animation Market Value (US$ Mn), By Software 2012-2016
TABLE 300 Nigeria 3D Animation Market Value (US$ Mn), By Software 2017-2022
TABLE 301 Nigeria 3D Animation Market Value (US$ Mn), By Deployment2012-2016
TABLE 302 Nigeria 3D Animation Market Value (US$ Mn), By Deployment2017-2022
TABLE 303 Nigeria 3D Animation Market Value (US$ Mn), By Industry2012-2016
TABLE 304 Nigeria 3D Animation Market Value (US$ Mn), By Industry2017-2022
TABLE 305 Israel 3D Animation Market Value (US$ Mn), By Hardware2012-2016
TABLE 306 Israel 3D Animation Market Value (US$ Mn), By Hardware2017-2022
TABLE 307 Israel 3D Animation Market Value (US$ Mn), By Software 2012-2016
TABLE 308 Israel 3D Animation Market Value (US$ Mn), By Software 2017-2022
TABLE 309 Israel 3D Animation Market Value (US$ Mn), By Deployment2012-2016
TABLE 310 Israel 3D Animation Market Value (US$ Mn), By Deployment2017-2022
TABLE 311 Israel 3D Animation Market Value (US$ Mn), By Industry2012-2016
TABLE 312 Israel 3D Animation Market Value (US$ Mn), By Industry2017-2022
List of Figures
FIG. 1 Global 3D Animation Market Value (US$ Mn), 2012-2016
FIG. 2 Global 3D Animation Market Value (US$ Mn) Forecast, 2017-2022
FIG. 3 Global 3D Animation Market Value (US$ Mn) and Y-o-Y, 2015-2022
FIG. 4 Global Video Card & GPU Segment Market Value (US$ Mn) By Region, 2012-2016
FIG. 5 Global Video Card & GPU Segment Market Value (US$ Mn) By Region, 2017-2022
FIG. 6 Global Video Card & GPU Segment Y-o-Y Growth Rate, By Region, 2015-2022
FIG. 7 Global Motion Capturing Systems Segment Market Value (US$ Mn) By Region, 2012-2016
FIG. 8 Global Motion Capturing Systems Segment Market Value (US$ Mn) By Region, 2017-2022
FIG. 9 Global Motion Capturing Systems Segment Y-o-Y Growth Rate, By Region, 2015-2022
FIG. 10 Global Workstation Segment Market Value (US$ Mn) By Region, 2012-2016
FIG. 11 Global Workstation Segment Market Value (US$ Mn) By Region, 2017-2022
FIG. 12 Global Workstation Segment Y-o-Y Growth Rate, By Region, 2015-2022
FIG. 13 Global Other Hardware Segment Market Value (US$ Mn) By Region, 2012-2016
FIG. 14 Global Other Hardware Segment Market Value (US$ Mn) By Region, 2017-2022
FIG. 15 Global Other Hardware Segment Y-o-Y Growth Rate, By Region, 2015-2022
FIG. 16 Global Plug-in Software Segment Market Value (US$ Mn) By Region, 2012-2016
FIG. 17 Global Plug-in Software Segment Market Value (US$ Mn) By Region, 2017-2022
FIG. 18 Global Plug-in Software Segment Y-o-Y Growth Rate, By Region, 2015-2022
FIG. 19 Global Software Platform Segment Market Value (US$ Mn) By Region, 2012-2016
FIG. 20 Global Software Platform Segment Market Value (US$ Mn) By Region, 2017-2022
FIG. 21 Global Software Platform Segment Y-o-Y Growth Rate, By Region, 2015-2022
FIG. 22 Global SDK Segment Market Value (US$ Mn) By Region, 2012-2016
FIG. 23 Global SDK Segment Market Value (US$ Mn) By Region, 2017-2022
FIG. 24 Global SDK Segment Y-o-Y Growth Rate, By Region, 2015-2022
FIG. 25 Global Others Segment Market Value (US$ Mn) By Region, 2012-2016
FIG. 26 Global Others Segment Market Value (US$ Mn) By Region, 2017-2022
FIG. 27 Global Others Segment Y-o-Y Growth Rate, By Region, 2015-2022
FIG. 28 Global On-Premises Segment Market Value (US$ Mn) By Region, 2012-2016
FIG. 29 Global On-Premises Segment Market Value (US$ Mn) By Region, 2017-2022
FIG. 30 Global On-Premises Segment Y-o-Y Growth Rate, By Region, 2015-2022
FIG. 31 Global Cloud Segment Market Value (US$ Mn) By Region, 2012-2016
FIG. 32 Global Cloud Segment Market Value (US$ Mn) By Region, 2017-2022
FIG. 33 Global Cloud Segment Y-o-Y Growth Rate, By Region, 2015-2022
FIG. 34 Global Media & Entertainment Segment Market Value (US$ Mn) By Region, 2012-2016
FIG. 35 Global Media & Entertainment Segment Market Value (US$ Mn) By Region, 2017-2022
FIG. 36 Global Media & Entertainment Segment Y-o-Y Growth Rate, By Region, 2015-2022
FIG. 37 Global Construction & Engineering Segment Market Value (US$ Mn) By Region, 2012-2016
FIG. 38 Global Construction & Engineering Segment Market Value (US$ Mn) By Region, 2017-2022
FIG. 39 Global Construction & Engineering Segment Y-o-Y Growth Rate, By Region, 2015-2022
FIG. 40 Global Architecture Segment Market Value (US$ Mn) By Region, 2012-2016
FIG. 41 Global Architecture Segment Market Value (US$ Mn) By Region, 2017-2022
FIG. 42 Global Architecture Segment Y-o-Y Growth Rate, By Region, 2015-2022
FIG. 43 Global Manufacturing Segment Market Value (US$ Mn) By Region, 2012-2016
FIG. 44 Global Manufacturing Segment Market Value (US$ Mn) By Region, 2017-2022
FIG. 45 Global Manufacturing Segment Y-o-Y Growth Rate, By Region, 2015-2022
FIG. 46 Global Healthcare Segment Market Value (US$ Mn) By Region, 2012-2016
FIG. 47 Global Healthcare Segment Market Value (US$ Mn) By Region, 2017-2022
FIG. 48 Global Healthcare Segment Y-o-Y Growth Rate, By Region, 2015-2022
FIG. 49 Global Education Segment Market Value (US$ Mn) By Region, 2012-2016
FIG. 50 Global Education Segment Market Value (US$ Mn) By Region, 2017-2022
FIG. 51 Global Education Segment Y-o-Y Growth Rate, By Region, 2015-2022
FIG. 52 Global Other Industry Segment Market Value (US$ Mn) By Region, 2012-2016
FIG. 53 Global Other Industry Segment Market Value (US$ Mn) By Region, 2017-2022
FIG. 54 Global Other Industry Segment Y-o-Y Growth Rate, By Region, 2015-2022
FIG. 55 North America 3D Animation Market Value (US$ Mn), By Hardware2012-2016
FIG. 56 North America 3D Animation Market Value (US$ Mn), By Hardware2017-2022
FIG. 57 North America 3D Animation Market Value (US$ Mn), By Software 2012-2016
FIG. 58 North America 3D Animation Market Value (US$ Mn), By Software 2017-2022
FIG. 59 North America 3D Animation Market Value (US$ Mn), By Deployment2012-2016
FIG. 60 North America 3D Animation Market Value (US$ Mn), By Deployment2017-2022
FIG. 61 North America 3D Animation Market Value (US$ Mn), By Industry2012-2016
FIG. 62 North America 3D Animation Market Value (US$ Mn), By Industry2017-2022
FIG. 63 Latin America 3D Animation Market Value (US$ Mn), By Hardware2012-2016
FIG. 64 Latin America 3D Animation Market Value (US$ Mn), By Hardware2017-2022
FIG. 65 Latin America 3D Animation Market Value (US$ Mn), By Software 2012-2016
FIG. 66 Latin America 3D Animation Market Value (US$ Mn), By Software 2017-2022
FIG. 67 Latin America 3D Animation Market Value (US$ Mn), By Deployment2012-2016
FIG. 68 Latin America 3D Animation Market Value (US$ Mn), By Deployment2017-2022
FIG. 69 Latin America 3D Animation Market Value (US$ Mn), By Industry2012-2016
FIG. 70 Latin America 3D Animation Market Value (US$ Mn), By Industry2017-2022
FIG. 71 Europe 3D Animation Market Value (US$ Mn), By Hardware2012-2016
FIG. 72 Europe 3D Animation Market Value (US$ Mn), By Hardware2017-2022
FIG. 73 Europe 3D Animation Market Value (US$ Mn), By Software 2012-2016
FIG. 74 Europe 3D Animation Market Value (US$ Mn), By Software 2017-2022
FIG. 75 Europe 3D Animation Market Value (US$ Mn), By Deployment2012-2016
FIG. 76 Europe 3D Animation Market Value (US$ Mn), By Deployment2017-2022
FIG. 77 Europe 3D Animation Market Value (US$ Mn), By Industry2012-2016
FIG. 78 Europe 3D Animation Market Value (US$ Mn), By Industry2017-2022
FIG. 79 Japan 3D Animation Market Value (US$ Mn), By Hardware2012-2016
FIG. 80 Japan 3D Animation Market Value (US$ Mn), By Hardware2017-2022
FIG. 81 Japan 3D Animation Market Value (US$ Mn), By Software 2012-2016
FIG. 82 Japan 3D Animation Market Value (US$ Mn), By Software 2017-2022
FIG. 83 Japan 3D Animation Market Value (US$ Mn), By Deployment2012-2016
FIG. 84 Japan 3D Animation Market Value (US$ Mn), By Deployment2017-2022
FIG. 85 Japan 3D Animation Market Value (US$ Mn), By Industry2012-2016
FIG. 86 Japan 3D Animation Market Value (US$ Mn), By Industry2017-2022
FIG. 87 APEJ 3D Animation Market Value (US$ Mn), By Hardware2012-2016
FIG. 88 APEJ 3D Animation Market Value (US$ Mn), By Hardware2017-2022
FIG. 89 APEJ 3D Animation Market Value (US$ Mn), By Software 2012-2016
FIG. 90 APEJ 3D Animation Market Value (US$ Mn), By Software 2017-2022
FIG. 91 APEJ 3D Animation Market Value (US$ Mn), By Deployment2012-2016
FIG. 92 APEJ 3D Animation Market Value (US$ Mn), By Deployment2017-2022
FIG. 93 APEJ 3D Animation Market Value (US$ Mn), By Industry2012-2016
FIG. 94 APEJ 3D Animation Market Value (US$ Mn), By Industry2017-2022
FIG. 95 MEA 3D Animation Market Value (US$ Mn), By Hardware2012-2016
FIG. 96 MEA 3D Animation Market Value (US$ Mn), By Hardware2017-2022
FIG. 97 MEA 3D Animation Market Value (US$ Mn), By Software 2012-2016
FIG. 98 MEA 3D Animation Market Value (US$ Mn), By Software 2017-2022
FIG. 99 MEA 3D Animation Market Value (US$ Mn), By Deployment2012-2016
FIG. 100 MEA 3D Animation Market Value (US$ Mn), By Deployment2017-2022
FIG. 101 MEA 3D Animation Market Value (US$ Mn), By Industry2012-2016
FIG. 102 MEA 3D Animation Market Value (US$ Mn), By Industry2017-2022
Copyright © Transparency Market Research, Inc. All Rights reserved
Trust Online


3D Animation Market