
Analysts’ Viewpoint on Xanthan Gum Market Scenario
Rise in adoption of xanthan gum as an egg substitute in the food & beverage industry is driving the global xanthan gum market. Xanthan gum is widely used as a binding agent and thickener, given its resilience to thermal deterioration and good compatibility with salts. It is a natural, safe, and efficient alternative to gluten. Xanthan gum is vegan and gluten free. Thus, demand for xanthan gum is rising at a rapid pace across the globe. Widespread application of xanthan gum can be ascribed to its unique physicochemical characteristics. Production of gum from synthetic media is costly; therefore, several manufacturers are attempting to produce it from agro and food industry wastes.
Xanthan gum ingredients primarily include bacteria along with D-glucose and D-mannose as the dominant hexose units. Xanthan gum is a high molecular weight polysaccharide produced by pure-culture fermentation of a carbohydrate with a bacterium called Xanthomonas campestris. Polysaccharide secreted by the bacterium is harvested by precipitation with alcohol. It is usually manufactured as a sodium, potassium, or calcium salt that is readily soluble in water. Xanthan gum is a hydrocolloid, i.e. a substance that disperses in water, providing a thickening or gelling effect by increasing the viscosity of the solution. It is used as a food additive in processed and baked foods, beverages, dairy products, dressings, dietetic foods and beverages, dry mixes, frozen foods, gravies, meat products, pet foods, sauces, fruit preparations, soups, syrups, and toppings. The application of xanthan gum in baking can be ascribed to its ability to bind things together, thus creating baked goods with a better structure. The usage of xanthan gum in ice cream produces a smoother texture by preventing the formation of large ice crystals. Xanthan gum emulsifier binds moisture and is used as a natural thickener for emulsions and cleansing systems.
Request a sample to get extensive insights into the Xanthan Gum Market
Xanthan gum is employed as a thickening, suspending, and emulsion stabilizing agent in various pharmaceutical applications such as solid and liquid dosage formulations. Xanthan gum thickener is used in many foods and other commercial products. It acts as a foam enhancer in semi-solid and liquid formulations. Furthermore, it readily dissolves in hot and cold water. The usage of xanthan gum for skin and personal care products can be ascribed to its exceptional flow properties and easy pumpability. The usage of xanthan gum in skincare products is widespread, as it stabilizes emulsions and provides creamy consistency to creams and lotions. Xanthan gum is also employed in personal care products such as toothpastes, creams, lotions, and shampoos.
Xanthan gum is used as a thickener, suspending agent, emulsifier, and molding agent in the food industry. It is generally added in low dosages due to its high molecular weight and technological functionality. Rapid growth in the ready-to-eat industry and increase in consumer awareness about healthy foods are driving the demand for food hydrocolloids, thereby propelling the xanthan gum market.
Rise in adoption of xanthan gum as a low-priced alternative to guar gum is also fueling the market. Xanthan gum is used in salad dressings, sauces, beverages, dairy products, syrups, toppings, baked goods, confectioneries, candies, breading, batter, and low-fat spreads. High disposable income, rapid urbanization, and large and growing group of consumers comprising young professionals and families that prefer healthy and vegan food products are factors influencing the global xanthan gum market. Excellent solubility and stability under acidic or alkaline conditions, stability in the presence of salts, and enzyme resistance of xanthan gum make it one of the key polymers used in the food industry.
Request a custom report on Xanthan Gum Market
Xanthan gum is one of the most efficient, high-quality, and eco-friendly oil drilling fluids used in the oil & gas industry. It is resistant to high temperatures (≥94°C), acids, alkalis, and salts. It can significantly improve the permeability of mud. Xanthan gum has the ability to suspend solid materials; reduce pressure loss during drilling; stabilize the well wall; reduce damage caused to the reservoir; and significantly improve the efficiency of drilling, workover, and completion. In the petroleum industry, xanthan gum is preferred in oilfield development over polyacrylamide, CMC, modified starch, and some polysaccharides such as guar gum, due to its rheological properties, salt tolerance, and thickening effect.
The number of oil reserves in the U.S. is rising at a rapid pace due to the increase in usage of unconventional drilling methods. Libya has the largest oil reserves in Africa. It has the potential to be a major reserve of fossil fuel, as it remains mostly unexplored as a result of past sanctions on foreign oil companies. According to the annual statistics of OPEC, 1,214.21 billion barrels of proven crude oil reserves are currently available on a global scale. Of these, more than 81.89% reserves are under the control of OPEC, with the bulk of OPEC oil reserves in the Middle East amounting to 65.36% of the OPEC total. Thus, significant growth in the oil & gas industry is expected to boost the demand for xanthan gum in the near future.
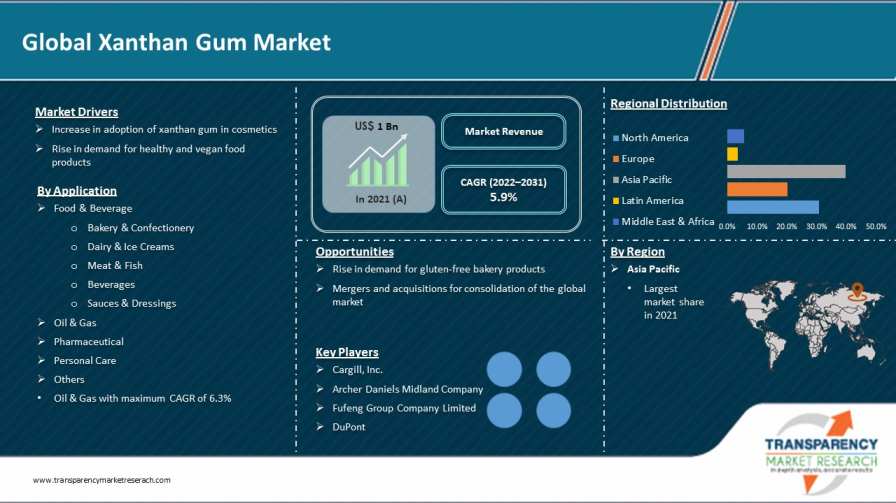
In terms of volume, Asia Pacific held the leading share of the global xanthan gum market in 2021. Despite lower growth rate, the sheer size of the population and rise in disposable income across Asia Pacific are key factors boosting the food & beverage industry in the region. Asia Pacific held 39% value share of the market in 2021.
North America and Europe held value share of around 30% and 20%, respectively, in 2021. Expansion of the market in Europe can be ascribed to significant growth in the pharmaceutical industry in the region. Middle East & Africa is expected to offer lucrative opportunities to the market in the near future due to the rapid expansion of cities and increase in employment rate in the region. Cold chain services are also changing consumer choices in Middle East & Africa, as frozen, processed halal meat and poultry, cold drinks, and flavored milk are gaining popularity in the region.
The global xanthan gum market is consolidated, with a small number of large-scale vendors controlling the majority of the share. Expansion of product portfolios and mergers and acquisitions are prominent strategies adopted by key players. Cargill, Inc., Archer Daniels Midland Company, Fufeng Group Company Limited, DuPont, Solvay S.A., MeiHua Holdings Group Co., Ltd., Jungbunzlauer Suisse AG, CP Kelco, Hebei Xinhe Biochemical Co., Ltd., Deosen, Zoranoc Oilfield Chemical, Jianlong Biotechnology Co., Ltd., and FMC BioPolymer are prominent entities operating in the global xanthan gum market.
Each of these players has been profiled in the xanthan gum market report based on parameters such as company overview, financial overview, business strategies, product portfolio, business segments, and recent developments.
|
Attribute |
Detail |
|
Market Size Value in 2021 |
US$ 1 Bn |
|
Market Forecast Value in 2031 |
US$ 1.9 Bn |
|
Growth Rate (CAGR) |
5.9% |
|
Forecast Period |
2022–2031 |
|
Historical Data Available for |
2020 |
|
Quantitative Units |
US$ Bn for Value & Tons for Volume |
|
Market Analysis |
It includes cross segment analysis at global as well as regional level. Furthermore, qualitative analysis includes drivers, restraints, opportunities, key trends, Porter’s Five Forces analysis, value chain analysis, and key trend analysis. |
|
Competition Landscape |
|
|
Format |
Electronic (PDF) + Excel |
|
Market Segmentation |
|
|
Regions Covered |
|
|
Countries Covered |
|
|
Companies Profiled |
|
|
Customization Scope |
Available upon request |
|
Pricing |
Available upon request |
The global xanthan gum market stood at US$ 1 Bn in 2021.
The global xanthan gum market is expected to grow at a CAGR of 5.9% from 2022 to 2031.
Increase in adoption of xanthan gum in cosmetics and rise in demand for healthy and vegan food products are key factors driving the global xanthan gum market.
Food & beverage was the largest application segment that held 45% value share of the market in 2021.
Asia Pacific was the most lucrative region with value share of 39% of the xanthan gum market in 2021.
Cargill, Inc., Archer Daniels Midland Company, Fufeng Group Company Limited, DuPont, Solvay S.A., MeiHua Holdings Group Co., Ltd., Jungbunzlauer Suisse AG, CP Kelco, Hebei Xinhe Biochemical Co., Ltd., Deosen, Zoranoc Oilfield Chemical, Jianlong Biotechnology Co., Ltd., and FMC BioPolymer.
1. Executive Summary
1.1. Xanthan Gum Market Snapshot
1.2. Current Market and Future Potential
2. Market Overview
2.1. Market Segmentation
2.2. Market Trends
2.3. Market Dynamics
2.3.1. Drivers
2.3.2. Restraints
2.3.3. Opportunities
2.4. Porter’s Five Forces Analysis
2.5. Regulatory Analysis
2.6. Value Chain Analysis
2.6.1. List of Raw Materials Providers
2.6.2. List of Xanthan Gum Manufacturers
2.6.3. List of Dealers/Distributors
2.6.4. List of Potential Customer
3. COVID-19 Impact Analysis
4. Xanthan Gum Market Analysis and Forecast, by Application, 2022–2031
4.1. Introduction and Definitions
4.2. Global Xanthan Gum Market Volume (Tons) and Value (US$ Bn) Forecast, by Application, 2022–2031
4.2.1. Food & Beverage
4.2.1.1. Bakery & Confectionery
4.2.1.2. Dairy & Ice Creams
4.2.1.3. Meat & Fish
4.2.1.4. Beverages
4.2.1.5. Sauces & Dressings
4.2.2. Oil & Gas
4.2.3. Pharmaceutical
4.2.4. Personal Care
4.2.5. Others
4.3. Global Xanthan Gum Market Attractiveness, by Application
5. Global Xanthan Gum Market Analysis and Forecast, by Region, 2022–2031
5.1. Key Findings
5.2. Global Xanthan Gum Market Volume (Tons) and Value (US$ Bn) Forecast, by Region, 2022–2031
5.2.1. North America
5.2.2. Europe
5.2.3. Asia Pacific
5.2.4. Latin America
5.2.5. Middle East & Africa
5.3. Global Xanthan Gum Market Attractiveness, by Region
6. North America Xanthan Gum Market Analysis and Forecast, 2022–2031
6.1. Key Findings
6.2. North America Xanthan Gum Market Volume (Tons) and Value (US$ Bn) Forecast, by Application, 2022–2031
6.3. North America Xanthan Gum Market Volume (Tons) and Value (US$ Bn) Forecast, by Country, 2022–2031
6.3.1. U.S. Xanthan Gum Market Volume (Tons) and Value (US$ Bn) Forecast, by Application, 2022–2031
6.3.2. Canada Xanthan Gum Market Volume (Tons) and Value (US$ Bn) Forecast, by Application, 2022–2031
6.4. North America Xanthan Gum Market Attractiveness Analysis
7. Europe Xanthan Gum Market Analysis and Forecast, 2022–2031
7.1. Key Findings
7.2. Europe Xanthan Gum Market Volume (Tons) and Value (US$ Bn) Forecast, by Application, 2022–2031
7.3. Europe Xanthan Gum Market Volume (Tons) and Value (US$ Bn) Forecast, by Country and Sub-region, 2021-2031
7.3.1. Germany Xanthan Gum Market Volume (Tons) and Value (US$ Bn) Forecast, by Application, 2022–2031
7.3.2. France Xanthan Gum Market Volume (Tons) and Value (US$ Bn) Forecast, by Application, 2022–2031
7.3.3. U.K. Xanthan Gum Market Volume (Tons) and Value (US$ Bn) Forecast, by Application, 2022–2031
7.3.4. Italy Xanthan Gum Market Volume (Tons) and Value (US$ Bn) Forecast, by Application, 2022–2031
7.3.5. Russia & CIS Xanthan Gum Market Volume (Tons) and Value (US$ Bn) Forecast, by Application, 2022–2031
7.3.6. Rest of Europe Xanthan Gum Market Volume (Tons) and Value (US$ Bn) Forecast, by Application, 2022–2031
7.4. Europe Xanthan Gum Market Attractiveness Analysis
8. Asia Pacific Xanthan Gum Market Analysis and Forecast, 2022–2031
8.1. Key Findings
8.2. Asia Pacific Xanthan Gum Market Volume (Tons) and Value (US$ Bn) Forecast, by Application
8.3. Asia Pacific Xanthan Gum Market Volume (Tons) and Value (US$ Bn) Forecast, by Country and Sub-region, 2021-2031
8.3.1. China Xanthan Gum Market Volume (Tons) and Value (US$ Bn) Forecast, by Application, 2022–2031
8.3.2. Japan Xanthan Gum Market Volume (Tons) and Value (US$ Bn) Forecast, by Application, 2022–2031
8.3.3. India Xanthan Gum Market Volume (Tons) and Value (US$ Bn) Forecast, by Application, 2022–2031
8.3.4. ASEAN Xanthan Gum Market Volume (Tons) and Value (US$ Bn) Forecast, by Application, 2022–2031
8.3.5. Rest of Asia Pacific Xanthan Gum Market Volume (Tons) and Value (US$ Bn) Forecast, by Application, 2022–2031
8.4. Asia Pacific Xanthan Gum Market Attractiveness Analysis
9. Latin America Xanthan Gum Market Analysis and Forecast, 2022–2031
9.1. Key Findings
9.2. Latin America Xanthan Gum Market Volume (Tons) and Value (US$ Bn) Forecast, by Application, 2022–2031
9.3. Latin America Xanthan Gum Market Volume (Tons) and Value (US$ Bn) Forecast, by Country and Sub-region, 2021-2031
9.3.1. Brazil Xanthan Gum Market Volume (Tons) and Value (US$ Bn) Forecast, by Application, 2022–2031
9.3.2. Mexico Xanthan Gum Market Volume (Tons) and Value (US$ Bn) Forecast, by Application, 2022–2031
9.3.3. Rest of Latin America Xanthan Gum Market Volume (Tons) and Value (US$ Bn) Forecast, by Application, 2022–2031
9.4. Latin America Xanthan Gum Market Attractiveness Analysis
10. Middle East & Africa Xanthan Gum Market Analysis and Forecast, 2022–2031
10.1. Key Findings
10.2. Middle East & Africa Xanthan Gum Market Volume (Tons) and Value (US$ Bn) Forecast, by Application, 2022–2031
10.3. Middle East & Africa Xanthan Gum Market Volume (Tons) and Value (US$ Bn) Forecast, by Country and Sub-region, 2021-2031
10.3.1. GCC Xanthan Gum Market Volume (Tons) and Value (US$ Bn) Forecast, by Application, 2022–2031
10.3.2. South Africa Xanthan Gum Market Volume (Tons) and Value (US$ Bn) Forecast, by Application, 2022–2031
10.3.3. Rest of Middle East & Africa Xanthan Gum Market Volume (Tons) and Value (US$ Bn) Forecast, by Application, 2022–2031
10.4. Middle East & Africa Xanthan Gum Market Attractiveness Analysis
11. Competition Landscape
11.1. Global Xanthan Gum Company Market Share Analysis, 2021
11.2. Company Profiles (Details – Overview, Financials, Recent Developments, and Strategy)
11.2.1. Cargill, Inc.
11.2.1.1. Company Description
11.2.1.2. Business Overview
11.2.1.3. Financial Overview
11.2.1.4. Strategic Overview
11.2.2. Archer Daniels Midland Company
11.2.2.1. Company Description
11.2.2.2. Business Overview
11.2.2.3. Financial Overview
11.2.2.4. Strategic Overview
11.2.3. Fufeng Group Company Limited
11.2.3.1. Company Description
11.2.3.2. Business Overview
11.2.3.3. Financial Overview
11.2.3.4. Strategic Overview
11.2.4. DuPont
11.2.4.1. Company Description
11.2.4.2. Business Overview
11.2.4.3. Financial Overview
11.2.4.4. Strategic Overview
11.2.5. Solvay S.A.
11.2.5.1. Company Description
11.2.5.2. Business Overview
11.2.5.3. Financial Overview
11.2.5.4. Strategic Overview
11.2.6. MeiHua Holdings Group Co., Ltd
11.2.6.1. Company Description
11.2.6.2. Business Overview
11.2.6.3. Financial Overview
11.2.6.4. Strategic Overview
11.2.7. JUNGBUNZLAUER SUISSE AG
11.2.7.1. Company Description
11.2.7.2. Business Overview
11.2.7.3. Financial Overview
11.2.7.4. Strategic Overview
11.2.8. CP Kelco
11.2.8.1. Company Description
11.2.8.2. Business Overview
11.2.8.3. Financial Overview
11.2.8.4. Strategic Overview
11.2.9. Hebei Xinhe Biochemical Co., Ltd.
11.2.9.1. Company Description
11.2.9.2. Business Overview
11.2.9.3. Financial Overview
11.2.9.4. Strategic Overview
11.2.10. Deosen
11.2.10.1. Company Description
11.2.10.2. Business Overview
11.2.10.3. Financial Overview
11.2.10.4. Strategic Overview
11.2.11. Zoranoc Oilfield Chemical
11.2.11.1. Company Description
11.2.11.2. Business Overview
11.2.11.3. Financial Overview
11.2.11.4. Strategic Overview
11.2.12. Jianlong Biotechnology Co., Ltd
11.2.12.1. Company Description
11.2.12.2. Business Overview
11.2.12.3. Financial Overview
11.2.12.4. Strategic Overview
11.2.13. FMC BioPolymer
11.2.13.1. Company Description
11.2.13.2. Business Overview
11.2.13.3. Financial Overview
11.2.13.4. Strategic Overview
12. Primary Research: Key Insights
13. Appendix
List of Tables
Table 1: Global Xanthan Gum Market Volume (Tons) Forecast, by Application, 2022–2031
Table 2: Global Xanthan Gum Market Value (US$ Bn) Forecast, by Application, 2022–2031
Table 3: Global Xanthan Gum Market Volume (Tons) Forecast, by Region, 2022–2031
Table 4: Global Xanthan Gum Market Value (US$ Bn) Forecast, by Region, 2022–2031
Table 5: North America Xanthan Gum Market Volume (Tons) Forecast, by Application, 2022–2031
Table 6: North America Xanthan Gum Market Value (US$ Bn) Forecast, by Application, 2022–2031
Table 7: North America Xanthan Gum Market Volume (Tons) Forecast, by Country, 2022–2031
Table 8: North America Xanthan Gum Market Value (US$ Bn) Forecast, by Country, 2022–2031
Table 9: U.S. Xanthan Gum Market Volume (Tons) Forecast, by Application, 2022–2031
Table 10: U.S. Xanthan Gum Market Value (US$ Bn) Forecast, by Application, 2022–2031
Table 11: Canada Xanthan Gum Market Volume (Tons) Forecast, by Application, 2022–2031
Table 12: Canada Xanthan Gum Market Value (US$ Bn) Forecast, by Application, 2022–2031
Table 13: Europe Xanthan Gum Market Volume (Tons) Forecast, by Application, 2022–2031
Table 14: Europe Xanthan Gum Market Value (US$ Bn) Forecast, by Application, 2022–2031
Table 15: Europe Xanthan Gum Market Volume (Tons) Forecast, by Country and Sub-region, 2022–2031
Table 16: Europe Xanthan Gum Market Value (US$ Bn) Forecast, by Country and Sub-region, 2022–2031
Table 17: Germany Xanthan Gum Market Volume (Tons) Forecast, by Application, 2022–2031
Table 18: Germany Xanthan Gum Market Value (US$ Bn) Forecast, by Application, 2022–2031
Table 19: France Xanthan Gum Market Volume (Tons) Forecast, by Application, 2022–2031
Table 20: France Xanthan Gum Market Value (US$ Bn) Forecast, by Application, 2022–2031
Table 21: U.K. Xanthan Gum Market Volume (Tons) Forecast, by Application, 2022–2031
Table 22: U.K. Xanthan Gum Market Value (US$ Bn) Forecast, by Application, 2022–2031
Table 23: Italy Xanthan Gum Market Volume (Tons) Forecast, by Application, 2022–2031
Table 24: Italy Xanthan Gum Market Value (US$ Bn) Forecast, by Application, 2022–2031
Table 25: Spain Xanthan Gum Market Volume (Tons) Forecast, by Application, 2022–2031
Table 26: Spain Xanthan Gum Market Value (US$ Bn) Forecast, by Application, 2022–2031
Table 27: Russia & CIS Xanthan Gum Market Volume (Tons) Forecast, by Application, 2022–2031
Table 28: Russia & CIS Xanthan Gum Market Value (US$ Bn) Forecast, by Application, 2022–2031
Table 29: Rest of Europe Xanthan Gum Market Volume (Tons) Forecast, by Application, 2022–2031
Table 30: Rest of Europe Xanthan Gum Market Value (US$ Bn) Forecast, by Application, 2022–2031
Table 31: Asia Pacific Xanthan Gum Market Volume (Tons) Forecast, by Application, 2022–2031
Table 32: Asia Pacific Xanthan Gum Market Value (US$ Bn) Forecast, by Application, 2022–2031
Table 33: Asia Pacific Xanthan Gum Market Volume (Tons) Forecast, by Country and Sub-region, 2022–2031
Table 34: Asia Pacific Xanthan Gum Market Value (US$ Bn) Forecast, by Country and Sub-region, 2022–2031
Table 35: China Xanthan Gum Market Volume (Tons) Forecast, by Application, 2022–2031
Table 36: China Xanthan Gum Market Value (US$ Bn) Forecast, by Application 2022–2031
Table 37: Japan Xanthan Gum Market Volume (Tons) Forecast, by Application, 2022–2031
Table 38: Japan Xanthan Gum Market Value (US$ Bn) Forecast, by Application, 2022–2031
Table 39: India Xanthan Gum Market Volume (Tons) Forecast, by Application, 2022–2031
Table 40: India Xanthan Gum Market Value (US$ Bn) Forecast, by Application, 2022–2031
Table 41: ASEAN Xanthan Gum Market Volume (Tons) Forecast, by Application, 2022–2031
Table 42: ASEAN Xanthan Gum Market Value (US$ Bn) Forecast, by Application, 2022–2031
Table 43: Rest of Asia Pacific Xanthan Gum Market Volume (Tons) Forecast, by Application, 2022–2031
Table 44: Rest of Asia Pacific Xanthan Gum Market Value (US$ Bn) Forecast, by Application, 2022–2031
Table 45: Latin America Xanthan Gum Market Volume (Tons) Forecast, by Application, 2022–2031
Table 46: Latin America Xanthan Gum Market Value (US$ Bn) Forecast, by Application, 2022–2031
Table 47: Latin America Xanthan Gum Market Volume (Tons) Forecast, by Country and Sub-region, 2022–2031
Table 48: Latin America Xanthan Gum Market Value (US$ Bn) Forecast, by Country and Sub-region, 2022–2031
Table 49: Brazil Xanthan Gum Market Volume (Tons) Forecast, by Application, 2022–2031
Table 50: Brazil Xanthan Gum Market Value (US$ Bn) Forecast, by Application, 2022–2031
Table 51: Mexico Xanthan Gum Market Volume (Tons) Forecast, by Application, 2022–2031
Table 52: Mexico Xanthan Gum Market Value (US$ Bn) Forecast, by Application, 2022–2031
Table 53: Rest of Latin America Xanthan Gum Market Volume (Tons) Forecast, by Application, 2022–2031
Table 54: Rest of Latin America Xanthan Gum Market Value (US$ Bn) Forecast, by Application, 2022–2031
Table 55: Middle East & Africa Xanthan Gum Market Volume (Tons) Forecast, by Application, 2022–2031
Table 56: Middle East & Africa Xanthan Gum Market Value (US$ Bn) Forecast, by Application, 2022–2031
Table 57: Middle East & Africa Xanthan Gum Market Volume (Tons) Forecast, by Country and Sub-region, 2022–2031
Table 58: Middle East & Africa Xanthan Gum Market Value (US$ Bn) Forecast, by Country and Sub-region, 2022–2031
Table 59: GCC Xanthan Gum Market Volume (Tons) Forecast, by Application, 2022–2031
Table 60: GCC Xanthan Gum Market Value (US$ Bn) Forecast, by Application, 2022–2031
Table 61: South Africa Xanthan Gum Market Volume (Tons) Forecast, by Application, 2022–2031
Table 62: South Africa Xanthan Gum Market Value (US$ Bn) Forecast, by Application, 2022–2031
Table 63: Rest of Middle East & Africa Xanthan Gum Market Volume (Tons) Forecast, by Application, 2022–2031
Table 64: Rest of Middle East & Africa Xanthan Gum Market Value (US$ Bn) Forecast, by Application, 2022–2031
List of Figures
Figure 1: Global Xanthan Gum Market Volume Share Analysis, by Application, 2021, 2025, and 2031
Figure 2: Global Xanthan Gum Market Attractiveness, by Application
Figure 3: Global Xanthan Gum Market Volume Share Analysis, by Region, 2021, 2025, and 2031
Figure 4: Global Xanthan Gum Market Attractiveness, by Region
Figure 5: North America Xanthan Gum Market Volume Share Analysis, by Application, 2021, 2025, and 2031
Figure 6: North America Xanthan Gum Market Attractiveness, by Application
Figure 7: North America Xanthan Gum Market Attractiveness, by Application
Figure 8: North America Xanthan Gum Market Attractiveness, by Country and Sub-region
Figure 9: Europe Xanthan Gum Market Volume Share Analysis, by Application, 2021, 2025, and 2031
Figure 10: Europe Xanthan Gum Market Attractiveness, by Application
Figure 11: Europe Xanthan Gum Market Volume Share Analysis, by Country and Sub-region, 2021, 2025, and 2031
Figure 12: Europe Xanthan Gum Market Attractiveness, by Country and Sub-region
Figure 13: Asia Pacific Xanthan Gum Market Volume Share Analysis, by Application, 2021, 2025, and 2031
Figure 14: Asia Pacific Xanthan Gum Market Attractiveness, by Application
Figure 15: Asia Pacific Xanthan Gum Market Volume Share Analysis, by Country and Sub-region, 2021, 2025, and 2031
Figure 16: Asia Pacific Xanthan Gum Market Attractiveness, by Country and Sub-region
Figure 17: Latin America Xanthan Gum Market Volume Share Analysis, by Application, 2021, 2025, and 2031
Figure 18: Latin America Xanthan Gum Market Attractiveness, by Application
Figure 19: Latin America Xanthan Gum Market Volume Share Analysis, by Country and Sub-region, 2021, 2025, and 2031
Figure 20: Latin America Xanthan Gum Market Attractiveness, by Country and Sub-region
Figure 21: Middle East & Africa Xanthan Gum Market Volume Share Analysis, by Application, 2021, 2025, and 2031
Figure 22: Middle East & Africa Xanthan Gum Market Attractiveness, by Application
Figure 23: Middle East & Africa Xanthan Gum Market Volume Share Analysis, by Country and Sub-region, 2021, 2025, and 2031
Figure 24: Middle East & Africa Xanthan Gum Market Attractiveness, by Country and Sub-region
Copyright © Transparency Market Research, Inc. All Rights reserved
Trust Online


Xanthan Gum Market