Terrestrial Trunked Radio (TETRA) Market

Terrestrial Trunked Radio (TETRA) Market (Application - Transportation & Logistics, Aviation, Oil & Gas, and Public Safety; Component - Hardware, Software, and Services; Device Type - Portable and Vehicular) - Global Industry Analysis, Size, Share, Growth, Trends and Forecast 2017 - 2025

Global TETRA Market: Snapshot

The global terrestrial trunked radio (TETRA) market is set for sound growth in the forthcoming years. This is primarily to provide foolproof communication systems for homeland security of nations. Apart from this, communication needs of various public safety agencies such as police, fire department, utility companies, and other services that need to transmit critical information in a timely manner is also leading to the deployment of TETRA systems.

Due to its capability, TETRA has been deployed at some global public spectacles. For instance, in 2015, the state secretary of Rio de Janeiro engaged a company called Teltronic for secure mobile radio communication for Rio Olympics 2016.

A report by Transparency Market Research (TMR) projects the global TETRA market to clock a healthy 11.97% CAGR during the forecast period from 2017 to 2025. Progressing at this rate, the market will reach a valuation of US$12,166.7 mn by the end of 2025.

terrestrial trunked radio market

Public Safety Application Segment Wins by Share due to High Consideration for Civilian Safety

The report studies the global TETRA market on the basis of application, component, device type, and region. On the basis of component, the TETRA market has been bifurcated into hardware, software, and services. Of them, the services segment is likely to clock a notable 12.11% CAGR for the global TETRA market during the forecast period. TETRA services helps to maximize uptime and efficiency of radio communication systems. The various types of TETRA services include support, training, security, network management, optimization, integration, and maintenance services. The array of services also ensure high performance of TETRA in a cost effective manner.

However, hardware segment is anticipated to account for the leading market share of 43.9% by 2025. In absolute numbers, the hardware segment is anticipated to be worth US$5,340.4 mn by the end of 2025. The hardware segment is displaying growth mainly because of increasing adoption of TETRA radios and base stations across the world.

In terms of device type, the TETRA market is categorized into portable and vehicular TETRA devices. Of the two, portable TETRA device is likely to account for the leading market share over the forecast period. Portable TETRA devices provide advantage due to their compact size. This allows safety agencies to perform functions on the go. Portable TETRA devices are also useful in the event of emergency situations or to obtain directions for remotely located destinations, as it is loaded with GPS and Bluetooth technology. In absolute value, portable TETRA devices segment is likely to be valued at US$8,022.8 mn by the end of 2025.

Depending on application, the TETRA market is segmented into transportation and logistics, aviation, oil & gas, public safety, and others. The other segment comprise military and defense, manufacturing, mining, retail, commercial, utilities, and healthcare. Amongst them, the public safety segment is estimated to account for the leading revenue contribution to the global market over the forecast period. The leading growth of this segment is mainly because of widespread adoption of TETRA systems by public safety agencies such as police patrol and law enforcement forces. Public safety is the focus of most players in the market to gain competitive advantage.

Asia Pacific to Emerge Attractive

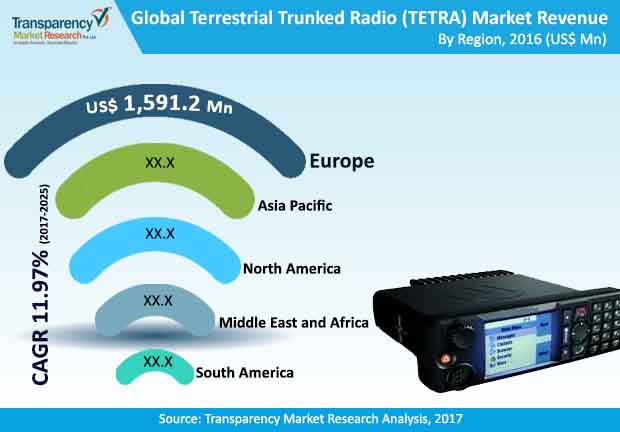
The TETRA market has been divided into key regions of North America, Europe, Asia Pacific, the Middle East and Africa, and South America. Europe holds prominence among other key regions as TETRA was first adopted in Europe. Europe also holds significance in terms of installation of TETRA base stations and the number of TETRA users.

Asia Pacific has emerged as a lucrative market for TETRA in the recent past. This is mainly because of adoption of TETRA by transport and public safety agencies in China, India, and Japan.

Leading players in the global TETRA market include Motorola Solutions, ROHILL Engineering B.V., Damm Cellular Systems A/S, Airbus Defense and Space Oy, Rolta India Limited, Simoco Wireless Solutions, Cobham plc, JVCKENWOOD Corporation, Hytera Communications, and Leonardo among others.

Terrestrial Trunked Radio (TETRA) Market to Witness Notable Growth from Increasing Application in Clinical Administrations

The increasing adoption of advanced communication systems for homeland security worldwide is a key factor boosting the global terrestrial trunked radio market. Terrestrial trunked radios have the capacity to move information rapidly when contrasted with the portable interchanges prior is additionally boosting their interest. Terrestrial trunked radio is a private, advanced portable radio technology, discovering its application in clinical, transport, security, and fire administrations. As all correspondences by means of terrestrial trunked radio are private and secure, they are progressively being embraced. As sellers working in the terrestrial trunked radio market are investing every one of their amounts of energy towards understanding a safe, solid, and effective specialized technique in order to satisfy the necessities of purchasers, the market is seeing a development.

The market is driven by factors such as the progress of radio specialized gadgets from simple to computerized and developing utilization of portable radio interchanges in the transportation business. Terrestrial trunked radio innovation offers remarkable highlights to versatile correspondence, by joining the highlights of portable mobile phones with quick information correspondence and the workgroup abilities of PMR.

Furthermore, the developing interest for crucial interchanges and increasing utilization of portable radio correspondences in the transportation business could prompt huge freedoms for this market sooner rather than later. TETRA is the biggest land versatile radio norm, has great range productivity, and remarkable basic correspondence highlights—like security, short hit set-up time, voice calls include set, and fast information administrations on direct mode and site trunking. Its selection is filling in existing and potential market portions, like public security and business applications.

The rising need to foolproof mission-control basic correspondence framework for country security of countries is basically driving the TETRA market. Further, the need to serve correspondence needs of different public wellbeing offices, for example, local group of fire-fighters, police, service organizations, and different administrations is likewise stirring up the market's development. These organizations handle basic data that are likely to create lucrative growth opportunities in the coming years.

The global TETRA Market has been segmented as follows:

by Application

  • Transportation & Logistics
  • Aviation
  • Oil & Gas
  • Public Safety
  • Others

by Component

  • Hardware
  • Software
  • Services

by Device Type

  • Portable
  • Vehicular

By Geography

  • North America
    • The U.S.
    • Canada
    • Rest of North America
  • Europe
    • The U.K
    • Germany
    • France
    • Rest of Europe
  • Asia Pacific (APAC)
    •  China
    •  Japan
    •  India
    •  Rest of APAC
  • Middle East and Africa (MEA)
    • GCC Countries
    • South Africa
    • Rest of MEA
  • South America
    • Brazil
    • Rest of South America
    1. Preface
         1.1. Market Definition and Scope
         1.2. Market Segmentation
         1.3. Key Research Objectives
         1.4. Research Highlights
     
    2. Assumptions and Research Methodology
     
    3. Executive Summary : Global TETRA Market
     
    4. Key Industry Developments
     
    5. Market Overview
         5.1. Introduction
         5.2. Market Dynamics
                5.2.1. Drivers
                5.2.2. Restraints
                5.2.3. Opportunities
         5.3. Global TETRA Market Analysis and Forecasts, 2015 – 2025
                5.3.1. Market Revenue Projections (US$ Mn)
         5.4. Porter’s Five Force Model
         5.5. Eco-system Analysis
         5.6. Market Outlook
     
    6. Global TETRA Market Analysis and Forecasts, By Application 
         6.1. Overview & Definitions
         6.2. Market Size (US$ Mn) Forecast By Application, 2015 – 2025
                6.2.1. Transportation & Logistics
                6.2.2. Aviation
                6.2.3. Oil & Gas
                6.2.4. Public Safety
                6.2.5. Others
         6.3. Market Attractiveness By Application 
     
    7. Global TETRA Market Analysis and Forecasts, By Components 
         7.1. Overview & Definitions
         7.2. Market Size (US$ Mn) Forecast By Components , 2015 – 2025
                7.2.1. Hardware
                7.2.2. Software
                7.2.3. Services
         7.3. Market Attractiveness By Components
     
    8. Global TETRA Market Analysis and Forecasts, By Device Type 
         8.1. Overview & Definitions
         8.2. Market Size (US$ Mn) Forecast By Device Type , 2015 – 2025
                8.2.1. Portable
                8.2.2. Vehicular
         8.3. Market Attractiveness By Device Type
     
    9. Global TETRA Market Analysis and Forecasts, By Region
         9.1. Key Findings
         9.2. Market Size (US$ Mn) Forecast By Region, 2015 – 2025
                9.2.1. North America
                9.2.2. Europe
                9.2.3. Asia Pacific
                9.2.4. Middle East and Africa
                9.2.5. South America
         9.3. Market Attractiveness By Country/Region
     
    10. North America Edge Analytics Market Analysis and Forecast 
         10.1. Key Findings     
         10.2. Key Trends
         10.3. Market Size (US$ Mn) Forecast By Application, 2015 – 2025
                10.3.1. Transportation & Logistics
                10.3.2. Aviation
                10.3.3. Oil & Gas
                10.3.4. Public Safety
                10.3.5. Others
         10.4. Market Size (US$ Mn) Forecast By Components , 2015 – 2025
                10.4.1. Hardware
                10.4.2. Software
                10.4.3. Services
         10.5. Market Size (US$ Mn) Forecast By Device Type , 2015 – 2025
                10.5.1. Portable
                10.5.2. Vehicular
         10.6. Market Size (US$ Mn) Forecast By Country, 2015 – 2025
                10.6.1. The U.S.
                           10.6.1.1. Market Size (US$ Mn) Forecast By Application, 2015 – 2025
                                       10.6.1.1.1. Transportation & Logistics
                                       10.6.1.1.2. Aviation
                                       10.6.1.1.3. Oil & Gas
                                       10.6.1.1.4. Public Safety
                                       10.6.1.1.5. Others
                           10.6.1.2. Market Size (US$ Mn) Forecast By Components , 2015 – 2025
                                       10.6.1.2.1. Hardware
                                       10.6.1.2.2. Software
                                       10.6.1.2.3. Services
                           10.6.1.3. Market Size (US$ Mn) Forecast By Device Type , 2015 – 2025
                                       10.6.1.3.1. Portable
                                       10.6.1.3.2. Vehicular
                10.6.2. Canada
                           10.6.2.1. Market Size (US$ Mn) Forecast By Application, 2015 – 2025
                                       10.6.2.1.1. Transportation & Logistics
                                       10.6.2.1.2. Aviation
                                       10.6.2.1.3. Oil & Gas
                                       10.6.2.1.4. Public Safety
                                       10.6.2.1.5. Others
                           10.6.2.2. Market Size (US$ Mn) Forecast By Components , 2015 – 2025
                                       10.6.2.2.1. Hardware
                                       10.6.2.2.2. Software
                                       10.6.2.2.3. Services
                           10.6.2.3. Market Size (US$ Mn) Forecast By Device Type , 2015 – 2025
                                       10.6.2.3.1. Portable
                                       10.6.2.3.2. Vehicular
                10.6.3. Rest of North America
                           10.6.3.1. Market Size (US$ Mn) Forecast By Application, 2015 – 2025
                                       10.6.3.1.1. Transportation & Logistics
                                       10.6.3.1.2. Aviation
                                       10.6.3.1.3. Oil & Gas
                                       10.6.3.1.4. Public Safety
                                       10.6.3.1.5. Others
                           10.6.3.2. Market Size (US$ Mn) Forecast By Components , 2015 – 2025
                                       10.6.3.2.1. Hardware
                                       10.6.3.2.2. Software
                                       10.6.3.2.3. Services
                           10.6.3.3. Market Size (US$ Mn) Forecast By Device Type , 2015 – 2025
                                       10.6.3.3.1. Portable
                                       10.6.3.3.2. Vehicular
        10.7. Market Attractiveness Analysis
                10.7.1. By Application
                10.7.2. By Components
                10.7.3. By Device Type
                10.7.4. By Country
     
    11. Europe Edge Analytics Market Analysis and Forecast 
         11.1. Key Findings
         11.2. Key Trends
         11.3. Market Size (US$ Mn) Forecast By Application, 2015 – 2025
                11.3.1. Transportation & Logistics
                11.3.2. Aviation
                11.3.3. Oil & Gas
                11.3.4. Public Safety
                11.3.5. Others
         11.4. Market Size (US$ Mn) Forecast By Components , 2015 – 2025
                11.4.1. Hardware
                11.4.2. Software
                11.4.3. Services
         11.5. Market Size (US$ Mn) Forecast By Device Type , 2015 – 2025
                11.5.1. Portable
                11.5.2. Vehicular
         11.6. Market Size (US$ Mn) Forecast By Country, 2015 – 2025
                11.6.1. The U.K.
                           11.6.1.1. Market Size (US$ Mn) Forecast By Application, 2015 – 2025
                                       11.6.1.1.1. Transportation & Logistics
                                       11.6.1.1.2. Aviation
                                       11.6.1.1.3. Oil & Gas
                                       11.6.1.1.4. Public Safety
                                       11.6.1.1.5. Others
                           11.6.1.2. Market Size (US$ Mn) Forecast By Components , 2015 – 2025
                                       11.6.1.2.1. Hardware
                                       11.6.1.2.2. Software
                                       11.6.1.2.3. Services
                           11.6.1.3. Market Size (US$ Mn) Forecast By Device Type , 2015 – 2025
                                       11.6.1.3.1. Portable
                                       11.6.1.3.2. Vehicular
                11.6.2. Germany
                           11.6.2.1. Market Size (US$ Mn) Forecast By Application, 2015 – 2025
                                       11.6.2.1.1. Transportation & Logistics
                                       11.6.2.1.2. Aviation
                                       11.6.2.1.3. Oil & Gas
                                       11.6.2.1.4. Public Safety
                                       11.6.2.1.5. Others
                           11.6.2.2. Market Size (US$ Mn) Forecast By Components , 2015 – 2025
                                       11.6.2.2.1. Hardware
                                       11.6.2.2.2. Software
                                       11.6.2.2.3. Services
                           11.6.2.3. Market Size (US$ Mn) Forecast By Device Type , 2015 – 2025
                                       11.6.2.3.1. Portable
                                       11.6.2.3.2. Vehicular
                11.6.3. France
                           11.6.3.1. Market Size (US$ Mn) Forecast By Application, 2015 – 2025
                                       11.6.3.1.1. Transportation & Logistics
                                       11.6.3.1.2. Aviation
                                       11.6.3.1.3. Oil & Gas
                                       11.6.3.1.4. Public Safety
                                       11.6.3.1.5. Others
                           11.6.3.2. Market Size (US$ Mn) Forecast By Components , 2015 – 2025
                                       11.6.3.2.1. Hardware
                                       11.6.3.2.2. Software
                                       11.6.3.2.3. Services
                           11.6.3.3. Market Size (US$ Mn) Forecast By Device Type , 2015 – 2025
                                       11.6.3.3.1. Portable
                                       11.6.3.3.2. Vehicular
                11.6.4. Rest of Europe
                           11.6.4.1. Market Size (US$ Mn) Forecast By Application, 2015 – 2025
                                       11.6.4.1.1. Transportation & Logistics
                                       11.6.4.1.2. Aviation
                                       11.6.4.1.3. Oil & Gas
                                       11.6.4.1.4. Public Safety
                                       11.6.4.1.5. Others
                           11.6.4.2. Market Size (US$ Mn) Forecast By Components , 2015 – 2025
                                       11.6.4.2.1. Hardware
                                       11.6.4.2.2. Software
                                       11.6.4.2.3. Services
                           11.6.4.3. Market Size (US$ Mn) Forecast By Device Type , 2015 – 2025
                                       11.6.4.3.1. Portable
                                       11.6.4.3.2. Vehicular
         11.7. Market Attractiveness Analysis 
                11.7.1. By Application
                11.7.2. By Components
                11.7.3. By Device Type
                11.7.4. By Country
     
    12. Asia Pacific Edge Analytics Market Analysis and Forecast
         12.1. Key Findings
         12.2. Key Trends
         12.3. Market Size (US$ Mn) Forecast By Application, 2015 – 2025
                12.3.1. Transportation & Logistics
                12.3.2. Aviation
                12.3.3. Oil & Gas
                12.3.4. Public Safety
                12.3.5. Others
         12.4. Market Size (US$ Mn) Forecast By Components , 2015 – 2025
                12.4.1. Hardware
                12.4.2. Software
                12.4.3. Services
         12.5. Market Size (US$ Mn) Forecast By Device Type , 2015 – 2025
                12.5.1. Portable
                12.5.2. Vehicular
         12.6. Market Size (US$ Mn) Forecast By Country, 2015 – 2025
                12.6.1. India
                           12.6.1.1. Market Size (US$ Mn) Forecast By Application, 2015 – 2025
                                       12.6.1.1.1. Transportation & Logistics
                                       12.6.1.1.2. Aviation
                                       12.6.1.1.3. Oil & Gas
                                       12.6.1.1.4. Public Safety
                                       12.6.1.1.5. Others
                           12.6.1.2. Market Size (US$ Mn) Forecast By Components , 2015 – 2025
                                       12.6.1.2.1. Hardware
                                       12.6.1.2.2. Software
                                       12.6.1.2.3. Services
                           12.6.1.3. Market Size (US$ Mn) Forecast By Device Type , 2015 – 2025
                                       12.6.1.3.1. Portable
                                       12.6.1.3.2. Vehicular
                12.6.2. Japan
                           12.6.2.1. Market Size (US$ Mn) Forecast By Application, 2015 – 2025
                                       12.6.2.1.1. Transportation & Logistics
                                       12.6.2.1.2. Aviation
                                       12.6.2.1.3. Oil & Gas
                                       12.6.2.1.4. Public Safety
                                       12.6.2.1.5. Others
                           12.6.2.2. Market Size (US$ Mn) Forecast By Components , 2015 – 2025
                                       12.6.2.2.1. Hardware
                                       12.6.2.2.2. Software
                                       12.6.2.2.3. Services
                           12.6.2.3. Market Size (US$ Mn) Forecast By Device Type , 2015 – 2025
                                       12.6.2.3.1. Portable
                                       12.6.2.3.2. Vehicular
                12.6.3. China
                           12.6.3.1. Market Size (US$ Mn) Forecast By Application, 2015 – 2025
                                       12.6.3.1.1. Transportation & Logistics
                                       12.6.3.1.2. Aviation
                                       12.6.3.1.3. Oil & Gas
                                       12.6.3.1.4. Public Safety
                                       12.6.3.1.5. Others
                           12.6.3.2. Market Size (US$ Mn) Forecast By Components , 2015 – 2025
                                       12.6.3.2.1. Hardware
                                       12.6.3.2.2. Software
                                       12.6.3.2.3. Services
                           12.6.3.3. Market Size (US$ Mn) Forecast By Device Type , 2015 – 2025
                                       12.6.3.3.1. Portable
                                       12.6.3.3.2. Vehicular
                12.6.4. Rest of Asia Pacific
                           12.6.4.1. Market Size (US$ Mn) Forecast By Application, 2015 – 2025
                                       12.6.4.1.1. Transportation & Logistics
                                       12.6.4.1.2. Aviation
                                       12.6.4.1.3. Oil & Gas
                                       12.6.4.1.4. Public Safety
                                       12.6.4.1.5. Others
                           12.6.4.2. Market Size (US$ Mn) Forecast By Components , 2015 – 2025
                                       12.6.4.2.1. Hardware
                                       12.6.4.2.2. Software
                                       12.6.4.2.3. Services
                           12.6.4.3. Market Size (US$ Mn) Forecast By Device Type , 2015 – 2025
                                       12.6.4.3.1. Portable
                                       12.6.4.3.2. Vehicular
         12.7. Market Attractiveness Analysis 
                12.7.1. By Application
                12.7.2. By Components
                12.7.3. By Device Type
                12.7.4. By Country
     
    13. Middle East and Africa (MEA) Edge Analytics Market Analysis and Forecast
         13.1. Key Findings
         13.2. Key Trends
         13.3. Market Size (US$ Mn) Forecast By Application, 2015 – 2025
                13.3.1. Transportation & Logistics
                13.3.2. Aviation
                13.3.3. Oil & Gas
                13.3.4. Public Safety
                13.3.5. Others
         13.4. Market Size (US$ Mn) Forecast By Components , 2015 – 2025
                13.4.1. Hardware
                13.4.2. Software
                13.4.3. Services
         13.5. Market Size (US$ Mn) Forecast By Device Type , 2015 – 2025
                13.5.1. Portable
                13.5.2. Vehicular
         13.6. Market Size (US$ Mn) Forecast By Country, 2015 – 2025
                           13.6.1.1. Market Size (US$ Mn) Forecast By Application, 2015 – 2025
                                       13.6.1.1.1. Transportation & Logistics
                                       13.6.1.1.2. Aviation
                                       13.6.1.1.3. Oil & Gas
                                       13.6.1.1.4. Public Safety
                                       13.6.1.1.5. Others
                           13.6.1.2. Market Size (US$ Mn) Forecast By Components , 2015 – 2025
                                       13.6.1.2.1. Hardware
                                       13.6.1.2.2. Software
                                       13.6.1.2.3. Services
                           13.6.1.3. Market Size (US$ Mn) Forecast By Device Type , 2015 – 2025
                                       13.6.1.3.1. Portable
                                       13.6.1.3.2. Vehicular
                13.6.2. South Africa
                           13.6.2.1. Market Size (US$ Mn) Forecast By Application, 2015 – 2025
                                       13.6.2.1.1. Transportation & Logistics
                                       13.6.2.1.2. Aviation
                                       13.6.2.1.3. Oil & Gas
                                       13.6.2.1.4. Public Safety
                                       13.6.2.1.5. Others
                           13.6.2.2. Market Size (US$ Mn) Forecast By Components , 2015 – 2025
                                       13.6.2.2.1. Hardware
                                       13.6.2.2.2. Software
                                       13.6.2.2.3. Services
                           13.6.2.3. Market Size (US$ Mn) Forecast By Device Type , 2015 – 2025
                                       13.6.2.3.1. Portable
                                       13.6.2.3.2. Vehicular
                13.6.3. Rest of MEA
                           13.6.3.1. Market Size (US$ Mn) Forecast By Application, 2015 – 2025
                                       13.6.3.1.1. Transportation & Logistics
                                       13.6.3.1.2. Aviation
                                       13.6.3.1.3. Oil & Gas
                                       13.6.3.1.4. Public Safety
                                       13.6.3.1.5. Others
                           13.6.3.2. Market Size (US$ Mn) Forecast By Components , 2015 – 2025
                                       13.6.3.2.1. Hardware
                                       13.6.3.2.2. Software
                                       13.6.3.2.3. Services
                           13.6.3.3. Market Size (US$ Mn) Forecast By Device Type , 2015 – 2025
                                       13.6.3.3.1. Portable
                                       13.6.3.3.2. Vehicular
         13.7. Market Attractiveness Analysis 
                13.7.1. By Application
                13.7.2. By Components
                13.7.3. By Device Type
                13.7.4. By Country
     
    14. South America Edge Analytics Market Analysis and Forecast
         14.1. Key Findings
         14.2. Key Trends
         14.3. Market Size (US$ Mn) Forecast By Application, 2015 – 2025
                14.3.1. Transportation & Logistics
                14.3.2. Aviation
                14.3.3. Oil & Gas
                14.3.4. Public Safety
                14.3.5. Others
         14.4. Market Size (US$ Mn) Forecast By Components , 2015 – 2025
                14.4.1. Hardware
                14.4.2. Software
                14.4.3. Services
         14.5. Market Size (US$ Mn) Forecast By Device Type , 2015 – 2025
                14.5.1. Portable
                14.5.2. Vehicular
         14.6. Market Size (US$ Mn) Forecast By Country, 2015 – 2025
                14.6.1. Brazil
                           14.6.1.1. Market Size (US$ Mn) Forecast By Application, 2015 – 2025
                                       14.6.1.1.1. Transportation & Logistics
                                       14.6.1.1.2. Aviation
                                       14.6.1.1.3. Oil & Gas
                                       14.6.1.1.4. Public Safety
                                       14.6.1.1.5. Others
                           14.6.1.2. Market Size (US$ Mn) Forecast By Components , 2015 – 2025
                                       14.6.1.2.1. Hardware
                                       14.6.1.2.2. Software
                                       14.6.1.2.3. Services
                           14.6.1.3. Market Size (US$ Mn) Forecast By Device Type , 2015 – 2025
                                       14.6.1.3.1. Portable
                                       14.6.1.3.2. Vehicular
                14.6.2. Rest of South America
                           14.6.2.1. Market Size (US$ Mn) Forecast By Application, 2015 – 2025
                                       14.6.2.1.1. Transportation & Logistics
                                       14.6.2.1.2. Aviation
                                       14.6.2.1.3. Oil & Gas
                                       14.6.2.1.4. Public Safety
                                       14.6.2.1.5. Others
                           14.6.2.2. Market Size (US$ Mn) Forecast By Components , 2015 – 2025
                                       14.6.2.2.1. Hardware
                                       14.6.2.2.2. Software
                                       14.6.2.2.3. Services
                           14.6.2.3. Market Size (US$ Mn) Forecast By Device Type , 2015 – 2025
                                       14.6.2.3.1. Portable
                                       14.6.2.3.2. Vehicular
         14.7. Market Attractiveness Analysis 
                14.7.1. By Application
                14.7.2. By Components
                14.7.3. By Device Type
                14.7.4. By Country
     
    15. Competition Landscape
         15.1. Market Player – Competition Matrix
         15.2. Market Share Analysis By Company (2016) 
         15.3. Company Profiles (Details – Overview, Financials, Recent Developments, SWOT, Strategy)
                15.3.1.  Motorola Solutions
    • Overview
    • Financials
    • Recent Developments
    • SWOT
    • Strategy

                15.3.2.  ROHILL Engineering B.V.

    • Overview
    • Financials
    • Recent Developments
    • SWOT
    • Strategy
                15.3.3.  Damm Cellular Systems A/S
    • Overview
    • Financials
    • Recent Developments
    • SWOT
    • Strategy
                15.3.4.  Airbus Defence and Space Oy
    • Overview
    • Financials
    • Recent Developments
    • SWOT
    • Strategy
                15.3.5.  Rolta India Limited
    • Overview
    • Financials
    • Recent Developments
    • SWOT
    • Strategy
                15.3.6.  Simoco Wireless Solutions
    • Overview
    • Financials
    • Recent Developments
    • SWOT
    • Strategy
                15.3.7.  Cobham Plc.
    • Overview
    • Financials
    • Recent Developments
    • SWOT
    • Strategy
                15.3.8.  JVCKENWOOD Corporation
    • Overview
    • Financials
    • Recent Developments
    • SWOT
    • Strategy
                15.3.9.  Hytera Communications
    • Overview
    • Financials
    • Recent Developments
    • SWOT
    • Strategy
                15.3.10. Leonardo
    • Overview
    • Financials
    • Recent Developments
    • SWOT
    • Strategy
    16. Key Takeaways
    List of Tables
     
    Table 01: Global TETRA Market Size (US$ Mn) Forecast, By Application, 2015–2025
    Table 02: Global TETRA Market Size (US$ Mn) Forecast, By Components, 2015–2025
    Table 03: Global TETRA Market Size (US$ Mn) Forecast, By Device Type, 2015–2025
    Table 04: Global TETRA Market Size (US$ Mn) Forecast, By Region, 2015–2025
    Table 05: North America TETRA Market Size (US$ Mn) Forecast, By Application, 2015–2025
    Table 06: North America TETRA Market Size (US$ Mn) Forecast, By Components, 2015–2025
    Table 07: North America TETRA Market Size (US$ Mn) Forecast, By Device Type, 2015–2025
    Table 08: North America TETRA Market Size (US$ Mn) Forecast, By Country/Region, 2015–2025
    Table 09: The U.S. TETRA Market Size (US$ Mn) Forecast, By Application, 2015–2025
    Table 10: The U.S. TETRA Market Size (US$ Mn) Forecast, By Components, 2015–2025
    Table 11: The U.S. TETRA Market Size (US$ Mn) Forecast, By Device Type, 2015–2025
    Table 12: Canada TETRA Market Size (US$ Mn) Forecast, By Application, 2015–2025Table 13: Canada TETRA Market Size (US$ Mn) Forecast, By Components, 2015–2025
    Table 14: Canada TETRA Market Size (US$ Mn) Forecast, By Device Type, 2015–2025
    Table 15: Rest of North America TETRA Market Size (US$ Mn) Forecast, By Application, 2015–2025
    Table 16: Rest of North America TETRA Market Size (US$ Mn) Forecast, By Components, 2015–2025
    Table 17: Rest of North America TETRA Market Size (US$ Mn) Forecast, By Device Type, 2015–2025
    Table 18: Europe TETRA Market Size (US$ Mn) Forecast, By Application, 2015–2025
    Table 19: Europe TETRA Market Size (US$ Mn) Forecast, By Components, 2015–2025
    Table 20: Europe TETRA Market Size (US$ Mn) Forecast, By Device Type, 2015–2025
    Table 21: Europe TETRA Market Size (US$ Mn) Forecast, By Country/Region, 2015–2025
    Table 22: The U.K. TETRA Market Size (US$ Mn) Forecast, By Application, 2015–2025
    Table 23: The U.K. TETRA Market Size (US$ Mn) Forecast, By Components 2015–2025
    Table 24: The U.K. TETRA Market Size (US$ Mn) Forecast, By Device Type 2015–2025
    Table 25: Germany TETRA Market Size (US$ Mn) Forecast, By Application, 2015–2025
    Table 26: Germany TETRA Market Size (US$ Mn) Forecast, By Components, 2015–2025
    Table 27: Germany TETRA Market Size (US$ Mn) Forecast, By Device Type, 2015–2025
    Table 28: France TETRA Market Size (US$ Mn) Forecast, By Application, 2015–2025
    Table 29: France TETRA Market Size (US$ Mn) Forecast, By Components, 2015–2025
    Table 30: France TETRA Market Size (US$ Mn) Forecast, By Device Type, 2015–2025
    Table 31: Rest of Europe TETRA Market Size (US$ Mn) Forecast, By Application, 2015–2025
    Table 32: Rest of Europe TETRA Market Size (US$ Mn) Forecast, By Components, 2015–2025
    Table 33: Rest of Europe TETRA Market Size (US$ Mn) Forecast, By Device Type, 2015–2025
    Table 34: Asia Pacific TETRA Market Size (US$ Mn) Forecast, By Application, 2015–2025
    Table 35: Asia Pacific TETRA Market Size (US$ Mn) Forecast, By Components, 2015–2025
    Table 36: Asia Pacific TETRA Market Size (US$ Mn) Forecast, By Device Type, 2015–2025
    Table 37: Asia Pacific TETRA Market Size (US$ Mn) Forecast, By Country/Region, 2015–2025
    Table 38: India TETRA Market Size (US$ Mn) Forecast, By Application, 2015–2025
    Table 39: India TETRA Market Size (US$ Mn) Forecast, By Components, 2015–2025
    Table 40: India TETRA Market Size (US$ Mn) Forecast, By Device Type, 2015–2025
    Table 41: Japan TETRA Market Size (US$ Mn) Forecast, By Application, 2015–2025
    Table 42: Japan TETRA Market Size (US$ Mn) Forecast, By Components, 2015–2025
    Table 43: Japan TETRA Market Size (US$ Mn) Forecast, By Device Type, 2015–2025
    Table 44: China TETRA Market Size (US$ Mn) Forecast, By Application, 2015–2025
    Table 45: China TETRA Market Size (US$ Mn) Forecast, By Components, 2015–2025
    Table 46: China TETRA Market Size (US$ Mn) Forecast, By Device Type, 2015–2025
    Table 47: Rest of Asia Pacific TETRA Market Size (US$ Mn) Forecast, By Application, 2015–2025
    Table 48: Rest of Asia Pacific TETRA Market Size (US$ Mn) Forecast, By Components, 2015–2025
    Table 49: Rest of Asia Pacific TETRA Market Size (US$ Mn) Forecast, By Device Type, 2015–2025
    Table 50: Middle East & Africa TETRA Market Size (US$ Mn) Forecast, By Application, 2015–2025
    Table 51: Middle East & Africa TETRA Market Size (US$ Mn) Forecast, By Components, 2015–2025
    Table 52: Middle East & Africa TETRA Market Size (US$ Mn) Forecast, By Device Type, 2015–2025
    Table 53: Middle East & Africa TETRA Market Size (US$ Mn) Forecast, By Country/Region, 2015–2025
    Table 54: GCC Countries TETRA Market Size (US$ Mn) Forecast, By Application, 2015–2025
    Table 55: GCC Countries TETRA Market Size (US$ Mn) Forecast, By Components, 2015–2025
    Table 56: GCC Countries TETRA Market Size (US$ Mn) Forecast, By Device Type, 2015–2025
    Table 57: South Africa TETRA Market Size (US$ Mn) Forecast, By Application, 2015–2025
    Table 58: South Africa TETRA Market Size (US$ Mn) Forecast, By Components, 2015–2025
    Table 59: South Africa TETRA Market Size (US$ Mn) Forecast, By Device Type, 2015–2025
    Table 60: Rest of Middle East & Africa TETRA Market Analysis, By Application (US$ Mn), 2016 –2025
    Table 61: Rest of Middle East & Africa TETRA Market Size (US$ Mn) Forecast, By Components, 2015–2025
    Table 62: Rest of Middle East & Africa TETRA Market Size (US$ Mn) Forecast, By Device Type, 2015–2025
    Table 63: South America TETRA Market Size (US$ Mn) Forecast, By Application, 2015–2025
    Table 64: South America TETRA Market Size (US$ Mn) Forecast, By Components, 2015–2025
    Table 65: South America TETRA Market Size (US$ Mn) Forecast, By Device Type, 2015–2025
    Table 66: South America TETRA Market Size (US$ Mn) Forecast, By Country/Region, 2015–2025
    Table 67: Brazil TETRA Market Size (US$ Mn) Forecast, By Application, 2015–2025
    Table 68: Brazil TETRA Market Size (US$ Mn) Forecast, By Components, 2015–2025
    Table 69: Brazil TETRA Market Size (US$ Mn) Forecast, By Device Type, 2015–2025
    Table 70: Rest of South America TETRA Market Size (US$ Mn) Forecast, By Application, 2015–2025
    Table 71: Rest of South America TETRA Market Size (US$ Mn) Forecast, By Components, 2015–2025
    Table 72: Rest of South America TETRA Market Size (US$ Mn) Forecast, By Device Type, 2015–2025

    List of Figures

    Figure 01: Market Revenue (US$ Mn) Growth Analysis By Application, 2017-2025
    Figure 02: Market Revenue (US$ Mn) Growth Analysis By Components, 2017-2025
    Figure 03: Market Revenue (US$ Mn) Growth Analysis By Device Type, 2017-2025
    Figure 04: Market Revenue (US$ Mn) Growth Analysis By Region, 2017-2025
    Figure 05: Global TETRA Market Size (US$ Mn) Forecast, 2015 - 2025
    Figure 06: Global TETRA Market Y-o-Y Growth (Value %) Forecast, 2016 - 2025
    Figure 07: Global TETRA Market Revenue Share Analysis, By Application, 2016 and 2025
    Figure 08: Global TETRA Market Revenue (US$ Mn) Growth Analysis By Application, 2017-2025
    Figure 09: Global TETRA Market Attractiveness Analysis By Application
    Figure 10: Global TETRA Market Value Share Analysis, By Components, 2016 and 2025
    Figure 11: Global TETRA Market Revenue (US$ Mn) Growth Analysis By Components, 2017-2025
    Figure 12: Global TETRA Market Attractiveness Analysis By Components
    Figure 13: Global TETRA Market Value Share Analysis, By Device Type, 2016 and 2025
    Figure 14: Global TETRA Market Revenue (US$ Mn) Growth Analysis By Device Type, 2017-2025
    Figure 15: Global TETRA Market Attractiveness Analysis By Device Type
    Figure 16: Global TETRA Market Revenue (US$ Mn) Growth Analysis By Region, 2017-2025
    Figure 17: Global TETRA Market Attractiveness Analysis By Region
    Figure 18: North America TETRA Market Size (US$ Mn) Forecast, 2015–2025
    Figure 19: North America TETRA Market Size  Y-o-Y Growth Projections, 2016–2025
    Figure 20: North America TETRA Market Revenue Share Analysis, By Application, 2017 and 2025
    Figure 21: North America TETRA Market Revenue Share Analysis, By Components, 2017 and 2025
    Figure 22: North America TETRA Market Revenue Share Analysis, By Device Type, 2017 and 2025
    Figure 23: North America TETRA Market Revenue Share Analysis, By Country/Region, 2017 and 2025
    Figure 24: North America TETRA Market Revenue (US$ Mn) Growth Analysis By Application, 2017-2025
    Figure 25: North America TETRA Market Revenue share (%) Analysis By Components, 2017-2025
    Figure 26: North America TETRA Market Revenue (US$ Mn) Growth Analysis By Device Type, 2017-2025
    Figure 27: North America TETRA Market Revenue share (%) Analysis By Country, 2017-2025
    Figure 28: The U.S. TETRA Market Revenue Share Analysis, By Application, 2017 and 2025
    Figure 29: The U.S. TETRA Market Revenue Share Analysis, By Components, 2017 and 2025
    Figure 30: The U.S. TETRA Market Revenue Share Analysis, By Device Type, 2017 and 2025
    Figure 31: Canada TETRA Market Revenue Share Analysis, By Application, 2017 and 2025
    Figure 32: Canada TETRA Market Revenue Share Analysis, By Components, 2017 and 2025
    Figure 33: Canada TETRA Market Revenue Share Analysis, By Device Type, 2017 and 2025
    Figure 34: North America TETRA Market Attractiveness Analysis By Application
    Figure 35: North America TETRA Market Attractiveness Analysis By Components
    Figure 36: North America TETRA Market Attractiveness Analysis By Device Type
    Figure 37: North America TETRA Market Attractiveness Analysis By Country
    Figure 38: Europe TETRA Market Size (US$ Mn) Forecast, 2015–2025
    Figure 39: Europe TETRA Market Size Y-o-Y Growth Projections, 2016–2025
    Figure 40: Europe TETRA Market Revenue Share Analysis, By Application, 2017 and 2025
    Figure 41: Europe TETRA Market Revenue Share Analysis, By Components, 2017 and 2025
    Figure 42: Europe TETRA Market Revenue Share Analysis, By Device Type, 2017 and 2025
    Figure 43: Europe TETRA Market Revenue Share Analysis, By Country/Region, 2017 and 2025
    Figure 44: Europe TETRA Market Revenue (US$ Mn) Growth Analysis, By Application, 2017-2025
    Figure 45: Europe TETRA Market Revenue (US$ Mn) Growth Analysis, By Components, 2017-2025
    Figure 46: Europe TETRA Market Revenue (US$ Mn) Growth Analysis, By Device Type, 2017-2025
    Figure 47: Europe TETRA Market Revenue (US$ Mn) Growth Analysis, By Country, 2017-2025
    Figure 48: The U.K. TETRA Market Revenue Share Analysis, By Application, 2017 and 2025
    Figure 49: The U.K. TETRA Market Revenue Share Analysis, By Components, 2017 and 2025
    Figure 50: The U.K. TETRA Market Revenue Share Analysis, By Device Type, 2017 and 2025
    Figure 51: Germany TETRA Market Revenue Share Analysis, By Application, 2017 and 2025
    Figure 52: Germany TETRA Market Revenue Share Analysis, By Components, 2017 and 2025
    Figure 53: Germany TETRA Market Revenue Share Analysis, By Device Type, 2017 and 2025
    Figure 54: France TETRA Market Revenue Share Analysis, By Application, 2017 and 2025
    Figure 55: France TETRA Market Revenue Share Analysis, By Components, 2017 and 2025
    Figure 56: France TETRA Market Revenue Share Analysis, By Device Type, 2017 and 2025
    Figure 57: Europe TETRA Market Attractiveness Analysis, By Application
    Figure 58: Europe TETRA Market Attractiveness Analysis, By Components
    Figure 59: Europe TETRA Market Attractiveness Analysis By Device Type
    Figure 60: Europe TETRA Market Attractiveness Analysis By Country
    Figure 61: Asia Pacific TETRA Market Size (US$ Mn) Forecast, 2015–2025
    Figure 62: Asia Pacific TETRA Market Size Y-o-Y Growth Projections, 2016–2025
    Figure 63: Asia Pacific TETRA Market Revenue Share Analysis, By Application, 2017 and 2025
    Figure 64: Asia Pacific TETRA Market Revenue Share Analysis, By Components, 2017 and 2025
    Figure 65: Asia Pacific TETRA Market Revenue Share Analysis, By Device Type, 2017 and 2025
    Figure 66: Asia Pacific TETRA Market Revenue Share Analysis, By Country/Region, 2017 and 2025
    Figure 67: Asia Pacific TETRA Market Revenue (US$ Mn) Growth Analysis, By Application, 2017-2025
    Figure 68: Asia Pacific TETRA Market Revenue share (%) Analysis, By Components, 2017-2025
    Figure 69: Asia Pacific TETRA Market Revenue (US$ Mn) Growth Analysis, By Device Type, 2017-2025
    Figure 70: Asia Pacific TETRA Market Revenue share (%) Analysis, By Region, 2017-2025
    Figure 71: India TETRA Market Revenue Share Analysis, By Application, 2017 and 2025
    Figure 72: India TETRA Market Revenue Share Analysis, By Components, 2017 and 2025
    Figure 73: India TETRA Market Revenue Share Analysis, By Device Type, 2017 and 2025
    Figure 74: Japan TETRA Market Revenue Share Analysis, By Application, 2017 and 2025
    Figure 75: Japan TETRA Market Revenue Share Analysis, By Components, 2017 and 2025
    Figure 76: Japan TETRA Market Revenue Share Analysis, By Device Type, 2017 and 2025
    Figure 77: China TETRA Market Revenue Share Analysis, By Application, 2017 and 2025
    Figure 78: China TETRA Market Revenue Share Analysis, By Components, 2017 and 2025
    Figure 79: China TETRA Market Revenue Share Analysis, By Device Type, 2017 and 2025
    Figure 80: Asia Pacific TETRA Market Attractiveness Analysis, By Application
    Figure 81: Asia Pacific TETRA Market Attractiveness Analysis, By Components
    Figure 82: Asia Pacific TETRA Market Attractiveness Analysis, By Device Type
    Figure 83: Asia Pacific TETRA Market Attractiveness Analysis, By Country
    Figure 84: Middle East & Africa TETRA Market Size (US$ Mn) Forecast, 2015–2025
    Figure 85: Middle East & Africa TETRA Market Size Y-o-Y Growth Projections, 2016–2025
    Figure 86: Middle East & Africa TETRA Market Revenue Share Analysis, By Application, 2017 and 2025
    Figure 87: Middle East & Africa TETRA Market Revenue Share Analysis, By Components, 2017 and 2025
    Figure 88: Middle East & Africa TETRA Market Revenue Share Analysis, By Device Type, 2017 and 2025
    Figure 89: Middle East & Africa TETRA Market Revenue Share Analysis, By Country/Region, 2017 and 2025
    Figure 90: Middle East & Africa TETRA Market Revenue (US$ Mn) Growth Analysis, By Application, 2017-2025
    Figure 91: Middle East & Africa TETRA Market Revenue (US$ Mn) Growth Analysis, By Components, 2017-2025
    Figure 92: Middle East & Africa TETRA Market Revenue (US$ Mn) Growth Analysis, By Device Type, 2017-2025
    Figure 93: Middle East & Africa TETRA Market Revenue (US$ Mn) Growth Analysis, By Region, 2017-2025
    Figure 94: GCC Countries TETRA Market Revenue Share Analysis, By Application, 2017 and 2025
    Figure 95: GCC Countries TETRA Market Revenue Share Analysis, By Components, 2017 and 2025
    Figure 96: GCC Countries TETRA Market Revenue Share Analysis, By Device Type, 2017 and 2025
    Figure 97: South Africa TETRA Market Revenue Share Analysis, By Application, 2017 and 2025
    Figure 98: South Africa TETRA Market Revenue Share Analysis, By Components, 2017 and 2025
    Figure 99: South Africa TETRA Market Revenue Share Analysis, By Device Type, 2017 and 2025
    Figure 100: Middle East & Africa TETRA Market Attractiveness Analysis, By Application
    Figure 101: Middle East & Africa TETRA Market Attractiveness Analysis, By Components
    Figure 102: Middle East & Africa TETRA Market Attractiveness Analysis, By Device Type
    Figure 103: Middle East & Africa TETRA Market Attractiveness Analysis, By Region
    Figure 104: South America TETRA Market Size (US$ Mn) Forecast, 2015–2025
    Figure 105: South America TETRA Market Size Y-o-Y Growth Projections, 2016–2025
    Figure 106: South America TETRA Market Revenue Share Analysis, By Application, 2017 and 2025
    Figure 107: South America TETRA Market Revenue Share Analysis, By Components, 2017 and 2025
    Figure 108: South America TETRA Market Revenue Share Analysis, By Device Type, 2017 and 2025
    Figure 109: South America TETRA Market Revenue Share Analysis, By Country/Region, 2017 and 2025
    Figure 110: South America TETRA Market Revenue (US$ Mn) Growth Analysis, By Application, 2017-2025
    Figure 111: South America TETRA Market Revenue (US$ Mn) Growth Analysis, By Components, 2017-2025
    Figure 112: South America TETRA Market Revenue (US$ Mn) Growth Analysis, By Device Type, 2017-2025
    Figure 113: South America TETRA Market Revenue (US$ Mn) Growth Analysis, By Region, 2017-2025
    Figure 114: Brazil TETRA Market Revenue Share Analysis, By Application, 2017 and 2025
    Figure 115: Brazil TETRA Market Revenue Share Analysis, By Components, 2017 and 2025
    Figure 116: Brazil TETRA Market Revenue Share Analysis, By Device Type, 2017 and 2025
    Figure 117: South America TETRA Market Attractiveness Analysis, By Application
    Figure 118: South America TETRA Market Attractiveness Analysis, By Components
    Figure 119: South America TETRA Market Attractiveness Analysis, By Device Type
    Figure 120: South America TETRA Market Attractiveness Analysis, By Region
    Figure 121: Global TETRA Market Revenue Share Analysis, By Company (2016)

Copyright © Transparency Market Research, Inc. All Rights reserved