
Strides in Standard Logic Devices Market Open New Paths to Electronic Designs
Advances made in bipolar and CMOS technologies have become an integral part of electronic designs. The evolution of the standard logic devices market has stemmed from the advancements made in packaging of modern, low-power logic products. The standards underlying functionality and configuration has evolved simultaneously. Electronic manufacturers are increasingly looking to leverage the underlying technologies for developing bipolar logic ICs. Standard logic devices have emerged as a new staple for implementing logic circuits.
Standard logic devices and the packaging have become a key framework on promoting the production of extended lifecycle products and support high lead times faced by manufacturers generally. Over the years, new collaborations and partnerships have cropped up to meet the rise in requirements of standard logic devices among semiconductor companies.
A number of standard 5400/7400 logic family types are being demanded, bolstering the prospects of the standard logic devices market. The growing popularity of integrated circuits (ICs) can be underpinned by several benefits, key of which are ease of use and ready availability. However, there is a need for improving the complex functionality of products in the standard logic devices market. The focus on improving this aspect has increased in recent years. Complex functionalities are hindered by the fact that standard logic devices are characterized by the fixed functionality. Also, a number of chips are required to be put on printed circuit board (PCBs). The products can be availed off-the-shelf.
The growing demand for registered-based logic devices has positively affected the growth dynamics of the standard logic devices market. The market outlook is enriched by the improvements in the plastic and ceramic packages. Some of the key package options are DIP, SOIC, PLCC, PGA, BGA, and QFP. The rapid pace of digitalization is a key driver for the prospects of the standard logic devices market.
Standard Logic Devices Market: Snapshot
The standard logic devices market is expected to witness significant growth from 2017 to 2025. Electronic component industry has experienced robust growth in the last few years due to its expanding application areas. This growth is significantly contributed by the growth in consumer electronics products such as mobile phones, DVD, TV, etc. and office automation products like printers, computers, etc. This high growth has compelled many companies in these industries to set up new manufacturing units and expand the production capacity over the last few years. Furthermore, the ongoing technological advancements, are expected to expand the application areas of standard logic devices thus driving the growth of the standard logic devices industry during the forecast period.
The overall standard logic devices market size in terms of revenue is expected to reach US$92,695.7 mn by 2025. The global standard logic devices market is anticipated to expand at a CAGR of 6.9% during the forecast period from 2017 to 2025. In 2016, the global standard logic devices market revenue was pegged at US$51,199.3 mn.
Non-inverting Buffers to Witness High Demand
The standard logic devices market is segmented on the basis of gate IC type, buffer, transceiver, flip-flop, switches and multiplexers, and registers. On the basis of gate IC type the market is classified as OR, AND, Universal Gates (NAND and NOR), EXOR and EXNOR.
In terms of buffer, the market is segmented into inverting and non-inverting buffer. In 2016, non-inverting buffers accounted for more than half of the overall standard logic devices market. Based on transceiver the market is divided into standard, parity, and registered transceiver. Standard transceivers are estimated to dominate the market during the forecast period followed by the registered transceiver segment. The transceiver segment is expected to grow at a CAGR of 6.7% during the 2017-2025 forecast period and is projected to reach US$8.2 bn in 2025.
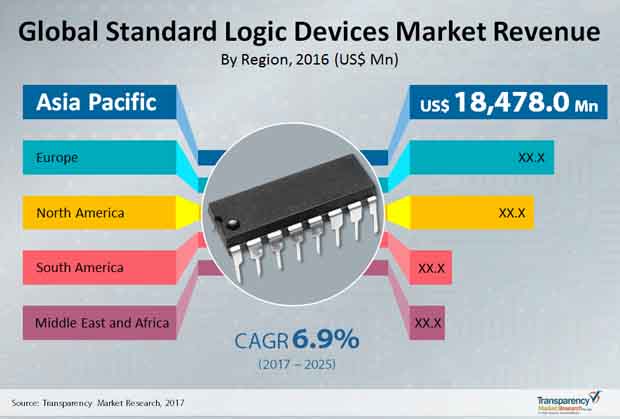
Asia Pacific Emerges as Dominant Regional Market
Asia Pacific held the leading share in the global standard logic devices market in 2016, with the market valued at close to US$18.5 bn. The market is expected to exhibit a robust 7.2% CAGR from 2017 to 2025, bested only by the MEA market’s 7.3%. The Middle East and Africa market for standard logic devices is likely to rise to close to US$6 bn by 2025.
One of the key drivers for the global standard logic devices market is the rising demand for automation technology in industrial settings as well as the automotive sector. Automation has made industrial operation much easier, while the demand for driver aid technology has grown steadily in the automobile industry. Growing adoption of driver aid technology in premium automobiles has led to a significant trickle-down effect in the industry, driving demand from the standard logic devices market across the automotive sector. The rising ultra-high-net-worth demographic in Asia Pacific and the Middle East is thus vital for the global standard logic devices market in the coming years.
The global standard logic devices market comprises large as well as mid-level vendors, including Analog Devices, Arrow Electronics, Diodes Incorporated and Texas Instruments. These companies have been able to establish a strong presence around the globe. Several new players are expected to enter the market in the coming years as the demand for standard logic devices is rising significantly. Other key players in this industry are STMicroelectronics N.V, Toshiba Semiconductor and Storage, ROHM Semiconductor, Microchip Technology Inc., NXP Semiconductors N.V., Maxim Integrated Products Inc., and ON Semiconductor.
Market Segmentation
|
by Gate IC Type |
|
|
by Buffer |
|
|
by Transceiver |
|
|
by Switches and Multiplexer Type |
|
|
by Geography |
|
Standard Logic Devices Market is projected to reach US$92,695.7 mn by 2025
STMicroelectronics N.V, Toshiba Semiconductor and Storage, ROHM Semiconductor, Microchip Technology Inc.,, are a few of the key vendors in the Standard Logic Devices Market.
The Standard Logic Devices Market is expected to grow at a CAGR of 6.9% during 2019-2025
Logic Devices Market by application, by Product, and by region
Asia Pacific Takes Lead in the Standard Logic Devices Market
1. Preface
1.1. Market Definition and Scope
1.2. Market Segmentation
1.3. Key Research Objectives
1.4. Research Highlights
2. Assumptions and Research Methodology
3. Executive Summary: Global Standard Logic Devices Market
4. Global Standard Logic Devices Market Analysis
4.1. Introduction
4.1.1. Definition
4.1.2. Industry Evolution / Developments
4.2. Market Dynamics
4.2.1. Drivers
4.2.2. Restraints
4.2.3. Opportunities
4.3. Key Trends
4.4. Global Standard Logic Devices Market Analysis and Forecasts, 2015 – 2025
4.4.1. Market Revenue Projections (US$ Mn)
4.5. Porter’s Five Forces Analysis
4.6. Ecosystem Analysis
4.7. Market Outlook
5. Global Standard Logic Devices Market Analysis and Forecast, By Gate IC Type
5.1. Definition
5.2. Global Standard Logic Devices Market Analysis (US$ Mn) and Forecast, By Gate IC Type, 2015 – 2025
5.2.1. OR
5.2.2. AND
5.2.3. Universal Gates (NAND and NOR)
5.2.4. EXOR
5.2.5. EXNOR
5.3. Gate IC Type Comparison Matrix
5.4. Market Attractiveness By Gate IC Type
6. Global Standard Logic Devices Market Analysis and Forecast, By Buffer/Driver type Industry
6.1. Definition
6.2. Global Standard Logic Devices Market Analysis (US$ Mn) and Forecast, By Buffer/Driver type, 2015 – 2025
6.2.1. Inverting
6.2.2. Non-inverting
6.3. Buffer/Driver type Comparison Matrix
6.4. Market Attractiveness By Buffer/Driver type
7. Global Standard Logic Devices Market Analysis and Forecast, By Transceiver Type
7.1. Definition
7.2. Global Standard Logic Devices Market Analysis (US$ Mn) and Forecast, By Transceiver Type, 2015 – 2025
7.2.1. Standard
7.2.2. Parity
7.2.3. Registered
7.3. Transceiver Type Comparison Matrix
7.4. Market Attractiveness Transceiver Type
8. Global Standard Logic Devices Market Analysis and Forecast, By Flip-Flop/Latches Type
8.1. Definition
8.2. Global Standard Logic Devices Market Analysis (US$ Mn) and Forecast, By Flip-Flop/Latches Type, 2015 – 2025
8.2.1. SR flip flop
8.2.2. D flip flop
8.2.3. JK flip flop
8.2.4. T flip flop
8.3. Flip-Flop/Latches Type Comparison Matrix
8.4. Market Attractiveness Flip-Flop/Latches Type
9. Global Standard Logic Devices Market Analysis and Forecast, By Switches and Multiplexer Type
9.1. Definition
9.2. Global Standard Logic Devices Market Analysis (US$ Mn) and Forecast, By Switches and Multiplexer Type, 2015 – 2025
9.2.1. Analog
9.2.2. Buffered
9.2.3. Protocol Specific
9.3. Switches and Multiplexer Type Comparison Matrix
9.4. Market Attractiveness Switches and Multiplexer Type
10. Global Standard Logic Devices Market Analysis and Forecast, By Registers Type
10.1. Definition
10.2. Global Standard Logic Devices Market Analysis (US$ Mn) and Forecast, By Registers Type, 2015 – 2025
10.2.1. Storage Registers
10.2.2. Shift Registers
10.3. Registers Type Comparison Matrix
10.4. Market Attractiveness By Registers Type
11. Global Standard Logic Devices Market Analysis Application and Forecast, By Region
11.1. Key Findings / Developments
11.2. Global Standard Logic Devices Market Analysis (US$ Mn) and Forecast, By Region, 2015 – 2025
11.2.1. North America
11.2.2. Europe
11.2.3. Asia Pacific
11.2.4. Middle East and Africa
11.2.5. South America
11.3. Region Comparison Matrix
11.4. Market Attractiveness By Region
12. North America Standard Logic Devices Market Analysis, 2015 – 2025
12.1. Key Findings
12.2. Standard Logic Devices Market Analysis, By Gate IC Type, 2015 – 2025 (US$ Mn)
12.2.1. OR
12.2.2. AND
12.2.3. Universal Gates (NAND and NOR)
12.2.4. EXOR
12.2.5. EXNOR
12.3. Standard Logic Devices Market Analysis, By Buffer/Driver Type, 2015 – 2025 (US$ Mn)
12.3.1. Inverting
12.3.2. Non-inverting
12.4. Standard Logic Devices Market Analysis, By Transceiver Type, 2015 – 2025 (US$ Mn)
12.4.1. Standard
12.4.2. Parity
12.4.3. Registered
12.5. Standard Logic Devices Market Analysis, By Flip-Flop/Latches Type, 2015 – 2025 (US$ Mn)
12.5.1. SR flip flop
12.5.2. D flip flop
12.5.3. JK flip flop
12.5.4. T flip flop
12.6. Standard Logic Devices Market Analysis, By Switches and Multiplexer Type, 2015 – 2025 (US$ Mn)
12.6.1. Analog
12.6.2. Buffered
12.6.3. Protocol Specific
12.7. Standard Logic Devices Market Analysis, By Registers Type, 2015 – 2025 (US$ Mn)
12.7.1. Storage Registers
12.7.2. Shift Registers
12.8. Standard Logic Devices Market Analysis, By Country, 2015 – 2025 (US$ Mn)
12.8.1. The U.S.
12.8.2. Canada
12.8.3. Rest of North America
12.9. Market Attractiveness Analysis
12.9.1. By Country
12.9.2. By Gate IC Type
12.9.3. By Buffer/Driver Type
12.9.4. By Transceiver Type
12.9.5. By Flip-Flop/Latches Type
12.9.6. By Switches and Multiplexer Type
12.9.7. By Registers Type
13. Europe Standard Logic Devices Market Analysis, 2015 – 2025
13.1. Key Findings
13.2. Standard Logic Devices Market Analysis, By Gate IC Type, 2015 – 2025 (US$ Mn)
13.2.1. OR
13.2.2. AND
13.2.3. Universal Gates (NAND and NOR)
13.2.4. EXOR
13.2.5. EXNOR
13.3. Standard Logic Devices Market Analysis, By Buffer/Driver Type, 2015 – 2025 (US$ Mn)
13.3.1. Inverting
13.3.2. Non-inverting
13.4. Standard Logic Devices Market Analysis, By Transceiver Type, 2015 – 2025 (US$ Mn)
13.4.1. Standard
13.4.2. Parity
13.4.3. Registered
13.5. Standard Logic Devices Market Analysis, By Flip-Flop/Latches Type, 2015 – 2025 (US$ Mn)
13.5.1. SR flip flop
13.5.2. D flip flop
13.5.3. JK flip flop
13.5.4. T flip flop
13.6. Standard Logic Devices Market Analysis, By Switches and Multiplexer Type, 2015 – 2025 (US$ Mn)
13.6.1. Analog
13.6.2. Buffered
13.6.3. Protocol Specific
13.7. Standard Logic Devices Market Analysis, By Registers Type, 2015 – 2025 (US$ Mn)
13.7.1. Storage Registers
13.7.2. Shift Registers
13.8. Standard Logic Devices Market Analysis, By Country, 2015 – 2025 (US$ Mn)
13.8.1. Germany
13.8.2. France
13.8.3. UK
13.8.4. Rest of Europe
13.9. Market Attractiveness Analysis
13.9.1. By Country
13.9.2. By Gate IC Type
13.9.3. By Buffer/Driver Type
13.9.4. By Transceiver Type
13.9.5. By Flip-Flop/Latches Type
13.9.6. By Switches and Multiplexer Type
13.9.7. By Registers Type
14. Asia Pacific Standard Logic Devices Market Analysis, 2015 – 2025
14.1. Key Findings
14.2. Standard Logic Devices Market Analysis, By Gate IC Type, 2015 – 2025 (US$ Mn)
14.2.1. OR
14.2.2. AND
14.2.3. Universal Gates (NAND and NOR)
14.2.4. EXOR
14.2.5. EXNOR
14.3. Standard Logic Devices Market Analysis, By Buffer/Driver Type, 2015 – 2025 (US$ Mn)
14.3.1. Inverting
14.3.2. Non-inverting
14.4. Standard Logic Devices Market Analysis, By Transceiver Type, 2015 – 2025 (US$ Mn)
14.4.1. Standard
14.4.2. Parity
14.4.3. Registered
14.5. Standard Logic Devices Market Analysis, By Flip-Flop/Latches Type, 2015 – 2025 (US$ Mn)
14.5.1. SR flip flop
14.5.2. D flip flop
14.5.3. JK flip flop
14.5.4. T flip flop
14.6. Standard Logic Devices Market Analysis, By Switches and Multiplexer Type, 2015 – 2025 (US$ Mn)
14.6.1. Analog
14.6.2. Buffered
14.6.3. Protocol Specific
14.7. Standard Logic Devices Market Analysis, By Registers Type, 2015 – 2025 (US$ Mn)
14.7.1. Storage Registers
14.7.2. Shift Registers
14.8. Standard Logic Devices Market Analysis, By Country, 2015 – 2025 (US$ Mn)
14.8.1. China
14.8.2. Japan
14.8.3. India
14.8.4. Australia
14.8.5. Rest of APAC
14.9. Market Attractiveness Analysis
14.9.1. By Country
14.9.2. By Gate IC Type
14.9.3. By Buffer/Driver Type
14.9.4. By Transceiver Type
14.9.5. By Flip-Flop/Latches Type
14.9.6. By Switches and Multiplexer Type
14.9.7. By Registers Type
15. Middle-East and Africa (MEA) Standard Logic Devices Market Analysis, 2015 – 2025
15.1. Key Findings
15.2. Standard Logic Devices Market Analysis, By Gate IC Type, 2015 – 2025 (US$ Mn)
15.2.1. OR
15.2.2. AND
15.2.3. Universal Gates (NAND and NOR)
15.2.4. EXOR
15.2.5. EXNOR
15.3. Standard Logic Devices Market Analysis, By Buffer/Driver Type, 2015 – 2025 (US$ Mn)
15.3.1. Inverting
15.3.2. Non-inverting
15.4. Standard Logic Devices Market Analysis, By Transceiver Type, 2015 – 2025 (US$ Mn)
15.4.1. Standard
15.4.2. Parity
15.4.3. Registered
15.5. Standard Logic Devices Market Analysis, By Flip-Flop/Latches Type, 2015 – 2025 (US$ Mn)
15.5.1. SR flip flop
15.5.2. D flip flop
15.5.3. JK flip flop
15.5.4. T flip flop
15.6. Standard Logic Devices Market Analysis, By Switches and Multiplexer Type, 2015 – 2025 (US$ Mn)
15.6.1. Analog
15.6.2. Buffered
15.6.3. Protocol Specific
15.7. Standard Logic Devices Market Analysis, By Registers Type, 2015 – 2025 (US$ Mn)
15.7.1. Storage Registers
15.7.2. Shift Registers
15.8. Standard Logic Devices Market Analysis, By Country, 2015 – 2025 (US$ Mn)
15.8.1. GCC Countries
15.8.2. South Africa
15.8.3. Rest of MEA
15.9. Market Attractiveness Analysis
15.9.1. By Country
15.9.2. By Gate IC Type
15.9.3. By Buffer/Driver Type
15.9.4. By Transceiver Type
15.9.5. By Flip-Flop/Latches Type
15.9.6. By Switches and Multiplexer Type
15.9.7. By Registers Type
16. South America Standard Logic Devices Market Analysis, 2015 – 2025
16.1. Key Findings
16.2. Standard Logic Devices Market Analysis, By Gate IC Type, 2015 – 2025 (US$ Mn)
16.2.1. OR
16.2.2. AND
16.2.3. Universal Gates (NAND and NOR)
16.2.4. EXOR
16.2.5. EXNOR
16.3. Standard Logic Devices Market Analysis, By Buffer/Driver Type, 2015 – 2025 (US$ Mn)
16.3.1. Inverting
16.3.2. Non-inverting
16.4. Standard Logic Devices Market Analysis, By Transceiver Type, 2015 – 2025 (US$ Mn)
16.4.1. Standard
16.4.2. Parity
16.4.3. Registered
16.5. Standard Logic Devices Market Analysis, By Flip-Flop/Latches Type, 2015 – 2025 (US$ Mn)
16.5.1. SR flip flop
16.5.2. D flip flop
16.5.3. JK flip flop
16.5.4. T flip flop
16.6. Standard Logic Devices Market Analysis, By Switches and Multiplexer Type, 2015 – 2025 (US$ Mn)
16.6.1. Analog
16.6.2. Buffered
16.6.3. Protocol Specific
16.7. Standard Logic Devices Market Analysis, By Registers Type, 2015 – 2025 (US$ Mn)
16.7.1. Storage Registers
16.7.2. Shift Registers
16.8. Standard Logic Devices Market Analysis, By Country, 2015 – 2025 (US$ Mn)
16.8.1. Brazil
16.8.2. Rest of South America
16.9. Market Attractiveness Analysis
16.9.1. By Country
16.9.2. By Gate IC Type
16.9.3. By Buffer/Driver Type
16.9.4. By Transceiver Type
16.9.5. By Flip-Flop/Latches Type
16.9.6. By Switches and Multiplexer Type
16.9.7. By Registers Type
17. Competitive Landscape
17.1. Market Player – Competition Matrix
17.2. Market Share Analysis By Company (2016)
17.3. Company Profiles (Details – Overview, Financials, Strategy and SWOT Analysis)
17.3.1. Analog Devices
17.3.1.1. Company Details (HQ, Foundation Year, Employee Strength)
17.3.1.2. Market Presence, By Segment.
17.3.1.3. Strategy
17.3.1.4. SWOT Analysis
17.3.2. Arrow Electronics
17.3.2.1. Company Details (HQ, Foundation Year, Employee Strength)
17.3.2.2. Market Presence, By Segment.
17.3.2.3. Strategy
17.3.2.4. SWOT Analysis
17.3.3. Diodes Incorporated
17.3.3.1. Company Details (HQ, Foundation Year, Employee Strength)
17.3.3.2. Market Presence, By Segment.
17.3.3.3. Strategy
17.3.3.4. SWOT Analysis
17.3.4. Linear Technology Corporation
17.3.4.1. Company Details (HQ, Foundation Year, Employee Strength)
17.3.4.2. Market Presence, By Segment.
17.3.4.3. Strategy
17.3.4.4. SWOT Analysis
17.3.5. Maxim Integrated Products Inc.
17.3.5.1. Company Details (HQ, Foundation Year, Employee Strength)
17.3.5.2. Market Presence, By Segment.
17.3.5.3. Strategy
17.3.5.4. SWOT Analysis
17.3.6. Microchip Technology Inc.
17.3.6.1. Company Details (HQ, Foundation Year, Employee Strength)
17.3.6.2. Market Presence, By Segment.
17.3.6.3. Strategy
17.3.6.4. SWOT Analysis
17.3.7. NXP Semiconductors N.V.
17.3.7.1. Company Details (HQ, Foundation Year, Employee Strength)
17.3.7.2. Market Presence, By Segment.
17.3.7.3. Strategy
17.3.7.4. SWOT Analysis
17.3.8. ON Semiconductor
17.3.8.1. Company Details (HQ, Foundation Year, Employee Strength)
17.3.8.2. Market Presence, By Segment.
17.3.8.3. Strategy
17.3.8.4. SWOT Analysis
17.3.9. ROHM Semiconductor
17.3.9.1. Company Details (HQ, Foundation Year, Employee Strength)
17.3.9.2. Market Presence, By Segment.
17.3.9.3. Strategy
17.3.9.4. SWOT Analysis
17.3.10. STMicroelectronics N.V.
17.3.10.1. Company Details (HQ, Foundation Year, Employee Strength)
17.3.10.2. Market Presence, By Segment.
17.3.10.3. Strategy
17.3.10.4. SWOT Analysis
17.3.11. Texas Instruments Inc.
17.3.11.1. Company Details (HQ, Foundation Year, Employee Strength)
17.3.11.2. Market Presence, By Segment.
17.3.11.3. Strategy
17.3.11.4. SWOT Analysis
17.3.12. Toshiba Semiconductor and Storage
17.3.12.1. Company Details (HQ, Foundation Year, Employee Strength)
17.3.12.2. Market Presence, By Segment.
17.3.12.3. Strategy
17.3.12.4. SWOT Analysis
18. Key Takeaways
List of Tables
Table 1: Global Standard Logic Devices Market Size Forecast, By Gate IC Type, 2015 – 2025 (US$ Mn)
Table 2: Global Standard Logic Devices Market Size Forecast, By Buffer/Driver Type, 2015 – 2025 (US$ Mn)
Table 3: Global Standard Logic Devices Market Size Forecast, By Transceiver Type, 2015 – 2025 (US$ Mn)
Table 4: Global Standard Logic Devices Market Size Forecast, By Flip flop Type, 2015 – 2025 (US$ Mn)
Table 5: Global Standard Logic Devices Market Size Forecast, By Switches and Multiplexer Type, 2015 – 2025 (US$ Mn)
Table 6: Global Standard Logic Devices Market Size Forecast, By Register Type, 2015 – 2025 (US$ Mn)
Table 7: Global Standard Logic Devices Market Size (US$ Mn) Forecast, By Region, 2015 – 2025
Table 8: North America Standard Logic Devices Market Forecast, By Gate IC Type, 2015 – 2025 (US$ Mn)
Table 9: North America Standard Logic Devices Market Size Forecast, By Buffer/Driver Type, 2015 – 2025 (US$ Mn)
Table 10: North America Standard Logic Devices Market Size Forecast, By Transceiver Type, 2015 – 2025 (US$ Mn)
Table 11: North America Standard Logic Devices Market Size Forecast, By Flip flop Type, 2015 – 2025 (US$ Mn)
Table 12: North America Standard Logic Devices Market Size Forecast, By Switches and Multiplexer Type, 2015 – 2025 (US$ Mn)
Table 13: North America Standard Logic Devices Market Size Forecast, By Register Type, 2015 – 2025 (US$ Mn)
Table 14: North America Standard Logic Devices Market Size Forecast, By Country, 2015–2025 (US$ Mn)
Table 15: Europe Standard Logic Devices Market Forecast, By Gate IC Type, 2015 – 2025 (US$ Mn)
Table 16: Europe Standard Logic Devices Market Size Forecast, By Buffer/Driver Type, 2015 – 2025 (US$ Mn)
Table 17: Europe Standard Logic Devices Market Size Forecast, By Transceiver Type, 2015 – 2025 (US$ Mn)
Table 18: Europe Standard Logic Devices Market Size Forecast, By Flip flop Type, 2015 – 2025 (US$ Mn)
Table 19: Europe Standard Logic Devices Market Size Forecast, By Switches and Multiplexer Type, 2015 – 2025 (US$ Mn)
Table 20: Europe Standard Logic Devices Market Size Forecast, By Register Type, 2015 – 2025 (US$ Mn)
Table 21: Europe Standard Logic Devices Market Size Forecast, By Country, 2015–2025 (US$ Mn)
Table 22: Asia Pacific Standard Logic Devices Market Forecast, By Gate IC Type, 2015 – 2025 (US$ Mn)
Table 23: Asia Pacific Standard Logic Devices Market Size Forecast, By Buffer/Driver Type, 2015 – 2025 (US$ Mn)
Table 24: Asia Pacific Standard Logic Devices Market Size Forecast, By Transceiver Type, 2015 – 2025 (US$ Mn)
Table 25: Asia Pacific Standard Logic Devices Market Size Forecast, By Flip flop Type, 2015 – 2025 (US$ Mn)
Table 26: Asia Pacific Standard Logic Devices Market Size Forecast, By Switches and Multiplexer Type, 2015 – 2025 (US$ Mn)
Table 27: Asia Pacific Standard Logic Devices Market Size Forecast, By Register Type, 2015 – 2025 (US$ Mn)
Table 28: Asia Pacific Standard Logic Devices Market Size Forecast, By Country, 2015–2025 (US$ Mn)
Table 29: Middle East & Africa Standard Logic Devices Market Forecast, By Gate IC Type, 2015 – 2025 (US$ Mn)
Table 30: Middle East & Africa Standard Logic Devices Market Size Forecast, By Buffer/Driver Type, 2015 – 2025 (US$ Mn)
Table 31: Middle East & Africa Standard Logic Devices Market Size Forecast, By Transceiver Type, 2015 – 2025 (US$ Mn)
Table 32: Middle East & Africa Standard Logic Devices Market Size Forecast, By Flip flop Type, 2015 – 2025 (US$ Mn)
Table 33: Middle East & Africa Standard Logic Devices Market Size Forecast, By Switches and Multiplexer Type, 2015 – 2025 (US$ Mn)
Table 34: Middle East & Africa Standard Logic Devices Market Size Forecast, By Register Type, 2015 – 2025 (US$ Mn)
Table 35: Middle East & Africa Standard Logic Devices Market Size Forecast, By Country, 2015–2025 (US$ Mn)
Table 36: South America Standard Logic Devices Market Forecast, By Gate IC Type, 2015 – 2025 (US$ Mn)
Table 37: South America Standard Logic Devices Market Size Forecast, By Buffer/Driver Type, 2015 – 2025 (US$ Mn)
Table 38: South America Standard Logic Devices Market Size Forecast, By Transceiver Type, 2015 – 2025 (US$ Mn)
Table 39: South America Standard Logic Devices Market Size Forecast, By Flip flop Type, 2015 – 2025 (US$ Mn)
Table 40: South America Standard Logic Devices Market Size Forecast, By Switches and Multiplexer Type, 2015 – 2025 (US$ Mn)
Table 41: South America Standard Logic Devices Market Size Forecast, By Register Type, 2015 – 2025 (US$ Mn)
Table 42: South America Standard Logic Devices Market Size Forecast, By Country, 2015–2025 (US$ Mn)
List of Figures
Figure 1: Global Standard Logic Devices Market
Figure 2: Global Standard Logic Devices Market Revenue Size Forecast, 2015–2025 (US$ Mn)
Figure 3: Global Standard Logic Devices Market Y-o-Y Growth (%), 2016–2025
Figure 4: Market Revenue Share By Gate IC Type (2017)
Figure 5: Market Revenue Share By Flip-Flop/Latches Type (2017)
Figure 6: Market Revenue Share By Switches and Multiplexer Type (2017)
Figure 7: Market Revenue Share By Region (2017)
Figure 8: Global Standard Logic Devices Market Value Share Analysis, By Gate IC Type, 2017 and 2025
Figure 9: Standard Logic Devices Market, By Gate IC Type, OR
Figure 10: Standard Logic Devices Market, By Gate IC Type, AND
Figure 11: Standard Logic Devices Market, By Gate IC Type, Universal Gates
Figure 12: Standard Logic Devices Market, By Gate IC Type, EXOR
Figure 13: Standard Logic Devices Market, By Gate IC Type, EXNOR
Figure 14: Standard Logic Devices Market Comparison Matrix, By Gate IC Type
Figure 15: Standard Logic Devices Market Attractiveness Analysis, By Gate IC Type
Figure 16: Global Standard Logic Devices Market Value Share Analysis, By Buffer/Driver Type, 2017 and 2025
Figure 17: Standard Logic Devices Market, By Buffer/Driver Type, Inverting
Figure 18: Standard Logic Devices Market, By Buffer/Driver Type, Non-inverting
Figure 19: Standard Logic Devices Market Comparison Matrix, By Buffer/Driver Type
Figure 20: Standard Logic Devices Market Attractiveness Analysis, By Buffer/Driver Type
Figure 21: Global Standard Logic Devices Market Value Share Analysis, By Transceiver Type, 2017 and 2025
Figure 22: Standard Logic Devices Market, By Transceiver Type, Standard
Figure 23: Standard Logic Devices Market, By Transceiver Type, Parity
Figure 24: Standard Logic Devices Market, By Transceiver Type, Registered
Figure 25: Standard Logic Devices Market Comparison Matrix, By Transceiver Type
Figure 26: Standard Logic Devices Market Attractiveness Analysis, By Transceiver Type
Figure 27: Global Standard Logic Devices Market Value Share Analysis, By Flip flop Type, 2017 and 2025
Figure 28: Standard Logic Devices Market, By Flip flop Type, SR Flip Flop
Figure 29: Standard Logic Devices Market, By Flip flop Type, D Flip Flop
Figure 30: Standard Logic Devices Market, By Flip flop Type, JK Flip Flop
Figure 31: Standard Logic Devices Market, By Flip flop Type, T Flip Flop
Figure 32: Standard Logic Devices Market Comparison Matrix, By Flip flop Type
Figure 33: Standard Logic Devices Market Attractiveness Analysis, By Flip flop Type
Figure 34: Global Standard Logic Devices Market Value Share Analysis, By Switches and Multiplexer Type, 2017 and 2025
Figure 35: Standard Logic Devices Market, By Switches and Multiplexer Type, Analog
Figure 36: Standard Logic Devices Market, By Switches and Multiplexer Type, Buffered
Figure 37: Standard Logic Devices Market, By Switches and Multiplexer Type, Protocol Specific
Figure 38: Standard Logic Devices Market Comparison Matrix, By Switches and Multiplexer Type
Figure 39: Standard Logic Devices Market Attractiveness Analysis, By Switches and Multiplexer Type
Figure 40: Global Standard Logic Devices Market Value Share Analysis, By Register Type, 2017 and 2025
Figure 41: Standard Logic Devices Market, By Register Type, Storage Register
Figure 42: Standard Logic Devices Market, By Register Type, Shift Register
Figure 43: Standard Logic Devices Market Comparison Matrix, By Register Type
Figure 44: Standard Logic Devices Market Attractiveness Analysis, By Register Type
Figure 45: Standard Logic Devices Market Analysis, By Region, North America
Figure 46: Standard Logic Devices Market Analysis, By Region, Europe
Figure 47: Standard Logic Devices Market Analysis, By Region, Asia Pacific
Figure 48: Standard Logic Devices Market Analysis, By Region, Middle East and Africa
Figure 49: Standard Logic Devices Market Analysis, By Region, South America
Figure 50: Standard Logic Devices Market Attractiveness Analysis, By Region
Figure 51: North America Standard Logic Devices Market Value Share Analysis, By Gate IC Type, 2017 and 2025
Figure 52: North America Standard Logic Devices Market Value Share Analysis, By Buffer/Driver Type, 2017 and 2025
Figure 53: North America Standard Logic Devices Market Value Share Analysis, By Transceiver Type, 2017 and 2025
Figure 54: North America Standard Logic Devices Market Value Share Analysis, By Flip flop Type, 2017 and 2025
Figure 55: North America Standard Logic Devices Market Value Share Analysis, By Switches and Multiplexer Type, 2017 and 2025
Figure 56: North America Standard Logic Devices Market Value Share Analysis, By Register Type, 2017 and 2025
Figure 57: North America Standard Logic Devices Market Value Share Analysis, By Country, 2017 and 2025
Figure 59: North America Standard Logic Devices Market Attractiveness Analysis, By Gate IC Type
Figure 60: North America Standard Logic Devices Market Attractiveness Analysis, By Transceiver Type
Figure 61: North America Standard Logic Devices Market Attractiveness Analysis, By Switches and Multiplexer Type
Figure 62: North America Standard Logic Devices Market Attractiveness Analysis, By Registers Type
Figure 63: North America Standard Logic Devices Market Attractiveness Analysis, By Flip-Flop/Latches Type
Figure 64: North America Standard Logic Devices Market Attractiveness Analysis, By Country
Figure 65: Europe Standard Logic Devices Market Value Share Analysis, By Gate IC Type, 2017 and 2025
Figure 66: Europe Standard Logic Devices Market Value Share Analysis, By Buffer/Driver Type, 2017 and 2025
Figure 67: Europe Standard Logic Devices Market Value Share Analysis, By Transceiver Type, 2017 and 2025
Figure 68: Europe Standard Logic Devices Market Value Share Analysis, By Flip flop Type, 2017 and 2025
Figure 69: Europe Standard Logic Devices Market Value Share Analysis, By Switches and Multiplexer Type, 2017 and 2025
Figure 70: Europe Standard Logic Devices Market Value Share Analysis, By Register Type, 2017 and 2025
Figure 71: Europe Standard Logic Devices Market Value Share Analysis, By Country, 2017 and 2025
Figure 72: Europe Standard Logic Devices Market Attractiveness Analysis, By Buffer/Driver
Figure 73: Europe Standard Logic Devices Market Attractiveness Analysis, By Gate IC Type
Figure 74: Europe Standard Logic Devices Market Attractiveness Analysis, By Transceiver Type
Figure 75: Europe Standard Logic Devices Market Attractiveness Analysis, By Switches and Multiplexer Type
Figure 76: Europe Standard Logic Devices Market Attractiveness Analysis, By Registers Type
Figure 77: Europe Standard Logic Devices Market Attractiveness Analysis, By Flip-Flop/Latches Type
Figure 78: Europe Standard Logic Devices Market Attractiveness Analysis, By Country
Figure 79: Asia Pacific Standard Logic Devices Market Value Share Analysis, By Gate IC Type, 2017 and 2025
Figure 80: Asia Pacific Standard Logic Devices Market Value Share Analysis, By Buffer/Driver Type, 2017 and 2025
Figure 81: Asia Pacific Standard Logic Devices Market Value Share Analysis, By Transceiver Type, 2017 and 2025
Figure 82: Asia Pacific Standard Logic Devices Market Value Share Analysis, By Flip flop Type, 2017 and 2025
Figure 83: Asia Pacific Standard Logic Devices Market Value Share Analysis, By Switches and Multiplexer Type, 2017 and 2025
Figure 84: Asia Pacific Standard Logic Devices Market Value Share Analysis, By Register Type, 2017 and 2025
Figure 85: Asia Pacific Standard Logic Devices Market Value Share Analysis, By Country, 2017 and 2025
Figure 86: Asia Pacific Standard Logic Devices Market Attractiveness Analysis, By Buffer/Driver
Figure 87: Asia Pacific Standard Logic Devices Market Attractiveness Analysis, By Gate IC Type
Figure 88: Asia Pacific Standard Logic Devices Market Attractiveness Analysis, By Transceiver Type
Figure 89: Asia Pacific Standard Logic Devices Market Attractiveness Analysis, By Switches and Multiplexer Type
Figure 90: Asia Pacific Standard Logic Devices Market Attractiveness Analysis, By Registers Type
Figure 91: Asia Pacific Standard Logic Devices Market Attractiveness Analysis, By Flip-Flop/Latches Type
Figure 92: Asia Pacific Standard Logic Devices Market Attractiveness Analysis, By Country
Figure 93: Middle East & Africa Standard Logic Devices Market Value Share Analysis, By Gate IC Type, 2017 and 2025
Figure 94: Middle East & Africa Standard Logic Devices Market Value Share Analysis, By Buffer/Driver Type, 2017 and 2025
Figure 95: Middle East & Africa Standard Logic Devices Market Value Share Analysis, By Transceiver Type, 2017 and 2025
Figure 96: Middle East & Africa Standard Logic Devices Market Value Share Analysis, By Flip flop Type, 2017 and 2025
Figure 97: Middle East & Africa Standard Logic Devices Market Value Share Analysis, By Switches and Multiplexer Type, 2017 and 2025
Figure 98: Middle East & Africa Standard Logic Devices Market Value Share Analysis, By Register Type, 2017 and 2025
Figure 99: Middle East & Africa Standard Logic Devices Market Value Share Analysis, By Country, 2017 and 2025
Figure 100: Middle East & Africa Standard Logic Devices Market Attractiveness Analysis, By Buffer/Driver
Figure 101: Middle East & Africa Standard Logic Devices Market Attractiveness Analysis, By Gate IC Type
Figure 102: Middle East & Africa Standard Logic Devices Market Attractiveness Analysis, By Transceiver Type
Figure 103: Middle East & Africa Standard Logic Devices Market Attractiveness Analysis, By Switches and Multiplexer Type
Figure 104: Middle East & Africa Standard Logic Devices Market Attractiveness Analysis, By Registers Type
Figure 105: Middle East & Africa Standard Logic Devices Market Attractiveness Analysis, By Flip-Flop/Latches Type
Figure 106: Middle East & Africa Standard Logic Devices Market Attractiveness Analysis, By Country
Figure 107: South America Standard Logic Devices Market Value Share Analysis, By Gate IC Type, 2017 and 2025
Figure 108: South America Standard Logic Devices Market Value Share Analysis, By Buffer/Driver Type, 2017 and 2025
Figure 109: South America Standard Logic Devices Market Value Share Analysis, By Transceiver Type, 2017 and 2025
Figure 110: South America Standard Logic Devices Market Value Share Analysis, By Flip flop Type, 2017 and 2025
Figure 111: South America Standard Logic Devices Market Value Share Analysis, By Switches and Multiplexer Type, 2017 and 2025
Figure 112: South America Standard Logic Devices Market Value Share Analysis, By Register Type, 2017 and 2025
Figure 113: South America Standard Logic Devices Market Value Share Analysis, By Country, 2017 and 2025
Figure 114: South America Standard Logic Devices Market Attractiveness Analysis, By Buffer/Driver
Figure 115: South America Standard Logic Devices Market Attractiveness Analysis, By Gate IC Type
Figure 116: South America Standard Logic Devices Market Attractiveness Analysis, By Transceiver Type
Figure 117: South America Standard Logic Devices Market Attractiveness Analysis, By Switches and Multiplexer Type
Figure 118: South America Standard Logic Devices Market Attractiveness Analysis, By Registers Type
Figure 119: South America Standard Logic Devices Market Attractiveness Analysis, By Flip-Flop/Latches Type
Figure 120: South America Standard Logic Devices Market Attractiveness Analysis, By Country
Figure 121: Global Standard Logic Devices Market Share Analysis (2016)
Copyright © Transparency Market Research, Inc. All Rights reserved
Trust Online


Standard Logic Devices Market Trends