
The global pressure sensitive labels market has made rapid progress in recent years thanks to the growth of the global retail sector and the food and beverage industry, which have become dominant consumers for the pressure sensitive labels market. Pressure sensitive labels, also called adhesive-backed labels, are used in a wide variety of applications due to their ease of use and the ease they provide in incorporating other technologies such as barcodes into their design, which makes them easy to incorporate into the day-to-day functioning of industries. The ease of incorporating branding material in the design of pressure sensitive labels has also driven their adoption in various sectors and is likely to remain a key driver for the global market in the coming years.
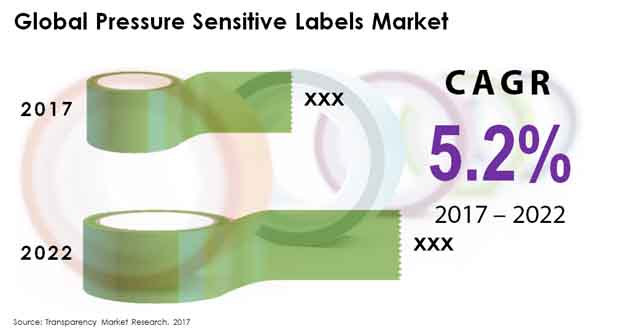
The global pressure sensitive labels market was valued at US$86.8 bn in 2017. According to Transparency Market Research, the global pressure sensitive labels market is likely to exhibit a 5.2% CAGR over the 2017-2022 forecast period and emerge with a valuation of US$112 bn by 2022.
One of the major drivers for the global pressure sensitive labels market is the steady growth of the logistics sector in recent years, as well as the rapid subsequent growth of the transportation industry. Logistics has become vital due to the growing adoption of long-distance shipping chains and the need to multiply sales outlets. The pressure sensitive labels market has gained significantly from this trend due to the ease of applying pressure sensitive labels and garner consumer interest. The ease of delivering product information in an attractive format is likely to drive demand for pressure sensitive labels from the logistics and transportation sector in the coming years.
Growth of the food and beverage industry is likely to be vital for the pressure sensitive labels market. The growing use of food packaging technology in order to facilitate long-distance shipping has made pressure sensitive labels absolutely vital to the food and beverage sector, as they provide the means to incorporate product information, regulatory information, as well as identification data such as barcodes on packaged food.
Of the various materials used to produce pressure sensitive labels, paper is likely to remain in demand over the coming years due to the convenience of printing paper sheets in various designs. Paper accounted for 42.7% of the global pressure sensitive labels market in 2017, with the segment valued at more than US$37 bn. According to Transparency Market Research, the paper pressure sensitive labels market is likely to exhibit a strong 4.7% CAGR in the 2017-2022 forecast period to rise to a valuation of US$46.6 bn.
Geographically, the global pressure sensitive labels market is likely to be dominated by demand from emerging economies in Southeast Asia. Countries such as China, India, South Korea, Malaysia, Indonesia, and Taiwan, where urban development is being carried out at a rapid rate and the local economy is subsequently expanding at robust rates, the pressure sensitive labels industry is likely to be boosted by the growing demand for transportation options. The growing retail sector in these countries, thanks to the rising disposable income of consumers in this region, is also likely to lead to a rise in the demand from the pressure sensitive labels market in Asia Pacific except Japan. APEJ accounted for 33.5% of the global pressure sensitive labels market in 2017 and is likely to consistently remain a leading contributor over the 2017-2022 forecast period.
Major players in the global pressure sensitive labels market include Avery Dennison Corporation, Henkel, CCL Label Inc., Lintec, Constantia Flexibles Group GmbH, Coveris Holdings SA, 3M, Inland Labels, Fuji Seal International, Inc., and UPM-Raflatac.
1. Global Pressure Sensitive Labels Market - Executive Summary
2. Global Pressure Sensitive Labels Market Overview
2.1. Introduction
2.1.1. Global Pressure Sensitive Labels Market Taxonomy
2.1.2. Global Pressure Sensitive Labels Market Definition
2.2. Global Pressure Sensitive Labels Market Size (US$ Mn) and Forecast, 2012-2022
2.2.1. Global Pressure Sensitive Labels Market Y-o-Y Growth
2.3. Global Pressure Sensitive Labels Market Dynamics
2.4. Cost Structure Analysis
2.5. Per Capita Label Consumption
2.6. Functional and Smart Labeling
2.7. New Labeling and Stock Materials
2.8. Strategic Focus of Players
2.9. Key Participants Market Presence (Intensity Map) By Region
3. Global Pressure Sensitive Labels Market Analysis and Forecast By Face Stock Material
3.1. Global Pressure Sensitive Labels Market Size and Forecast By Face Stock Material, 2012-2022
3.1.1. Paper Pressure Sensitive Labels Market Size and Forecast, 2012-2022
3.1.1.1. Revenue (US$ Mn) Comparison, By Region
3.1.1.2. Market Share Comparison, By Region
3.1.1.3. Y-o-Y growth Comparison, By Region
3.1.2. Polypropylene Pressure Sensitive Labels Market Size and Forecast, 2012-2022
3.1.2.1. Revenue (US$ Mn) Comparison, By Region
3.1.2.2. Market Share Comparison, By Region
3.1.2.3. Y-o-Y growth Comparison, By Region
3.1.3. polyethylene Pressure Sensitive Labels Market Size and Forecast, 2012-2022
3.1.3.1. Revenue (US$ Mn) Comparison, By Region
3.1.3.2. Market Share Comparison, By Region
3.1.3.3. Y-o-Y growth Comparison, By Region
3.1.4. PET Pressure Sensitive Labels Market Size and Forecast, 2012-2022
3.1.4.1. Revenue (US$ Mn) Comparison, By Region
3.1.4.2. Market Share Comparison, By Region
3.1.4.3. Y-o-Y growth Comparison, By Region
4. Global Pressure Sensitive Labels Market Analysis and Forecast By Label Type
4.1. Global Pressure Sensitive Labels Market Size and Forecast By Label Type, 2012-2022
4.1.1. Permanent Label Pressure Sensitive Labels Market Size and Forecast, 2012-2022
4.1.1.1. Revenue (US$ Mn) Comparison, By Region
4.1.1.2. Market Share Comparison, By Region
4.1.1.3. Y-o-Y growth Comparison, By Region
4.1.2. Removable Label Pressure Sensitive Labels Market Size and Forecast, 2012-2022
4.1.2.1. Revenue (US$ Mn) Comparison, By Region
4.1.2.2. Market Share Comparison, By Region
4.1.2.3. Y-o-Y growth Comparison, By Region
5. Global Pressure Sensitive Labels Market Analysis and Forecast By Application Sector
5.1. Global Pressure Sensitive Labels Market Size and Forecast By Application Sector, 2012-2022
5.1.1. Food & Beverage Pressure Sensitive Labels Market Size and Forecast, 2012-2022
5.1.1.1. Revenue (US$ Mn) Comparison, By Region
5.1.1.2. Market Share Comparison, By Region
5.1.1.3. Y-o-Y growth Comparison, By Region
5.1.2. Pharmaceutical Pressure Sensitive Labels Market Size and Forecast, 2012-2022
5.1.2.1. Revenue (US$ Mn) Comparison, By Region
5.1.2.2. Market Share Comparison, By Region
5.1.2.3. Y-o-Y growth Comparison, By Region
5.1.3. Tracking, Logistics and Transportation Pressure Sensitive Labels Market Size and Forecast, 2012-2022
5.1.3.1. Revenue (US$ Mn) Comparison, By Region
5.1.3.2. Market Share Comparison, By Region
5.1.3.3. Y-o-Y growth Comparison, By Region
5.1.4. Home & Personal Care Pressure Sensitive Labels Market Size and Forecast, 2012-2022
5.1.4.1. Revenue (US$ Mn) Comparison, By Region
5.1.4.2. Market Share Comparison, By Region
5.1.4.3. Y-o-Y growth Comparison, By Region
5.1.5. Semiconductor & Electronics Pressure Sensitive Labels Market Size and Forecast, 2012-2022
5.1.5.1. Revenue (US$ Mn) Comparison, By Region
5.1.5.2. Market Share Comparison, By Region
5.1.5.3. Y-o-Y growth Comparison, By Region
5.1.6. Retail Labels Pressure Sensitive Labels Market Size and Forecast, 2012-2022
5.1.6.1. Revenue (US$ Mn) Comparison, By Region
5.1.6.2. Market Share Comparison, By Region
5.1.6.3. Y-o-Y growth Comparison, By Region
5.1.7. Other Products Pressure Sensitive Labels Market Size and Forecast, 2012-2022
5.1.7.1. Revenue (US$ Mn) Comparison, By Region
5.1.7.2. Market Share Comparison, By Region
5.1.7.3. Y-o-Y growth Comparison, By Region
6. Global Pressure Sensitive Labels Market Analysis and Forecast By Region
6.1. Global Pressure Sensitive Labels Market Size and Forecast, 2012-2022
6.1.1. North America Pressure Sensitive Labels Market Size and Forecast, 2012-2022
6.1.1.1. Revenue (US$ Mn) Comparison, By Face Stock Material
6.1.1.2. Revenue (US$ Mn) Comparison, By Label Type
6.1.1.3. Revenue (US$ Mn) Comparison, By Application Sector
6.1.2. Latin America Pressure Sensitive Labels Market Size and Forecast, 2012-2022
6.1.2.1. Revenue (US$ Mn) Comparison, By Face Stock Material
6.1.2.2. Revenue (US$ Mn) Comparison, By Label Type
6.1.2.3. Revenue (US$ Mn) Comparison, By Application Sector
6.1.3. Europe Pressure Sensitive Labels Market Size and Forecast, 2012-2022
6.1.3.1. Revenue (US$ Mn) Comparison, By Face Stock Material
6.1.3.2. Revenue (US$ Mn) Comparison, By Label Type
6.1.3.3. Revenue (US$ Mn) Comparison, By Application Sector
6.1.4. Japan Pressure Sensitive Labels Market Size and Forecast, 2012-2022
6.1.4.1. Revenue (US$ Mn) Comparison, By Face Stock Material
6.1.4.2. Revenue (US$ Mn) Comparison, By Label Type
6.1.4.3. Revenue (US$ Mn) Comparison, By Application Sector
6.1.5. APEJ Pressure Sensitive Labels Market Size and Forecast, 2012-2022
6.1.5.1. Revenue (US$ Mn) Comparison, By Face Stock Material
6.1.5.2. Revenue (US$ Mn) Comparison, By Label Type
6.1.5.3. Revenue (US$ Mn) Comparison, By Application Sector
6.1.6. MEA Pressure Sensitive Labels Market Size and Forecast, 2012-2022
6.1.6.1. Revenue (US$ Mn) Comparison, By Face Stock Material
6.1.6.2. Revenue (US$ Mn) Comparison, By Label Type
6.1.6.3. Revenue (US$ Mn) Comparison, By Application Sector
7. North America Pressure Sensitive Labels Market Analysis and Forecast, By Country, 2012-2022
7.1. US Pressure Sensitive Labels Market Size and Forecast, 2012-2022
7.1.1. Revenue (US$ Mn) Comparison, By Face Stock Material
7.1.2. Revenue (US$ Mn) Comparison, By Label Type
7.1.3. Revenue (US$ Mn) Comparison, By Application Sector
7.2. Canada Pressure Sensitive Labels Market Size and Forecast, 2012-2022
7.2.1. Revenue (US$ Mn) Comparison, By Face Stock Material
7.2.2. Revenue (US$ Mn) Comparison, By Label Type
7.2.3. Revenue (US$ Mn) Comparison, By Application Sector
8. Latin America Pressure Sensitive Labels Market Analysis and Forecast, By Country, 2012-2022
8.1. Brazil Pressure Sensitive Labels Market Size and Forecast, 2012-2022
8.1.1. Revenue (US$ Mn) Comparison, By Face Stock Material
8.1.2. Revenue (US$ Mn) Comparison, By Label Type
8.1.3. Revenue (US$ Mn) Comparison, By Application Sector
8.2. Mexico Pressure Sensitive Labels Market Size and Forecast, 2012-2022
8.2.1. Revenue (US$ Mn) Comparison, By Face Stock Material
8.2.2. Revenue (US$ Mn) Comparison, By Label Type
8.2.3. Revenue (US$ Mn) Comparison, By Application Sector
8.3. Argentina Pressure Sensitive Labels Market Size and Forecast, 2012-2022
8.3.1. Revenue (US$ Mn) Comparison, By Face Stock Material
8.3.2. Revenue (US$ Mn) Comparison, By Label Type
8.3.3. Revenue (US$ Mn) Comparison, By Application Sector
9. Europe Pressure Sensitive Labels Market Analysis and Forecast, By Country, 2012-2022
9.1. Germany Pressure Sensitive Labels Market Size and Forecast, 2012-2022
9.1.1. Revenue (US$ Mn) Comparison, By Face Stock Material
9.1.2. Revenue (US$ Mn) Comparison, By Label Type
9.1.3. Revenue (US$ Mn) Comparison, By Application Sector
9.2. UK Pressure Sensitive Labels Market Size and Forecast, 2012-2022
9.2.1. Revenue (US$ Mn) Comparison, By Face Stock Material
9.2.2. Revenue (US$ Mn) Comparison, By Label Type
9.2.3. Revenue (US$ Mn) Comparison, By Application Sector
9.3. France Pressure Sensitive Labels Market Size and Forecast, 2012-2022
9.3.1. Revenue (US$ Mn) Comparison, By Face Stock Material
9.3.2. Revenue (US$ Mn) Comparison, By Label Type
9.3.3. Revenue (US$ Mn) Comparison, By Application Sector
9.4. Spain Pressure Sensitive Labels Market Size and Forecast, 2012-2022
9.4.1. Revenue (US$ Mn) Comparison, By Face Stock Material
9.4.2. Revenue (US$ Mn) Comparison, By Label Type
9.4.3. Revenue (US$ Mn) Comparison, By Application Sector
9.5. Italy Pressure Sensitive Labels Market Size and Forecast, 2012-2022
9.5.1. Revenue (US$ Mn) Comparison, By Face Stock Material
9.5.2. Revenue (US$ Mn) Comparison, By Label Type
9.5.3. Revenue (US$ Mn) Comparison, By Application Sector
9.6. Nordic Pressure Sensitive Labels Market Size and Forecast, 2012-2022
9.6.1. Revenue (US$ Mn) Comparison, By Face Stock Material
9.6.2. Revenue (US$ Mn) Comparison, By Label Type
9.6.3. Revenue (US$ Mn) Comparison, By Application Sector
10. Japan Pressure Sensitive Labels Market Analysis and Forecast, By Country, 2012-2022
10.1. Japan Pressure Sensitive Labels Market Size and Forecast, 2012-2022
10.1.1. Revenue (US$ Mn) Comparison, By Face Stock Material
10.1.2. Revenue (US$ Mn) Comparison, By Label Type
10.1.3. Revenue (US$ Mn) Comparison, By Application Sector
11. APEJ Pressure Sensitive Labels Market Analysis and Forecast, By Country, 2012-2022
11.1. China Pressure Sensitive Labels Market Size and Forecast, 2012-2022
11.1.1. Revenue (US$ Mn) Comparison, By Face Stock Material
11.1.2. Revenue (US$ Mn) Comparison, By Label Type
11.1.3. Revenue (US$ Mn) Comparison, By Application Sector
11.2. India Pressure Sensitive Labels Market Size and Forecast, 2012-2022
11.2.1. Revenue (US$ Mn) Comparison, By Face Stock Material
11.2.2. Revenue (US$ Mn) Comparison, By Label Type
11.2.3. Revenue (US$ Mn) Comparison, By Application Sector
11.3. Malaysia Pressure Sensitive Labels Market Size and Forecast, 2012-2022
11.3.1. Revenue (US$ Mn) Comparison, By Face Stock Material
11.3.2. Revenue (US$ Mn) Comparison, By Label Type
11.3.3. Revenue (US$ Mn) Comparison, By Application Sector
11.4. Thailand Pressure Sensitive Labels Market Size and Forecast, 2012-2022
11.4.1. Revenue (US$ Mn) Comparison, By Face Stock Material
11.4.2. Revenue (US$ Mn) Comparison, By Label Type
11.4.3. Revenue (US$ Mn) Comparison, By Application Sector
11.5. Singapore Pressure Sensitive Labels Market Size and Forecast, 2012-2022
11.5.1. Revenue (US$ Mn) Comparison, By Face Stock Material
11.5.2. Revenue (US$ Mn) Comparison, By Label Type
11.5.3. Revenue (US$ Mn) Comparison, By Application Sector
11.6. Australia Pressure Sensitive Labels Market Size and Forecast, 2012-2022
11.6.1. Revenue (US$ Mn) Comparison, By Face Stock Material
11.6.2. Revenue (US$ Mn) Comparison, By Label Type
11.6.3. Revenue (US$ Mn) Comparison, By Application Sector
12. MEA Pressure Sensitive Labels Market Analysis and Forecast, By Country, 2012-2022
12.1. GCC Countries Pressure Sensitive Labels Market Size and Forecast, 2012-2022
12.1.1. Revenue (US$ Mn) Comparison, By Face Stock Material
12.1.2. Revenue (US$ Mn) Comparison, By Label Type
12.1.3. Revenue (US$ Mn) Comparison, By Application Sector
12.2. South Africa Pressure Sensitive Labels Market Size and Forecast, 2012-2022
12.2.1. Revenue (US$ Mn) Comparison, By Face Stock Material
12.2.2. Revenue (US$ Mn) Comparison, By Label Type
12.2.3. Revenue (US$ Mn) Comparison, By Application Sector
12.3. Turkey Pressure Sensitive Labels Market Size and Forecast, 2012-2022
12.3.1. Revenue (US$ Mn) Comparison, By Face Stock Material
12.3.2. Revenue (US$ Mn) Comparison, By Label Type
12.3.3. Revenue (US$ Mn) Comparison, By Application Sector
12.4. Israel Pressure Sensitive Labels Market Size and Forecast, 2012-2022
12.4.1. Revenue (US$ Mn) Comparison, By Face Stock Material
12.4.2. Revenue (US$ Mn) Comparison, By Label Type
12.4.3. Revenue (US$ Mn) Comparison, By Application Sector
13. Global Pressure Sensitive Labels Market Company Share, Competition Landscape and Company Profiles
13.1. Company Share Analysis
13.2. Competition Landscape
13.3. Company Profiles
13.3.1. Avery Dennison Corporation
13.3.2. Coveris Holdings S.A.
13.3.3. CCL Label, Inc.
13.3.4. Constantia Flexibles Group GmbH
13.3.5. Henkel
13.3.6. Lintec
13.3.7. Inland Labels
13.3.8. 3M
13.3.9. UPM-Raflatac
13.3.10. Fuji Seal International, Inc.
14. Research Methodology
15. Secondary and Primary Sources
16. Assumptions and Acronyms
17. Disclaimer
List of Tables
TABLE 1 Global Pressure Sensitive Labels Market Value (US$ Mn), 2012-2016
TABLE 2 Global Pressure Sensitive Labels Market Value (US$ Mn), 2017-2022
TABLE 3 Global Pressure Sensitive Labels Market Value (US$ Mn) and Y-o-Y, 2015-2022
TABLE 4 Global Paper Segment Value (US$ Mn), By Region 2012-2016
TABLE 5 Global Paper Segment Value (US$ Mn), By Region 2017-2022
TABLE 6 Global Paper Segment Market Share, By Region 2012-2016
TABLE 7 Global Paper Segment Market Share, By Region 2017-2022
TABLE 8 Global Paper Segment Y-o-Y, By Region 2015-2022
TABLE 9 Global Polypropylene Segment Value (US$ Mn), By Region 2012-2016
TABLE 10 Global Polypropylene Segment Value (US$ Mn), By Region 2017-2022
TABLE 11 Global Polypropylene Segment Market Share, By Region 2012-2016
TABLE 12 Global Polypropylene Segment Market Share, By Region 2017-2022
TABLE 13 Global Polypropylene Segment Y-o-Y, By Region 2015-2022
TABLE 14 Global polyethylene Segment Value (US$ Mn), By Region 2012-2016
TABLE 15 Global polyethylene Segment Value (US$ Mn), By Region 2017-2022
TABLE 16 Global polyethylene Segment Market Share, By Region 2012-2016
TABLE 17 Global polyethylene Segment Market Share, By Region 2017-2022
TABLE 18 Global polyethylene Segment Y-o-Y, By Region 2015-2022
TABLE 19 Global PET Segment Value (US$ Mn), By Region 2012-2016
TABLE 20 Global PET Segment Value (US$ Mn), By Region 2017-2022
TABLE 21 Global PET Segment Market Share, By Region 2012-2016
TABLE 22 Global PET Segment Market Share, By Region 2017-2022
TABLE 23 Global PET Segment Y-o-Y, By Region 2015-2022
TABLE 24 Global Permanent Label Segment Value (US$ Mn), By Region 2012-2016
TABLE 25 Global Permanent Label Segment Value (US$ Mn), By Region 2017-2022
TABLE 26 Global Permanent Label Segment Market Share, By Region 2012-2016
TABLE 27 Global Permanent Label Segment Market Share, By Region 2017-2022
TABLE 28 Global Permanent Label Segment Y-o-Y, By Region 2015-2022
TABLE 29 Global Removable Label Segment Value (US$ Mn), By Region 2012-2016
TABLE 30 Global Removable Label Segment Value (US$ Mn), By Region 2017-2022
TABLE 31 Global Removable Label Segment Market Share, By Region 2012-2016
TABLE 32 Global Removable Label Segment Market Share, By Region 2017-2022
TABLE 33 Global Removable Label Segment Y-o-Y, By Region 2015-2022
TABLE 34 Global Food & Beverage Segment Value (US$ Mn), By Region 2012-2016
TABLE 35 Global Food & Beverage Segment Value (US$ Mn), By Region 2017-2022
TABLE 36 Global Food & Beverage Segment Market Share, By Region 2012-2016
TABLE 37 Global Food & Beverage Segment Market Share, By Region 2017-2022
TABLE 38 Global Food & Beverage Segment Y-o-Y, By Region 2015-2022
TABLE 39 Global Pharmaceutical Segment Value (US$ Mn), By Region 2012-2016
TABLE 40 Global Pharmaceutical Segment Value (US$ Mn), By Region 2017-2022
TABLE 41 Global Pharmaceutical Segment Market Share, By Region 2012-2016
TABLE 42 Global Pharmaceutical Segment Market Share, By Region 2017-2022
TABLE 43 Global Pharmaceutical Segment Y-o-Y, By Region 2015-2022
TABLE 44 Global Tracking, Logistics and Transportation Segment Value (US$ Mn), By Region 2012-2016
TABLE 45 Global Tracking, Logistics and Transportation Segment Value (US$ Mn), By Region 2017-2022
TABLE 46 Global Tracking, Logistics and Transportation Segment Market Share, By Region 2012-2016
TABLE 47 Global Tracking, Logistics and Transportation Segment Market Share, By Region 2017-2022
TABLE 48 Global Tracking, Logistics and Transportation Segment Y-o-Y, By Region 2015-2022
TABLE 49 Global Home & Personal Care Segment Value (US$ Mn), By Region 2012-2016
TABLE 50 Global Home & Personal Care Segment Value (US$ Mn), By Region 2017-2022
TABLE 51 Global Home & Personal Care Segment Market Share, By Region 2012-2016
TABLE 52 Global Home & Personal Care Segment Market Share, By Region 2017-2022
TABLE 53 Global Home & Personal Care Segment Y-o-Y, By Region 2015-2022
TABLE 54 Global Semiconductor & Electronics Segment Value (US$ Mn), By Region 2012-2016
TABLE 55 Global Semiconductor & Electronics Segment Value (US$ Mn), By Region 2017-2022
TABLE 56 Global Semiconductor & Electronics Segment Market Share, By Region 2012-2016
TABLE 57 Global Semiconductor & Electronics Segment Market Share, By Region 2017-2022
TABLE 58 Global Semiconductor & Electronics Segment Y-o-Y, By Region 2015-2022
TABLE 59 Global Retail Labels Segment Value (US$ Mn), By Region 2012-2016
TABLE 60 Global Retail Labels Segment Value (US$ Mn), By Region 2017-2022
TABLE 61 Global Retail Labels Segment Market Share, By Region 2012-2016
TABLE 62 Global Retail Labels Segment Market Share, By Region 2017-2022
TABLE 63 Global Retail Labels Segment Y-o-Y, By Region 2015-2022
TABLE 64 Global Other Products Segment Value (US$ Mn), By Region 2012-2016
TABLE 65 Global Other Products Segment Value (US$ Mn), By Region 2017-2022
TABLE 66 Global Other Products Segment Market Share, By Region 2012-2016
TABLE 67 Global Other Products Segment Market Share, By Region 2017-2022
TABLE 68 Global Other Products Segment Y-o-Y, By Region 2015-2022
TABLE 69 North America Pressure Sensitive Labels Market Value (US$ Mn), By Face Stock Material 2012-2016
TABLE 70 North America Pressure Sensitive Labels Market Value (US$ Mn), By Face Stock Material 2017-2022
TABLE 71 North America Pressure Sensitive Labels Market Value (US$ Mn), By Label Type 2012-2016
TABLE 72 North America Pressure Sensitive Labels Market Value (US$ Mn), By Label Type 2017-2022
TABLE 73 North America Pressure Sensitive Labels Market Value (US$ Mn), By Application Sector 2012-2016
TABLE 74 North America Pressure Sensitive Labels Market Value (US$ Mn), By Application Sector 2017-2022
TABLE 75 Latin America Pressure Sensitive Labels Market Value (US$ Mn), By Face Stock Material 2012-2016
TABLE 76 Latin America Pressure Sensitive Labels Market Value (US$ Mn), By Face Stock Material 2017-2022
TABLE 77 Latin America Pressure Sensitive Labels Market Value (US$ Mn), By Label Type 2012-2016
TABLE 78 Latin America Pressure Sensitive Labels Market Value (US$ Mn), By Label Type 2017-2022
TABLE 79 Latin America Pressure Sensitive Labels Market Value (US$ Mn), By Application Sector 2012-2016
TABLE 80 Latin America Pressure Sensitive Labels Market Value (US$ Mn), By Application Sector 2017-2022
TABLE 81 Europe Pressure Sensitive Labels Market Value (US$ Mn), By Face Stock Material 2012-2016
TABLE 82 Europe Pressure Sensitive Labels Market Value (US$ Mn), By Face Stock Material 2017-2022
TABLE 83 Europe Pressure Sensitive Labels Market Value (US$ Mn), By Label Type 2012-2016
TABLE 84 Europe Pressure Sensitive Labels Market Value (US$ Mn), By Label Type 2017-2022
TABLE 85 Europe Pressure Sensitive Labels Market Value (US$ Mn), By Application Sector 2012-2016
TABLE 86 Europe Pressure Sensitive Labels Market Value (US$ Mn), By Application Sector 2017-2022
TABLE 87 Japan Pressure Sensitive Labels Market Value (US$ Mn), By Face Stock Material 2012-2016
TABLE 88 Japan Pressure Sensitive Labels Market Value (US$ Mn), By Face Stock Material 2017-2022
TABLE 89 Japan Pressure Sensitive Labels Market Value (US$ Mn), By Label Type 2012-2016
TABLE 90 Japan Pressure Sensitive Labels Market Value (US$ Mn), By Label Type 2017-2022
TABLE 91 Japan Pressure Sensitive Labels Market Value (US$ Mn), By Application Sector 2012-2016
TABLE 92 Japan Pressure Sensitive Labels Market Value (US$ Mn), By Application Sector 2017-2022
TABLE 93 APEJ Pressure Sensitive Labels Market Value (US$ Mn), By Face Stock Material 2012-2016
TABLE 94 APEJ Pressure Sensitive Labels Market Value (US$ Mn), By Face Stock Material 2017-2022
TABLE 95 APEJ Pressure Sensitive Labels Market Value (US$ Mn), By Label Type 2012-2016
TABLE 96 APEJ Pressure Sensitive Labels Market Value (US$ Mn), By Label Type 2017-2022
TABLE 97 APEJ Pressure Sensitive Labels Market Value (US$ Mn), By Application Sector 2012-2016
TABLE 98 APEJ Pressure Sensitive Labels Market Value (US$ Mn), By Application Sector 2017-2022
TABLE 99 MEA Pressure Sensitive Labels Market Value (US$ Mn), By Face Stock Material 2012-2016
TABLE 100 MEA Pressure Sensitive Labels Market Value (US$ Mn), By Face Stock Material 2017-2022
TABLE 101 MEA Pressure Sensitive Labels Market Value (US$ Mn), By Label Type 2012-2016
TABLE 102 MEA Pressure Sensitive Labels Market Value (US$ Mn), By Label Type 2017-2022
TABLE 103 MEA Pressure Sensitive Labels Market Value (US$ Mn), By Application Sector 2012-2016
TABLE 104 MEA Pressure Sensitive Labels Market Value (US$ Mn), By Application Sector 2017-2022
TABLE 105 US Pressure Sensitive Labels Market Value (US$ Mn), By Face Stock Material 2012-2016
TABLE 106 US Pressure Sensitive Labels Market Value (US$ Mn), By Face Stock Material 2017-2022
TABLE 107 US Pressure Sensitive Labels Market Value (US$ Mn), By Label Type 2012-2016
TABLE 108 US Pressure Sensitive Labels Market Value (US$ Mn), By Label Type 2017-2022
TABLE 109 US Pressure Sensitive Labels Market Value (US$ Mn), By Application Sector 2012-2016
TABLE 110 US Pressure Sensitive Labels Market Value (US$ Mn), By Application Sector 2017-2022
TABLE 111 Canada Pressure Sensitive Labels Market Value (US$ Mn), By Face Stock Material 2012-2016
TABLE 112 Canada Pressure Sensitive Labels Market Value (US$ Mn), By Face Stock Material 2017-2022
TABLE 113 Canada Pressure Sensitive Labels Market Value (US$ Mn), By Label Type 2012-2016
TABLE 114 Canada Pressure Sensitive Labels Market Value (US$ Mn), By Label Type 2017-2022
TABLE 115 Canada Pressure Sensitive Labels Market Value (US$ Mn), By Application Sector 2012-2016
TABLE 116 Canada Pressure Sensitive Labels Market Value (US$ Mn), By Application Sector 2017-2022
TABLE 117 Brazil Pressure Sensitive Labels Market Value (US$ Mn), By Face Stock Material 2012-2016
TABLE 118 Brazil Pressure Sensitive Labels Market Value (US$ Mn), By Face Stock Material 2017-2022
TABLE 119 Brazil Pressure Sensitive Labels Market Value (US$ Mn), By Label Type 2012-2016
TABLE 120 Brazil Pressure Sensitive Labels Market Value (US$ Mn), By Label Type 2017-2022
TABLE 121 Brazil Pressure Sensitive Labels Market Value (US$ Mn), By Application Sector 2012-2016
TABLE 122 Brazil Pressure Sensitive Labels Market Value (US$ Mn), By Application Sector 2017-2022
TABLE 123 Mexico Pressure Sensitive Labels Market Value (US$ Mn), By Face Stock Material 2012-2016
TABLE 124 Mexico Pressure Sensitive Labels Market Value (US$ Mn), By Face Stock Material 2017-2022
TABLE 125 Mexico Pressure Sensitive Labels Market Value (US$ Mn), By Label Type 2012-2016
TABLE 126 Mexico Pressure Sensitive Labels Market Value (US$ Mn), By Label Type 2017-2022
TABLE 127 Mexico Pressure Sensitive Labels Market Value (US$ Mn), By Application Sector 2012-2016
TABLE 128 Mexico Pressure Sensitive Labels Market Value (US$ Mn), By Application Sector 2017-2022
TABLE 129 Argentina Pressure Sensitive Labels Market Value (US$ Mn), By Face Stock Material 2012-2016
TABLE 130 Argentina Pressure Sensitive Labels Market Value (US$ Mn), By Face Stock Material 2017-2022
TABLE 131 Argentina Pressure Sensitive Labels Market Value (US$ Mn), By Label Type 2012-2016
TABLE 132 Argentina Pressure Sensitive Labels Market Value (US$ Mn), By Label Type 2017-2022
TABLE 133 Argentina Pressure Sensitive Labels Market Value (US$ Mn), By Application Sector 2012-2016
TABLE 134 Argentina Pressure Sensitive Labels Market Value (US$ Mn), By Application Sector 2017-2022
TABLE 135 Germany Pressure Sensitive Labels Market Value (US$ Mn), By Face Stock Material 2012-2016
TABLE 136 Germany Pressure Sensitive Labels Market Value (US$ Mn), By Face Stock Material 2017-2022
TABLE 137 Germany Pressure Sensitive Labels Market Value (US$ Mn), By Label Type 2012-2016
TABLE 138 Germany Pressure Sensitive Labels Market Value (US$ Mn), By Label Type 2017-2022
TABLE 139 Germany Pressure Sensitive Labels Market Value (US$ Mn), By Application Sector 2012-2016
TABLE 140 Germany Pressure Sensitive Labels Market Value (US$ Mn), By Application Sector 2017-2022
TABLE 141 UK Pressure Sensitive Labels Market Value (US$ Mn), By Face Stock Material 2012-2016
TABLE 142 UK Pressure Sensitive Labels Market Value (US$ Mn), By Face Stock Material 2017-2022
TABLE 143 UK Pressure Sensitive Labels Market Value (US$ Mn), By Label Type 2012-2016
TABLE 144 UK Pressure Sensitive Labels Market Value (US$ Mn), By Label Type 2017-2022
TABLE 145 UK Pressure Sensitive Labels Market Value (US$ Mn), By Application Sector 2012-2016
TABLE 146 UK Pressure Sensitive Labels Market Value (US$ Mn), By Application Sector 2017-2022
TABLE 147 France Pressure Sensitive Labels Market Value (US$ Mn), By Face Stock Material 2012-2016
TABLE 148 France Pressure Sensitive Labels Market Value (US$ Mn), By Face Stock Material 2017-2022
TABLE 149 France Pressure Sensitive Labels Market Value (US$ Mn), By Label Type 2012-2016
TABLE 150 France Pressure Sensitive Labels Market Value (US$ Mn), By Label Type 2017-2022
TABLE 151 France Pressure Sensitive Labels Market Value (US$ Mn), By Application Sector 2012-2016
TABLE 152 France Pressure Sensitive Labels Market Value (US$ Mn), By Application Sector 2017-2022
TABLE 153 Spain Pressure Sensitive Labels Market Value (US$ Mn), By Face Stock Material 2012-2016
TABLE 154 Spain Pressure Sensitive Labels Market Value (US$ Mn), By Face Stock Material 2017-2022
TABLE 155 Spain Pressure Sensitive Labels Market Value (US$ Mn), By Label Type 2012-2016
TABLE 156 Spain Pressure Sensitive Labels Market Value (US$ Mn), By Label Type 2017-2022
TABLE 157 Spain Pressure Sensitive Labels Market Value (US$ Mn), By Application Sector 2012-2016
TABLE 158 Spain Pressure Sensitive Labels Market Value (US$ Mn), By Application Sector 2017-2022
TABLE 159 Italy Pressure Sensitive Labels Market Value (US$ Mn), By Face Stock Material 2012-2016
TABLE 160 Italy Pressure Sensitive Labels Market Value (US$ Mn), By Face Stock Material 2017-2022
TABLE 161 Italy Pressure Sensitive Labels Market Value (US$ Mn), By Label Type 2012-2016
TABLE 162 Italy Pressure Sensitive Labels Market Value (US$ Mn), By Label Type 2017-2022
TABLE 163 Italy Pressure Sensitive Labels Market Value (US$ Mn), By Application Sector 2012-2016
TABLE 164 Italy Pressure Sensitive Labels Market Value (US$ Mn), By Application Sector 2017-2022
TABLE 165 Nordic Pressure Sensitive Labels Market Value (US$ Mn), By Face Stock Material 2012-2016
TABLE 166 Nordic Pressure Sensitive Labels Market Value (US$ Mn), By Face Stock Material 2017-2022
TABLE 167 Nordic Pressure Sensitive Labels Market Value (US$ Mn), By Label Type 2012-2016
TABLE 168 Nordic Pressure Sensitive Labels Market Value (US$ Mn), By Label Type 2017-2022
TABLE 169 Nordic Pressure Sensitive Labels Market Value (US$ Mn), By Application Sector 2012-2016
TABLE 170 Nordic Pressure Sensitive Labels Market Value (US$ Mn), By Application Sector 2017-2022
TABLE 171 Japan Pressure Sensitive Labels Market Value (US$ Mn), By Face Stock Material 2012-2016
TABLE 172 Japan Pressure Sensitive Labels Market Value (US$ Mn), By Face Stock Material 2017-2022
TABLE 173 Japan Pressure Sensitive Labels Market Value (US$ Mn), By Label Type 2012-2016
TABLE 174 Japan Pressure Sensitive Labels Market Value (US$ Mn), By Label Type 2017-2022
TABLE 175 Japan Pressure Sensitive Labels Market Value (US$ Mn), By Application Sector 2012-2016
TABLE 176 Japan Pressure Sensitive Labels Market Value (US$ Mn), By Application Sector 2017-2022
TABLE 177 China Pressure Sensitive Labels Market Value (US$ Mn), By Face Stock Material 2012-2016
TABLE 178 China Pressure Sensitive Labels Market Value (US$ Mn), By Face Stock Material 2017-2022
TABLE 179 China Pressure Sensitive Labels Market Value (US$ Mn), By Label Type 2012-2016
TABLE 180 China Pressure Sensitive Labels Market Value (US$ Mn), By Label Type 2017-2022
TABLE 181 China Pressure Sensitive Labels Market Value (US$ Mn), By Application Sector 2012-2016
TABLE 182 China Pressure Sensitive Labels Market Value (US$ Mn), By Application Sector 2017-2022
TABLE 183 India Pressure Sensitive Labels Market Value (US$ Mn), By Face Stock Material 2012-2016
TABLE 184 India Pressure Sensitive Labels Market Value (US$ Mn), By Face Stock Material 2017-2022
TABLE 185 India Pressure Sensitive Labels Market Value (US$ Mn), By Label Type 2012-2016
TABLE 186 India Pressure Sensitive Labels Market Value (US$ Mn), By Label Type 2017-2022
TABLE 187 India Pressure Sensitive Labels Market Value (US$ Mn), By Application Sector 2012-2016
TABLE 188 India Pressure Sensitive Labels Market Value (US$ Mn), By Application Sector 2017-2022
TABLE 189 Malaysia Pressure Sensitive Labels Market Value (US$ Mn), By Face Stock Material 2012-2016
TABLE 190 Malaysia Pressure Sensitive Labels Market Value (US$ Mn), By Face Stock Material 2017-2022
TABLE 191 Malaysia Pressure Sensitive Labels Market Value (US$ Mn), By Label Type 2012-2016
TABLE 192 Malaysia Pressure Sensitive Labels Market Value (US$ Mn), By Label Type 2017-2022
TABLE 193 Malaysia Pressure Sensitive Labels Market Value (US$ Mn), By Application Sector 2012-2016
TABLE 194 Malaysia Pressure Sensitive Labels Market Value (US$ Mn), By Application Sector 2017-2022
TABLE 195 Thailand Pressure Sensitive Labels Market Value (US$ Mn), By Face Stock Material 2012-2016
TABLE 196 Thailand Pressure Sensitive Labels Market Value (US$ Mn), By Face Stock Material 2017-2022
TABLE 197 Thailand Pressure Sensitive Labels Market Value (US$ Mn), By Label Type 2012-2016
TABLE 198 Thailand Pressure Sensitive Labels Market Value (US$ Mn), By Label Type 2017-2022
TABLE 199 Thailand Pressure Sensitive Labels Market Value (US$ Mn), By Application Sector 2012-2016
TABLE 200 Thailand Pressure Sensitive Labels Market Value (US$ Mn), By Application Sector 2017-2022
TABLE 201 Singapore Pressure Sensitive Labels Market Value (US$ Mn), By Face Stock Material 2012-2016
TABLE 202 Singapore Pressure Sensitive Labels Market Value (US$ Mn), By Face Stock Material 2017-2022
TABLE 203 Singapore Pressure Sensitive Labels Market Value (US$ Mn), By Label Type 2012-2016
TABLE 204 Singapore Pressure Sensitive Labels Market Value (US$ Mn), By Label Type 2017-2022
TABLE 205 Singapore Pressure Sensitive Labels Market Value (US$ Mn), By Application Sector 2012-2016
TABLE 206 Singapore Pressure Sensitive Labels Market Value (US$ Mn), By Application Sector 2017-2022
TABLE 207 Australia Pressure Sensitive Labels Market Value (US$ Mn), By Face Stock Material 2012-2016
TABLE 208 Australia Pressure Sensitive Labels Market Value (US$ Mn), By Face Stock Material 2017-2022
TABLE 209 Australia Pressure Sensitive Labels Market Value (US$ Mn), By Label Type 2012-2016
TABLE 210 Australia Pressure Sensitive Labels Market Value (US$ Mn), By Label Type 2017-2022
TABLE 211 Australia Pressure Sensitive Labels Market Value (US$ Mn), By Application Sector 2012-2016
TABLE 212 Australia Pressure Sensitive Labels Market Value (US$ Mn), By Application Sector 2017-2022
TABLE 213 GCC Countries Pressure Sensitive Labels Market Value (US$ Mn), By Face Stock Material 2012-2016
TABLE 214 GCC Countries Pressure Sensitive Labels Market Value (US$ Mn), By Face Stock Material 2017-2022
TABLE 215 GCC Countries Pressure Sensitive Labels Market Value (US$ Mn), By Label Type 2012-2016
TABLE 216 GCC Countries Pressure Sensitive Labels Market Value (US$ Mn), By Label Type 2017-2022
TABLE 217 GCC Countries Pressure Sensitive Labels Market Value (US$ Mn), By Application Sector 2012-2016
TABLE 218 GCC Countries Pressure Sensitive Labels Market Value (US$ Mn), By Application Sector 2017-2022
TABLE 219 South Africa Pressure Sensitive Labels Market Value (US$ Mn), By Face Stock Material 2012-2016
TABLE 220 South Africa Pressure Sensitive Labels Market Value (US$ Mn), By Face Stock Material 2017-2022
TABLE 221 South Africa Pressure Sensitive Labels Market Value (US$ Mn), By Label Type 2012-2016
TABLE 222 South Africa Pressure Sensitive Labels Market Value (US$ Mn), By Label Type 2017-2022
TABLE 223 South Africa Pressure Sensitive Labels Market Value (US$ Mn), By Application Sector 2012-2016
TABLE 224 South Africa Pressure Sensitive Labels Market Value (US$ Mn), By Application Sector 2017-2022
TABLE 225 Turkey Pressure Sensitive Labels Market Value (US$ Mn), By Face Stock Material 2012-2016
TABLE 226 Turkey Pressure Sensitive Labels Market Value (US$ Mn), By Face Stock Material 2017-2022
TABLE 227 Turkey Pressure Sensitive Labels Market Value (US$ Mn), By Label Type 2012-2016
TABLE 228 Turkey Pressure Sensitive Labels Market Value (US$ Mn), By Label Type 2017-2022
TABLE 229 Turkey Pressure Sensitive Labels Market Value (US$ Mn), By Application Sector 2012-2016
TABLE 230 Turkey Pressure Sensitive Labels Market Value (US$ Mn), By Application Sector 2017-2022
TABLE 231 Israel Pressure Sensitive Labels Market Value (US$ Mn), By Face Stock Material 2012-2016
TABLE 232 Israel Pressure Sensitive Labels Market Value (US$ Mn), By Face Stock Material 2017-2022
TABLE 233 Israel Pressure Sensitive Labels Market Value (US$ Mn), By Label Type 2012-2016
TABLE 234 Israel Pressure Sensitive Labels Market Value (US$ Mn), By Label Type 2017-2022
TABLE 235 Israel Pressure Sensitive Labels Market Value (US$ Mn), By Application Sector 2012-2016
TABLE 236 Israel Pressure Sensitive Labels Market Value (US$ Mn), By Application Sector 2017-2022
List of Figures
FIG. 1 Global Pressure Sensitive Labels Market Value (US$ Mn), 2012-2016
FIG. 2 Global Pressure Sensitive Labels Market Value (US$ Mn) Forecast, 2017-2022
FIG. 3 Global Pressure Sensitive Labels Market Value (US$ Mn) and Y-o-Y, 2015-2022
FIG. 4 Global Paper Segment Market Value (US$ Mn) By Region, 2012-2016
FIG. 5 Global Paper Segment Market Value (US$ Mn) By Region, 2017-2022
FIG. 6 Global Paper Segment Y-o-Y Growth Rate, By Region, 2015-2022
FIG. 7 Global Polypropylene Segment Market Value (US$ Mn) By Region, 2012-2016
FIG. 8 Global Polypropylene Segment Market Value (US$ Mn) By Region, 2017-2022
FIG. 9 Global Polypropylene Segment Y-o-Y Growth Rate, By Region, 2015-2022
FIG. 10 Global polyethylene Segment Market Value (US$ Mn) By Region, 2012-2016
FIG. 11 Global polyethylene Segment Market Value (US$ Mn) By Region, 2017-2022
FIG. 12 Global polyethylene Segment Y-o-Y Growth Rate, By Region, 2015-2022
FIG. 13 Global PET Segment Market Value (US$ Mn) By Region, 2012-2016
FIG. 14 Global PET Segment Market Value (US$ Mn) By Region, 2017-2022
FIG. 15 Global PET Segment Y-o-Y Growth Rate, By Region, 2015-2022
FIG. 16 Global Permanent Label Segment Market Value (US$ Mn) By Region, 2012-2016
FIG. 17 Global Permanent Label Segment Market Value (US$ Mn) By Region, 2017-2022
FIG. 18 Global Permanent Label Segment Y-o-Y Growth Rate, By Region, 2015-2022
FIG. 19 Global Removable Label Segment Market Value (US$ Mn) By Region, 2012-2016
FIG. 20 Global Removable Label Segment Market Value (US$ Mn) By Region, 2017-2022
FIG. 21 Global Removable Label Segment Y-o-Y Growth Rate, By Region, 2015-2022
FIG. 22 Global Food & Beverage Segment Market Value (US$ Mn) By Region, 2012-2016
FIG. 23 Global Food & Beverage Segment Market Value (US$ Mn) By Region, 2017-2022
FIG. 24 Global Food & Beverage Segment Y-o-Y Growth Rate, By Region, 2015-2022
FIG. 25 Global Pharmaceutical Segment Market Value (US$ Mn) By Region, 2012-2016
FIG. 26 Global Pharmaceutical Segment Market Value (US$ Mn) By Region, 2017-2022
FIG. 27 Global Pharmaceutical Segment Y-o-Y Growth Rate, By Region, 2015-2022
FIG. 28 Global Tracking, Logistics and Transportation Segment Market Value (US$ Mn) By Region, 2012-2016
FIG. 29 Global Tracking, Logistics and Transportation Segment Market Value (US$ Mn) By Region, 2017-2022
FIG. 30 Global Tracking, Logistics and Transportation Segment Y-o-Y Growth Rate, By Region, 2015-2022
FIG. 31 Global Home & Personal Care Segment Market Value (US$ Mn) By Region, 2012-2016
FIG. 32 Global Home & Personal Care Segment Market Value (US$ Mn) By Region, 2017-2022
FIG. 33 Global Home & Personal Care Segment Y-o-Y Growth Rate, By Region, 2015-2022
FIG. 34 Global Semiconductor & Electronics Segment Market Value (US$ Mn) By Region, 2012-2016
FIG. 35 Global Semiconductor & Electronics Segment Market Value (US$ Mn) By Region, 2017-2022
FIG. 36 Global Semiconductor & Electronics Segment Y-o-Y Growth Rate, By Region, 2015-2022
FIG. 37 Global Retail Labels Segment Market Value (US$ Mn) By Region, 2012-2016
FIG. 38 Global Retail Labels Segment Market Value (US$ Mn) By Region, 2017-2022
FIG. 39 Global Retail Labels Segment Y-o-Y Growth Rate, By Region, 2015-2022
FIG. 40 Global Other Products Segment Market Value (US$ Mn) By Region, 2012-2016
FIG. 41 Global Other Products Segment Market Value (US$ Mn) By Region, 2017-2022
FIG. 42 Global Other Products Segment Y-o-Y Growth Rate, By Region, 2015-2022
FIG. 43 North America Pressure Sensitive Labels Market Value (US$ Mn), By Face Stock Material 2012-2016
FIG. 44 North America Pressure Sensitive Labels Market Value (US$ Mn), By Face Stock Material 2017-2022
FIG. 45 North America Pressure Sensitive Labels Market Value (US$ Mn), By Label Type 2012-2016
FIG. 46 North America Pressure Sensitive Labels Market Value (US$ Mn), By Label Type 2017-2022
FIG. 47 North America Pressure Sensitive Labels Market Value (US$ Mn), By Application Sector 2012-2016
FIG. 48 North America Pressure Sensitive Labels Market Value (US$ Mn), By Application Sector 2017-2022
FIG. 49 Latin America Pressure Sensitive Labels Market Value (US$ Mn), By Face Stock Material 2012-2016
FIG. 50 Latin America Pressure Sensitive Labels Market Value (US$ Mn), By Face Stock Material 2017-2022
FIG. 51 Latin America Pressure Sensitive Labels Market Value (US$ Mn), By Label Type 2012-2016
FIG. 52 Latin America Pressure Sensitive Labels Market Value (US$ Mn), By Label Type 2017-2022
FIG. 53 Latin America Pressure Sensitive Labels Market Value (US$ Mn), By Application Sector 2012-2016
FIG. 54 Latin America Pressure Sensitive Labels Market Value (US$ Mn), By Application Sector 2017-2022
FIG. 55 Europe Pressure Sensitive Labels Market Value (US$ Mn), By Face Stock Material 2012-2016
FIG. 56 Europe Pressure Sensitive Labels Market Value (US$ Mn), By Face Stock Material 2017-2022
FIG. 57 Europe Pressure Sensitive Labels Market Value (US$ Mn), By Label Type 2012-2016
FIG. 58 Europe Pressure Sensitive Labels Market Value (US$ Mn), By Label Type 2017-2022
FIG. 59 Europe Pressure Sensitive Labels Market Value (US$ Mn), By Application Sector 2012-2016
FIG. 60 Europe Pressure Sensitive Labels Market Value (US$ Mn), By Application Sector 2017-2022
FIG. 61 Japan Pressure Sensitive Labels Market Value (US$ Mn), By Face Stock Material 2012-2016
FIG. 62 Japan Pressure Sensitive Labels Market Value (US$ Mn), By Face Stock Material 2017-2022
FIG. 63 Japan Pressure Sensitive Labels Market Value (US$ Mn), By Label Type 2012-2016
FIG. 64 Japan Pressure Sensitive Labels Market Value (US$ Mn), By Label Type 2017-2022
FIG. 65 Japan Pressure Sensitive Labels Market Value (US$ Mn), By Application Sector 2012-2016
FIG. 66 Japan Pressure Sensitive Labels Market Value (US$ Mn), By Application Sector 2017-2022
FIG. 67 APEJ Pressure Sensitive Labels Market Value (US$ Mn), By Face Stock Material 2012-2016
FIG. 68 APEJ Pressure Sensitive Labels Market Value (US$ Mn), By Face Stock Material 2017-2022
FIG. 69 APEJ Pressure Sensitive Labels Market Value (US$ Mn), By Label Type 2012-2016
FIG. 70 APEJ Pressure Sensitive Labels Market Value (US$ Mn), By Label Type 2017-2022
FIG. 71 APEJ Pressure Sensitive Labels Market Value (US$ Mn), By Application Sector 2012-2016
FIG. 72 APEJ Pressure Sensitive Labels Market Value (US$ Mn), By Application Sector 2017-2022
FIG. 73 MEA Pressure Sensitive Labels Market Value (US$ Mn), By Face Stock Material 2012-2016
FIG. 74 MEA Pressure Sensitive Labels Market Value (US$ Mn), By Face Stock Material 2017-2022
FIG. 75 MEA Pressure Sensitive Labels Market Value (US$ Mn), By Label Type 2012-2016
FIG. 76 MEA Pressure Sensitive Labels Market Value (US$ Mn), By Label Type 2017-2022
FIG. 77 MEA Pressure Sensitive Labels Market Value (US$ Mn), By Application Sector 2012-2016
FIG. 78 MEA Pressure Sensitive Labels Market Value (US$ Mn), By Application Sector 2017-2022
Copyright © Transparency Market Research, Inc. All Rights reserved
Trust Online


Pressure Sensitive Labels Market