
Dermatology Diagnostic Devices and Therapeutics Market: Analyst’s Forecast
While the jury is still out on what exactly causes hair loss, whether it is thyroid disease, pollution, protein deficiency, or simply a lack of care – cases are proliferating. As hair loss directly impacts the appearance of an individual – urban populations with increased disposable income in an Instagram- and Facebook-driven world are opting for innovative methods to regain lost hair or at least control further hair fall.
Skin care is another segment of the healthcare industry that is currently flourishing, gaining traction from the growing demand for anti-aging products in geriatrics-dominated developed countries such as the U.S. and the U.K and the pursuit of fairness among Asians, particularly in the vastly populated emerging economy of India.
Dermatology is the branch of medical science that deals with both of the aforementioned concerns, which are now ubiquitous across the world. Rigorous research and developments have happened in the field of dermatology in the recent past, paving way to devices that are efficient in diagnosing the cause and intensity as well as providing a logical therapy. According to this business intelligence study, the demand in the global dermatology diagnostic devices and therapeutics market will expand at a formidable CAGR of 7.0% during the forecast period of 2017 to 2024. Revenue-wise, the market for dermatology therapeutics will produce opportunities worth US$20,073.0 million, whereas the global dermatology diagnostic devices market is forecasted to be worth US$1,015.9 million by 2017.
Apart from increase number of cases of hair loss and skin diseases and advancements in the field, the dermatology diagnostic devices and therapeutics market is gaining impetus from the mushrooming of specialty clinics. In addition to that, growth of the cosmetics sector and emergence of ecommerce is expected to reflect positively over this market. On the other hand, substantial cost of dermatology diagnostic devices and related therapies are obstructing the market from attaining greater profitability.
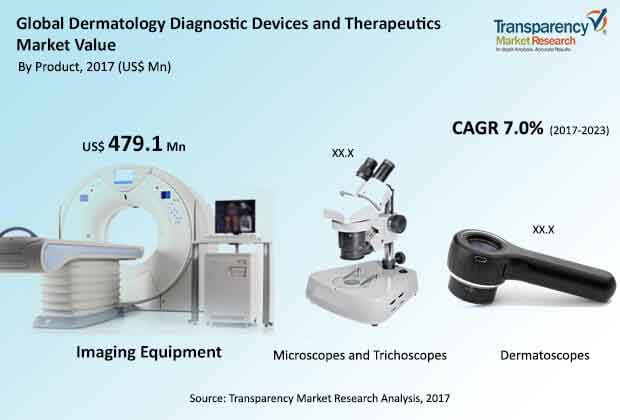
Imaging Equipment Leading Diagnostic Devices Segment
Based on diagnostic devices, the market for dermatology has been segmented into imaging equipment, microscopes and trichoscopes, and dermatoscopes. The report divides imaging equipment into magnetic resonance imaging (MRI), X-ray, optical coherence tomography (OCT), and ultrasound, whereas microscopes and trichoscopes have been further sub-segmented into reflectance confocal microscopy (RCM), multispectral photoacaustic microscopy (PAM), Raman spectroscopy, and others. Moreover, dermatoscopes have been bifurcated into hybrid, cross-polarized, and contact oil immersion dermatoscope. Among these, the sub-segments of imaging equipment constituted for a revenue of 479.1 million in 2017 and the demand for the same is primed to expand at an above-average CAGR of 7.4% during 2017 to 2023. Owing to their proven detection results, real-time diagnostic image formation, and high sensitivity - the imaging equipment segment is flourishing.
Antibacterial High Demand Drug Class among All
On the basis of drug class or therapeutic agent, the market has been categorized into biologics, immunosuppressant, retinoids, corticosteroids, antiviral agents, antifungal agents, and anti-bacterial. As of 2017, antibacterials provided for the most prominent chunk of demand, and is estimated generate a revenue of US$6,634.6 million by the end of 2024. Antibacterial drugs have been utilized by humans since the discovery of first antibiotic penicillin in 1928. Topical antibacterial, including mupirocin or clindamycin, are often used to treat or prevent infection. Additionally, drugs such as anthralin, although not used often, help reduce inflammation and can help treat psoriasis. Apart from topical antibacterials, oral antibiotics are used to treat many skin conditions. Common oral antibiotics used in the treatment of bacterial infections include erythromycin, tetracycline, and dicloxacillin.
Geographically, the developed country of the U.S. makes North America are the most lucrative region for the vendors operating in the global dermatology diagnostic devices and therapeutics market. As of 2017, the North America dermatology market was worth US$302.5 million and the demand from the region is projected to expand at most promising CAGR of 7.64% during 2017 to 2023. The U.S. dermatology market is driven by high patient base of skin disorders such as melanoma of the skin, psoriasis, and impetigo. While Europe is second most profitable region, Asia Pacific is showcasing stronger growth potential.
Novartis International AG, Dino-Lite Europe/IDCP B.V., Agfa-Gevaert N.V., Cutera, Inc., Genentech, Galderma S.A., Michelson Diagnostics Ltd., and Valeant Pharmaceuticals International, Inc. are some of the most prominent companies currently operating in the global dermatology diagnostic devices and therapeutics market.
Global Dermatology Diagnostic Devices and Therapeutics Market to Grow with Advancements in Skincare Treatments
The demand within the global dermatology diagnostic devices and therapeutics market is slated to expand in the times to follow. The growing inclination of the masses towards undergoing skin enhancement treatments has created new pathways for growth across this market. Women and men have become increasingly focused on taking care of their skin. Besides, creation of iconic images around personal grooming has brought cosmetic products under the spotlight of attention. The domain of dermatology has witnessed formidable advancements over the recent past, creating new opportunities for the global dermatology diagnostic devices and therapeutics market. Th focus of dermatologists on developing new treatment lines for skin infections and rashes has also given a thrust to market growth.
|
Product |
|
|
Drug Class |
|
|
Geography |
|
Section - 1 Preface
1.1. Report Description
1.2. Market Segmentation
1.3. Research Methodology
1.4. Research Methodology : Assumptions
Section - 2 Executive Summary: Global Dermatology Diagnostic Devices and Therapeutics Market
2.1. Global Dermatology Diagnostic Devices and Therapeutics Market, Size and Forecast, By Revenue, 2014–2024 (US$ Mn)
2.2. Global Dermatology Diagnostic Devices Market, by Product, 2015 (US$ Mn)
2.3. Global Dermatology Therapeutics Market, by Drug Class, 2015 (US$ Mn)
2.4. Global Market Share by Geography (Diagnostic Devices), 2015 and 2024 (Value %)
2.5. Global Market Share by Geography (Therapeutics), 2015 and 2024 (Value %)
2.6. Dermatology Diagnostic Devices Market Snapshot
2.7. Dermatology Therapeutics Market Snapshot
Section-3 Market Overview: Global Dermatology Diagnostic Devices and Therapeutics Market
3.1. Introduction and Market Definition
3.2. Market Dynamics
3.2.1. Drivers
3.2.2. Restraints
3.2.3. Opportunities
3.3. Porter’s five forces analysis
3.4. Company Market Share
3.4.1. Company Market Share : Dermatology Diagnostic Devices Market (2015)
3.4.2. Company Market Share : Dermatology Therapeutics Market (2015)
3.5. Market Attractiveness Analysis
3.5.1. Market Attractiveness Analysis : Dermatology Diagnostic Devices Market
3.5.2. Market Attractiveness Analysis : Dermatology Therapeutics Market
3.5.3. Market Attractiveness Analysis : By Geography
3.6. Overview of Skin Diseases
Section-4 Global Dermatology Diagnostic Devices Market Segmentation, By Product
4.1. Introduction
4.2. Global Dermatology Diagnostic Devices Market, by Product, 2014–2024 (US$ Mn)
4.3. Global Dermatoscope Market Revenue 2014–2024 (US$ Mn)
4.3.1. Global Dermatoscope Market Revenue, By Product 2014–2024 (US$ Mn)
4.4. Global Dermatology Microscopes and Trichoscopes Market Revenue 2014–2024 (US$ Mn)
4.4.1. Global Dermatology Microscopes and Trichoscopes Market Revenue, By Product 2014–2024 (US$ Mn)
4.5. Global Dermatology Imaging Equipment Market Revenue 2014–2024 (US$ Mn)
4.5.1. Global Dermatology Imaging Equipment Market Revenue, By Product 2014–2024 (US$ Mn)
Section-5 Global Dermatology Therapeutics Market Segmentation, By Drug Class
5.1. Introduction
5.2. Global Dermatology Therapeutics Market, by Drug Class, 2014–2024 (US$ Mn)
5.2.1. Global Antibacterials for Dermatology Market Revenue, 2014–2024 (US$ Mn)
5.2.2. Global Antifungal Agents for Dermatology Market Revenue, 2014–2024 (US$ Mn)
5.2.3. Global Antiviral Agents for Dermatology Market Revenue, 2014–2024 (US$ Mn)
5.2.4. Global Corticosteroids for Dermatology Market Revenue, 2014–2024 (US$ Mn)
5.2.5. Global Retinoids for Dermatology Market Revenue, 2014–2024 (US$ Mn)
5.2.6. Global Immunosuppresants for Dermatology Market Revenue, 2014–2024 (US$ Mn)
5.2.7. Global Biologics for Dermatology Market Revenue, 2014–2024 (US$ Mn)
Section-6 Market Segmentation – By Pipeline Assessment
6.1. Global Dermatology Therapeutics Market: Pipeline Overview, Phase 1, 2, and 3
6.2. Global Dermatology Therapeutics Market, Pipeline Analysis and Forecast, Year of Launch till 2024 (US$ Mn)
Section-7 Global Dermatology Diagnostic Devices and Therapeutics Market Segmentation, By Region
7.1. Overview
7.1.1. Global Dermatology Diagnostic Devices Market Revenue, by Geography, 2014–2024 (US$ Mn)
7.1.2. Global Dermatology Therapeutics Market Revenue, by Geography, 2014–2024 (US$ Mn)
7.2. North America Dermatology Diagnostic Devices and Therapeutics Market
7.2.1. North America Dermatology Diagnostic Devices Market Revenue, by Country, 2014–2024 (US$ Mn)
7.2.2. North America Dermatology Diagnostic Devices Market Revenue, by Product, 2014–2024 (US$ Mn)
7.2.2.1. North America Dermatoscope Market Revenue, by Product, 2014–2024 (US$ Mn)
7.2.2.2. North America Dermatology Microscopes and Trichoscopes Market Revenue, by Product, 2014–2024 (US$ Mn)
7.2.2.3. North America Dermatology Imaging Equipment Market Revenue, by Product, 2014–2024 (US$ Mn)
7.2.3. North America Dermatology Therapeutics Market Revenue, by Country, 2014–2024 (US$ Mn)
7.2.4. North America Dermatology Therapeutics Market Revenue, by Drug Class, 2014–2024 (US$ Mn)
7.3. Europe Dermatology Diagnostic Devices and Therapeutics Market
7.3.1. Europe Dermatology Diagnostic Devices Market Revenue, by Country, 2014–2024 (US$ Mn)
7.3.2. Europe Dermatology Diagnostic Devices Market Revenue, by Product, 2014–2024 (US$ Mn)
7.3.2.1. Europe Dermatoscope Market Revenue, by Product, 2014–2024 (US$ Mn)
7.3.2.2. Europe Dermatology Microscopes and Trichoscopes Market Revenue, by Product, 2014–2024 (US$ Mn)
7.3.2.3. Europe Dermatology Imaging Equipment Market Revenue, by Product, 2014–2024 (US$ Mn)
7.3.3. Europe Dermatology Therapeutics Market Revenue, by Country, 2014–2024 (US$ Mn)
7.3.4. Europe Dermatology Therapeutics Market Revenue, by Drug Class, 2014–2024 (US$ Mn)
7.4. Asia Pacific Dermatology Diagnostic Devices and Therapeutics Market
7.4.1. Asia Pacific Dermatology Diagnostic Devices Market Revenue, by Country, 2014–2024 (US$ Mn)
7.4.2. Asia Pacific Dermatology Diagnostic Devices Market Revenue, by Product, 2014–2024 (US$ Mn)
7.4.2.1. Asia Pacific Dermatoscope Market Revenue, by Product, 2014–2024 (US$ Mn)
7.4.2.2. Asia Pacific Dermatology Microscopes and Trichoscopes Market Revenue, by Product, 2014–2024 (US$ Mn)
7.4.2.3. Asia Pacific Dermatology Imaging Equipment Market Revenue, by Product, 2014–2024 (US$ Mn)
7.4.3. Asia Pacific Therapeutics Market Revenue, by Country, 2014–2024 (US$ Mn)
7.4.4. Asia Pacific Dermatology Therapeutics Market Revenue, by Drug Class, 2014–2024 (US$ Mn)
7.5. Latin America Dermatology Diagnostic Devices and Therapeutics Market
7.5.1. Latin America Dermatology Diagnostic Devices Market Revenue, by Country, 2014–2024 (US$ Mn)
7.5.2. Latin America Dermatology Diagnostic Devices Market Revenue, by Product, 2014–2024 (US$ Mn)
7.5.2.1. Latin America Dermatoscope Market Revenue, by Product, 2014–2024 (US$ Mn)
7.5.2.2. Latin America Dermatology Microscopes and Trichoscopes Market Revenue, by Product, 2014–2024 (US$ Mn)
7.5.2.3. Latin America Dermatology Imaging Equipment Market Revenue, by Product, 2014–2024 (US$ Mn)
7.5.3. Latin America Dermatology Therapeutics Market Revenue, by Country, 2014–2024 (US$ Mn)
7.5.4. Latin America Dermatology Therapeutics Market Revenue, by Drug Class, 2014–2024 (US$ Mn)
7.6. Middle East and North Africa (MENA) Dermatology Diagnostic Devices and Therapeutics Market
7.6.1. MENA Dermatology Diagnostic Devices Market Revenue, by Country, 2014–2024 (US$ Mn)
7.6.2. MENA Dermatology Diagnostic Devices Market Revenue, by Product, 2014–2024 (US$ Mn)
7.6.2.1. MENA Dermatoscope Market Revenue, by Product, 2014–2024 (US$ Mn)
7.6.2.2. MENA Dermatology Microscopes and Trichoscopes Market Revenue, by Product, 2014–2024 (US$ Mn)
7.6.2.3. MENA Dermatology Imaging Equipment Market Revenue, by Product, 2014–2024 (US$ Mn)
7.6.3. MENA Dermatology Therapeutics Market Revenue, by Country, 2014–2024 (US$ Mn)
7.6.4. MENA Dermatology Therapeutics Market Revenue, by Drug Class, 2014–2024 (US$ Mn)
7.7. Rest of the World (ROW) Dermatology Diagnostic Devices and Therapeutics Market
7.7.1. ROW Dermatology Diagnostic Devices Market Revenue, 2014–2024 (US$ Mn)
7.7.2. ROW Dermatology Therapeutics Market Revenue, 2014–2024 (US$ Mn)
Section-8 Historical Snapshot and Current Trends
Section-9 Company Profiles
9.1 Agfa-Gevaert N.V.
9.1.1 Company Overview (HQ, Business Segments, Employee Strength)
9.1.2 Financial Overview
9.1.3 Product Portfolio
9.1.4 Strategic Overview
9.2 Astellas Pharma, Inc.
9.2.1. Company Overview (HQ, Business Segments, Employee Strength)
9.2.2. Financial Overview
9.2.3. Product Portfolio
9.2.4. Strategic Overview
9.3 Cutera, Inc.
9.3.1. Company Overview (HQ, Business Segments, Employee Strength)
9.3.2. Financial Overview
9.3.3. Product Portfolio
9.3.4. Strategic Overview
9.4 Dino-Lite Europe/IDCP BV.
9.4.1. Company Overview (HQ, Business Segments, Employee Strength)
9.4.2. Product Portfolio
9.4.3. Strategic Overview
9.5 Galderma S.A.
9.5.1. Company Overview (HQ, Business Segments, Employee Strength)
9.5.2. Financial Overview
9.5.3. Product Portfolio
9.5.5. Strategic Overview
9.6 Genentech, a Roche Company
9.6.1. Company Overview (HQ, Business Segments, Employee Strength)
9.6.2. Product Portfolio
9.6.3. Strategic Overview
9.7 GlaxoSmithKline plc (Stiefel Laboratories, Inc.)
9.7.1. Company Overview (HQ, Business Segments, Employee Strength)
9.7.2. Financial Overview
9.7.3. Product Portfolio
9.7.4. Strategic Overview
9.8 LEO Pharma A/S
9.8.1. Company Overview (HQ, Business Segments, Employee Strength)
9.8.2. Financial Overview
9.8.3. Product Portfolio
9.8.4. Strategic Overview
9.9 Michelson Diagnostics Ltd.
9.9.1. Company Overview (HQ, Business Segments, Employee Strength)
9.9.2. Product Portfolio
9.9.3. Strategic Overview
9.10 Novartis International AG
9.10.1. Company Overview (HQ, Business Segments, Employee Strength)
9.10.2. Financial Overview
9.10.3. Product Portfolio
9.10.4. Strategic Overview
9.11 Valeant Pharmaceuticals International, Inc.
9.11.1. Company Overview (HQ, Business Segments, Employee Strength)
9.11.2. Financial Overview
9.11.3. Product Portfolio
9.11.4. Strategic Overview
9.12 Canfield Scientific, Inc.
9.12.1. Company Overview (HQ, Business Segments, Employee Strength)
9.12.2. Product Portfolio
9.12.3. Strategic Overview
List of Tables
Table 01 : Global Dermatology Diagnostic Devices Market, by Product, (US$ Mn), 2014–2024
Table 02 : Global Dermatoscopes Market Revenue, by Product, (US$ Mn), 2014–2024
Table 03 : Global Microscopes and Trichoscopes Market Revenue, by Product, (US$ Mn), 2014–2024
Table 04 : Global Imaging Equipment Market Revenue, by Product, (US$ Mn) , 2014–2024
Table 05 : Global Dermatology Therapeutics Market, by Drug Class, (US$ Mn), 2014–2024
Table 06 : Global Dermatology Therapeutics Market, Pipeline Analysis and Forecast, Year of Launch till 2024 (US$ Mn)
Table 07 : Global Dermatology Diagnostic Devices Market Revenue, by Region, (US$ Mn), 2014–2024
Table 08 : Global Dermatology Therapeutics Market Revenue, by Region, (US$ Mn), 2014–2024
Table 09 : North America Dermatology Diagnostic Devices Market Revenue, by Country, (US$ Mn), 2014–2024
Table 10 : North America Dermatology Diagnostic Devices Market Revenue, by Device, (US$ Mn), 2014–2024
Table 11 : North America Dermatoscopes Market Revenue, by Product Type, (US$ Mn), 2014–2024
Table 12 : North America Dermatology Microscopes and Trichoscopes Market Revenue, by Product Type, (US$ Mn), 2014–2024
Table 13 : North America Dermatology Imaging Equipment Market Revenue, by Product Type, 2014–2024 (US$ Mn)
Table 14 : North America Dermatology Therapeutics Market Revenue, by Country, (US$ Mn), 2014–2024
Table 15 : North America Dermatology Therapeutics Market Revenue, by Drug Class, (US$ Mn), 2014–2024
Table 16 : Europe Dermatology Diagnostic Devices Market Revenue, by Country, (US$ Mn), 2014–2024
Table 17 : Europe Dermatology Diagnostic Devices Market Revenue, by Device, (US$ Mn), 2014–2024
Table 18 : Europe Dermatoscopes Market Revenue, by Product Type, (US$ Mn), 2014–2024
Table 19 : Europe Dermatology Microscopes and Trichoscopes Market Revenue, by Product Type, (US$ Mn), 2014–2024
Table 20 : Europe Dermatology Imaging Equipment Market Revenue, by Product Type, (US$ Mn), 2014–2024
Table 21 : Europe Dermatology Therapeutics Market Revenue, by Country, (US$ Mn), 2014–2024
Table 22 : Europe Dermatology Therapeutics Market Revenue, by Drug Class, (US$ Mn), 2014–2024
Table 23 : APAC Dermatology Diagnostic Devices Market Revenue, by Country, (US$ Mn), 2014–2024
Table 24 : Asia Pacific Dermatology Diagnostic Devices Market Revenue, by Device, (US$ Mn), 2014–2024
Table 25 : Asia Pacific Dermatoscopes Market Revenue, by Product Type, (US$ Mn), 2014–2024
Table 26 : Asia Pacific Dermatology Microscopes and Trichoscopes Market Revenue, by Product Type, (US$ Mn), 2014–2024
Table 27 : Asia Pacific Dermatology Imaging Equipment Market Revenue, by Product Type, (US$ Mn), 2014–2024
Table 28 : Asia Pacific Dermatology Therapeutics Market Revenue, by Country, (US$ Mn), 2014–2024
Table 29 : Asia Pacific Dermatology Therapeutics Market Revenue, by Drug Class, (US$ Mn), 2014–2024
Table 30 : Latin America Dermatology Diagnostic Devices Market Revenue, by Country, (US$ Mn), 2014–2024
Table 31 : Latin America Dermatology Diagnostic Devices Market Revenue, by Device, (US$ Mn), 2014–2024
Table 32 : Latin America Dermatoscopes Market Revenue, by Product Type, (US$ Mn), 2014–2024
Table 33 : Latin America Dermatology Microscopes and Trichoscopes Market Revenue, by Product Type, (US$ Mn), 2014–2024
Table 34 : Latin America Dermatology Imaging Equipment Market Revenue, by Product Type, (US$ Mn), 2014–2024
Table 35 : Latin America Dermatology Therapeutics Market Revenue, by Country, (US$ Mn), 2014–2024
Table 36 : Latin America Dermatology Therapeutics Market Revenue, by Drug Class, (US$ Mn), 2014–2024
Table 37 : MENA Dermatology Diagnostic Devices Market Revenue, by Country, (US$ Mn), 2014–2024
Table 38 : MENA Dermatology Diagnostic Devices Market Revenue, by Device, (US$ Mn), 2014–2024
Table 39 : MENA Dermatoscopes Market Revenue, by Product Type, (US$ Mn), 2014–2024
Table 40 : MENA Dermatology Microscopes and Trichoscopes Market Revenue, by Product Type, (US$ Mn), 2014–2024
Table 41 : MENA Dermatology Imaging Equipment Market Revenue, by Product Type, (US$ Mn), 2014–2024
Table 42 : MENA Dermatology Therapeutics Market Revenue, by Country, (US$ Mn), 2014–2024
Table 43 : MENA Dermatology Therapeutics Market Revenue, by Drug Class, (US$ Mn), 2014–2024
List of Figures
Figure 01 : Global Dermatology Diagnostic Devices and Therapeutics Market, Size and Forecast, by Revenue (US$ Mn), 2014–2024
Figure 02 : Global Dermatology Diagnostic Devices Market, by Product (US$ Mn), 2015
Figure 03 : Global Dermatology Therapeutics Market, by Drug Class (US$ Mn), 2015
Figure 04 : Global Market Share, by Region (Diagnostic Devices) (Value %), 2015 and 2024
Figure 05 : Global Market Share, by Region (Therapeutics), (Value %), 2015 and 2024
Figure 06 : Percentage of Population (U.S., China, Japan, and India) over the age of 65: 1980–2050
Figure 07 : Global Percentage Change in the World’s Population, by Age: 2010–2050
Figure 08 : Market Share Analysis of Key Players, Dermatology Diagnostic Devices Market (%), 2015
Figure 09 : Market Share Analysis of Key Players, Dermatology Therapeutics Market (%), 2015
Figure 10 : Market Attractiveness Analysis, by Device, 2015
Figure 11 : Market Attractiveness Analysis, by Drug Class, 2015
Figure 12 : Market Attractiveness Analysis, by Geography, 2015
Figure 13 : Global Dermatoscopes Market Revenue (US$ Mn), 2014–2024
Figure 14 : Global Microscopes and Trichoscopes Market Revenue (US$ Mn), 2014–2024
Figure 15 : Global Imaging Equipment Market Revenue (US$ Mn), 2014–2024
Figure 16 : Global Antibacterials Market Revenue (US$ Mn), 2014–2024
Figure 17 : Global Antifungal Agents Market Revenue (US$ Mn), 2014–2024
Figure 18 : Global Antiviral Agents Market Revenue (US$ Mn), 2014–2024
Figure 19 : Global Corticosteroids Market Revenue (US$ Mn), 2014–2024
Figure 20 : Global Retinoids Market Revenue (US$ Mn), 2014–2024
Figure 21 : Global Immunosuppressants Market Revenue (US$ Mn), 2014–2024
Figure 22 : Global Biologics Market Revenue (US$ Mn), 2014–2024
Figure 23 : RoW Dermatology Diagnostic Devices Market Revenue, (US$ Mn), 2014–2024
Figure 24 : RoW Dermatology Therapeutics Market Revenue, (US$ Mn), 2014–2024
Copyright © Transparency Market Research, Inc. All Rights reserved
Trust Online


Dermatology Diagnostic Devices and Therapeutics Market