Chapter 1 Preface
1.1 Report Scope and Description
1.2 Report Scope and Market Segmentation
1.3 Research Methodology
Chapter 2 Executive Summary
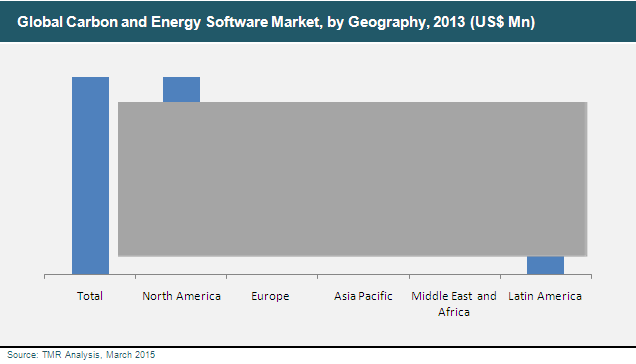
2.1 Market Snapshot: Global Carbon and Energy Software Market (2013 and 2022)
2.2 Global Carbon and Energy Software Market, 2012 – 2022, Revenue (US$ Mn) and Y-o-Y Growth (%)
2.3 Global Carbon and Energy Software Market, by Deployment Type, 2013 (US$ Mn)
2.4 Global Carbon and Energy Software Market, by End-use Industry, 2013 (US$ Mn)
Chapter 3 Global Carbon and Energy Software Market Analysis
3.1 Key Trends Analysis
3.2 Market Dynamics
3.2.1 Drivers
3.2.1.1 Increasing Demand for Specialized Software for Energy and Carbon Accounting
3.2.1.2 Increased Government Initiatives for the Reduction of Carbon Emissions
3.2.2 Restraints
3.2.2.1 Lack of Awareness and High Costs of Deploying On-Premise Software Solutions
3.2.3 Opportunities
3.2.3.1 Cloud-based Solutions to Cater to Small and Medium Enterprises
3.3 Global Carbon and Energy Software Market Analysis, by Deployment Type
3.3.1 Overview
3.3.2 Global Carbon and Energy Software Market Segment Share, by Deployment Type, 2012 – 2022 (%)
3.3.3 Global Carbon and Energy Software Market Revenue and Forecast, by Deployment Type, 2012 – 2022 (US$ Mn)
3.4 Global Carbon and Energy Software Market Analysis, by End-use Industry
3.4.1 Overview
3.4.2 Global Carbon and Energy Software Market Segment Share, by End-use Industry, 2012 – 2022 (%)
3.4.3 Global Carbon and Energy Software Market Revenue and Forecast, by End-use Industry, 2012 – 2022 (US$ Mn)
3.5 Global Carbon and Energy Software Market Revenue and Forecast, by Geography
3.5.1 North America Carbon and Energy Software Market, 2012 – 2022, Revenue (US$ Mn) and Y-o-Y Growth (%)
3.5.2 Europe Carbon and Energy Software Market, 2012 – 2022, Revenue (US$ Mn) and Y-o-Y Growth (%)
3.5.3 Asia Pacific Carbon and Energy Software Market, 2012 – 2022, Revenue (US$ Mn) and Y-o-Y Growth (%)
3.5.4 Middle East and Africa Carbon and Energy Software Market, 2012 – 2022, Revenue (US$ Mn) and Y-o-Y Growth (%)
3.5.5 Latin America Carbon and Energy Software Market, 2012 – 2022, Revenue (US$ Mn) and Y-o-Y Growth (%)
3.6 Competitive Landscape
Chapter 4 North America Carbon and Energy Software Market Overview
4.1 Market Dynamics and Trends
4.2 North America Carbon and Energy Software Market Analysis, by Deployment Type
4.2.1 Overview
4.2.2 North America Carbon and Energy Software Market Segment Share, by Deployment Type, 2012 – 2022 (%)
4.2.3 North America Carbon and Energy Software Market Revenue and Forecast, by Deployment Type, 2012 – 2022 (US$ Mn)
4.3 North America Carbon and Energy Software Market Segment Share, by End-use Industry
4.3.1 North America Carbon and Energy Software Market Segment Share, by End-use Industry, 2012 – 2022 (%)
4.3.2 North America Carbon and Energy Software Market Revenue and Forecast, by End-use Industry, 2012 – 2022 (US$ Mn)
4.4 North America Carbon and Energy Software Market Segment Share, by Geography
4.4.1 North America Carbon and Energy Software Market Segment Share, by Geography, 2012 – 2022 (%)
4.4.2 U.S. Carbon and Energy Software Market Revenue and Forecast, by Deployment Type, 2012 – 2022 (US$ Mn)
4.4.3 U.S. Carbon and Energy Software Market Revenue and Forecast, by End-use Industry, 2012 – 2022 (US$ Mn)
4.4.4 Rest of North America Carbon and Energy Software Market Revenue and Forecast, by Deployment Type, 2012 – 2022 (US$ Mn)
4.4.5 Rest of North America Carbon and Energy Software Market Revenue and Forecast, by End-use Industry, 2012 – 2022 (US$ Mn)
Chapter 5 Europe Carbon and Energy Software Market Overview
5.1 Market Dynamics and Trends
5.2 Europe Carbon and Energy Software Market Analysis, by Deployment Type
5.2.1 Overview
5.2.2 Europe Carbon and Energy Software Market Segment Share, by Deployment Type, 2012 – 2022 (%)
5.2.3 Europe Carbon and Energy Software Market Revenue and Forecast, by Deployment Type, 2012 – 2022 (US$ Mn)
5.3 Europe Carbon and Energy Software Market Segment Share, by End-use Industry
5.3.1 Europe Carbon and Energy Software Market Segment Share, by End-use Industry, 2012 – 2022 (%)
5.3.2 Europe Carbon and Energy Software Market Revenue and Forecast, by End-use Industry, 2012 – 2022 (US$ Mn)
5.4 Europe Carbon and Energy Software Market Segment Share, by Geography
5.4.1 Europe Carbon and Energy Software Market Segment Share, by Geography, 2012 – 2022 (%)
5.4.2 EU7 Carbon and Energy Software Market Revenue and Forecast, by Deployment Type, 2012 – 2022 (US$ Mn)
5.4.3 EU7 Carbon and Energy Software Market Revenue and Forecast, by End-use Industry, 2012 – 2022 (US$ Mn)
5.4.4 CIS Carbon and Energy Software Market Revenue and Forecast, by Deployment Type, 2012 – 2022 (US$ Mn)
5.4.5 CIS Carbon and Energy Software Market Revenue and Forecast, by End-use Industry, 2012 – 2022 (US$ Mn)
5.4.6 Rest of Europe Carbon and Energy Software Market Revenue and Forecast, by Deployment Type, 2012 – 2022 (US$ Mn)
5.4.7 Rest of Europe Carbon and Energy Software Market Revenue and Forecast, by End-use Industry, 2012 – 2022 (US$ Mn)
Chapter 6 Asia Pacific Carbon and Energy Software Market Overview
6.1 Market Dynamics and Trends
6.2 Asia Pacific Carbon and Energy Software Market Analysis, by Deployment Type
6.2.1 Overview
6.2.2 Asia Pacific Carbon and Energy Software Market Segment Share, by Deployment Type, 2012 – 2022 (%)
6.2.3 Asia Pacific Carbon and Energy Software Market Revenue and Forecast, by Deployment Type, 2012 – 2022 (US$ Mn)
6.3 Asia Pacific Carbon and Energy Software Market Segment Share, by End-use Industry
6.3.1 Asia Pacific Carbon and Energy Software Market Segment Share, by End-use Industry, 2012 – 2022 (%)
6.3.2 Asia Pacific Carbon and Energy Software Market Revenue and Forecast, by End-use Industry, 2012 – 2022 (US$ Mn)
6.4 Asia Pacific Carbon and Energy Software Market Segment Share, by Geography
6.4.1 Asia Pacific Carbon and Energy Software Market Segment Share, by Geography, 2012 – 2022 (%)
6.4.2 Japan Carbon and Energy Software Market Revenue and Forecast, by Deployment Type, 2012 – 2022 (US$ Mn)
6.4.3 Japan Carbon and Energy Software Market Revenue and Forecast, by End-use Industry, 2012 – 2022 (US$ Mn)
6.4.4 China Carbon and Energy Software Market Revenue and Forecast, by Deployment Type, 2012 – 2022 (US$ Mn)
6.4.5 China Carbon and Energy Software Market Revenue and Forecast, by End-use Industry, 2012 – 2022 (US$ Mn)
6.4.6 South Asia Carbon and Energy Software Market Revenue and Forecast, by Deployment Type, 2012 – 2022 (US$ Mn)
6.4.7 South Asia Carbon and Energy Software Market Revenue and Forecast, by End-use Industry, 2012 – 2022 (US$ Mn)
6.4.8 Australasia Carbon and Energy Software Market Revenue and Forecast, by Deployment Type, 2012 – 2022 (US$ Mn)
6.4.9 Australasia Carbon and Energy Software Market Revenue and Forecast, by End-use Industry, 2012 – 2022 (US$ Mn)
6.4.10 Rest of Asia Pacific Carbon and Energy Software Market Revenue and Forecast, by Deployment Type, 2012 – 2022 (US$ Mn)
6.4.11 Rest of Asia Pacific Carbon and Energy Software Market Revenue and Forecast, by End-use Industry, 2012 – 2022 (US$ Mn)
Chapter 7 Middle East and Africa Carbon and Energy Software Market Overview
7.1 Market Dynamics and Trends
7.2 Middle East and Africa Carbon and Energy Software Market Analysis, by Deployment Type
7.2.1 Overview
7.2.2 Middle East and Africa Carbon and Energy Software Market Segment Share, by Deployment Type, 2012 – 2022 (%)
7.2.3 Middle East and Africa Carbon and Energy Software Market Revenue and Forecast, by Deployment Type, 2012 – 2022 (US$ Mn)
7.3 Middle East and Africa Carbon and Energy Software Market Segment Share, by End-use Industry
7.3.1 Middle East and Africa Carbon and Energy Software Market Segment Share, by End-use Industry, 2012 – 2022 (%)
7.3.2 Middle East and Africa Carbon and Energy Software Market Revenue and Forecast, by End-use Industry, 2012 – 2022 (US$ Mn)
7.4 Middle East and Africa Carbon and Energy Software Market Segment Share, by Geography
7.4.1 Middle East and Africa Carbon and Energy Software Market Segment Share, by Geography, 2012 – 2022 (%)
7.4.2 GCC Countries Carbon and Energy Software Market Revenue and Forecast, by Deployment Type, 2012 – 2022 (US$ Mn)
7.4.3 GCC Countries Carbon and Energy Software Market Revenue and Forecast, by End-use Industry, 2012 – 2022 (US$ Mn)
7.4.4 North Africa Carbon and Energy Software Market Revenue and Forecast, by Deployment Type, 2012 – 2022 (US$ Mn)
7.4.5 North Africa Carbon and Energy Software Market Revenue and Forecast, by End-use Industry, 2012 – 2022 (US$ Mn)
7.4.6 South Africa Carbon and Energy Software Market Revenue and Forecast, by Deployment Type, 2012 – 2022 (US$ Mn)
7.4.7 South Africa Carbon and Energy Software Market Revenue and Forecast, by End-use Industry, 2012 – 2022 (US$ Mn)
7.4.8 Rest of Middle East and Africa Carbon and Energy Software Market Revenue and Forecast, by Deployment Type, 2012 – 2022 (US$ Mn)
7.4.9 Rest of Middle East and Africa Carbon and Energy Software Market Revenue and Forecast, by End-use Industry, 2012 – 2022 (US$ Mn)
Chapter 8 Latin America Carbon and Energy Software Market Overview
8.1 Market Dynamics and Trends
8.2 Latin America Carbon and Energy Software Market Analysis, by Deployment Type
8.2.1 Overview
8.2.2 Latin America Carbon and Energy Software Market Segment Share, by Deployment Type, 2012 – 2022 (%)
8.2.3 Latin America Carbon and Energy Software Market Revenue and Forecast, by Deployment Type, 2012 – 2022 (US$ Mn)
8.3 Latin America Carbon and Energy Software Market Segment Share, by End-use Industry
8.3.1 Latin America Carbon and Energy Software Market Segment Share, by End-use Industry, 2012 – 2022 (%)
8.3.2 Latin America Carbon and Energy Software Market Revenue and Forecast, by End-use Industry, 2012 – 2022 (US$ Mn)
8.4 Latin America Carbon and Energy Software Market Segment Share, by Geography
8.4.1 Latin America Carbon and Energy Software Market Segment Share, by Geography, 2012 – 2022 (%)
8.4.2 Brazil Carbon and Energy Software Market Revenue and Forecast, by Deployment Type, 2012 – 2022 (US$ Mn)
8.4.3 Brazil Carbon and Energy Software Market Revenue and Forecast, by End-use Industry, 2012 – 2022 (US$ Mn)
8.4.4 Rest of Latin America Carbon and Energy Software Market Revenue and Forecast, by Deployment Type, 2012 – 2022 (US$ Mn)
8.4.5 Rest of Latin America Carbon and Energy Software Market Revenue and Forecast, by End-use Industry, 2012 – 2022 (US$ Mn)
Chapter 9 Company Profiles
9.1 CA Technologies Inc
9.2 Enablon North America Corporation
9.3 IBM Corporation
9.4 Intelex Technologies Inc
9.5 SAP SE
9.6 Enviance Inc
9.7 IHS Inc
9.8 ProcessMap Corporation
9.9 Thinkstep AG
9.10 Verisae Inc
List of Tables
TABLE 1 Market Snapshot: Global Carbon and Energy Software Market (2013 and 2022)
TABLE 2 Global Carbon and Energy Software Market Segment Share, by Deployment Type, 2012 – 2022 (%)
TABLE 3 Global Carbon and Energy Software Market Revenue and Forecast, by Deployment Type, 2012 – 2022 (US$ Mn)
TABLE 4 Global Carbon and Energy Software Market Segment Share, by End-use Industry, 2012 – 2022 (%)
TABLE 5 Global Carbon and Energy Software Market Revenue and Forecast, by End-use Industry, 2012 – 2022 (US$ Mn)
TABLE 6 Market Positioning of Key Players, 2013
TABLE 7 North America Carbon and Energy Software Market Segment Share, by Deployment Type, 2012 – 2022 (%)
TABLE 8 North America Carbon and Energy Software Market Revenue and Forecast, by Deployment Type, 2012 – 2022 (US$ Mn)
TABLE 9 North America Carbon and Energy Software Market Segment Share, by End-use Industry, 2012 – 2022 (%)
TABLE 10 North America Carbon and Energy Software Market Revenue and Forecast, by End-use Industry, 2012 – 2022 (US$ Mn)
TABLE 11 North America Carbon and Energy Software Market Segment Share, by Geography, 2012 – 2022 (%)
TABLE 12 U.S. Carbon and Energy Software Market Revenue and Forecast, by Deployment Type, 2012 – 2022 (US$ Mn)
TABLE 13 U.S. Carbon and Energy Software Market Revenue and Forecast, by End-use Industry, 2012 – 2022 (US$ Mn)
TABLE 14 Rest of North America Carbon and Energy Software Market Revenue and Forecast, by Deployment Type, 2012 – 2022 (US$ Mn)
TABLE 15 Rest of North America Carbon and Energy Software Market Revenue and Forecast, by End-use Industry, 2012 – 2022 (US$ Mn)
TABLE 16 Europe Carbon and Energy Software Market Segment Share, by Deployment Type, 2012 – 2022 (%)
TABLE 17 Europe Carbon and Energy Software Market Revenue and Forecast, by Deployment Type, 2012 – 2022 (US$ Mn)
TABLE 18 Europe Carbon and Energy Software Market Segment Share, by End-use Industry, 2012 – 2022 (%)
TABLE 19 Europe Carbon and Energy Software Market Revenue and Forecast, by End-use Industry, 2012 – 2022 (US$ Mn)
TABLE 20 Europe Carbon and Energy Software Market Segment Share, by Geography, 2012 – 2022 (%)
TABLE 21 EU7 Carbon and Energy Software Market Revenue and Forecast, by Deployment Type, 2012 – 2022 (US$ Mn)
TABLE 22 EU7 Carbon and Energy Software Market Revenue and Forecast, by End-use Industry, 2012 – 2022 (US$ Mn)
TABLE 23 CIS Carbon and Energy Software Market Revenue and Forecast, by Deployment Type, 2012 – 2022 (US$ Mn)
TABLE 24 CIS Carbon and Energy Software Market Revenue and Forecast, by End-use Industry, 2012 – 2022 (US$ Mn)
TABLE 25 Rest of Europe Carbon and Energy Software Market Revenue and Forecast, by Deployment Type, 2012 – 2022 (US$ Mn)
TABLE 26 Rest of Europe Carbon and Energy Software Market Revenue and Forecast, by End-use Industry, 2012 – 2022 (US$ Mn)
TABLE 27 Asia Pacific Carbon and Energy Software Market Segment Share, by Deployment Type, 2012 – 2022 (%)
TABLE 28 Asia Pacific Carbon and Energy Software Market Revenue and Forecast, by Deployment Type, 2012 – 2022 (US$ Mn)
TABLE 29 Asia Pacific Carbon and Energy Software Market Segment Share, by End-use Industry, 2012 – 2022 (%)
TABLE 30 Asia Pacific Carbon and Energy Software Market Revenue and Forecast, by End-use Industry, 2012 – 2022 (US$ Mn)
TABLE 31 Asia Pacific Carbon and Energy Software Market Segment Share, by Geography, 2012 – 2022 (%)
TABLE 32 Japan Carbon and Energy Software Market Revenue and Forecast, by Deployment Type, 2012 – 2022 (US$ Mn)
TABLE 33 Japan Carbon and Energy Software Market Revenue and Forecast, by End-use Industry, 2012 – 2022 (US$ Mn)
TABLE 34 China Carbon and Energy Software Market Revenue and Forecast, by Deployment Type, 2012 – 2022 (US$ Mn)
TABLE 35 China Carbon and Energy Software Market Revenue and Forecast, by End-use Industry, 2012 – 2022 (US$ Mn)
TABLE 36 South Asia Carbon and Energy Software Market Revenue and Forecast, by Deployment Type, 2012 – 2022 (US$ Mn)
TABLE 37 South Asia Carbon and Energy Software Market Revenue and Forecast, by End-use Industry, 2012 – 2022 (US$ Mn)
TABLE 38 Australasia Carbon and Energy Software Market Revenue and Forecast, by Deployment Type, 2012 – 2022 (US$ Mn)
TABLE 39 Australasia Carbon and Energy Software Market Revenue and Forecast, by End-use Industry, 2012 – 2022 (US$ Mn)
TABLE 40 Rest of Asia Pacific Carbon and Energy Software Market Revenue and Forecast, by Deployment Type, 2012 – 2022 (US$ Mn)
TABLE 41 Rest of Asia Pacific Carbon and Energy Software Market Revenue and Forecast, by End-use Industry, 2012 – 2022 (US$ Mn)
TABLE 42 Middle East and Africa Carbon and Energy Software Market Segment Share, by Deployment Type, 2012 – 2022 (%)
TABLE 43 Middle East and Africa Carbon and Energy Software Market Revenue and Forecast, by Deployment Type, 2012 – 2022 (US$ Mn)
TABLE 44 Middle East and Africa Carbon and Energy Software Market Segment Share, by End-use Industry, 2012 – 2022 (%)
TABLE 45 Middle East and Africa Carbon and Energy Software Market Revenue and Forecast, by End-use Industry, 2012 – 2022 (US$ Mn)
TABLE 46 Middle East and Africa Carbon and Energy Software Market Segment Share, by Geography, 2012 – 2022 (%)
TABLE 47 GCC Countries Carbon and Energy Software Market Revenue and Forecast, by Deployment Type, 2012 – 2022 (US$ Mn)
TABLE 48 GCC Countries Carbon and Energy Software Market Revenue and Forecast, by End-use Industry, 2012 – 2022 (US$ Mn)
TABLE 49 North Africa Carbon and Energy Software Market Revenue and Forecast, by Deployment Type, 2012 – 2022 (US$ Mn)
TABLE 50 North Africa Carbon and Energy Software Market Revenue and Forecast, by End-use Industry, 2012 – 2022 (US$ Mn)
TABLE 51 South Africa Carbon and Energy Software Market Revenue and Forecast, by Deployment Type, 2012 – 2022 (US$ Mn)
TABLE 52 South Africa Carbon and Energy Software Market Revenue and Forecast, by End-use Industry, 2012 – 2022 (US$ Mn)
TABLE 53 Rest of Middle East and Africa Carbon and Energy Software Market Revenue and Forecast, by Deployment Type, 2012 – 2022 (US$ Mn)
TABLE 54 Rest of Middle East and Africa Carbon and Energy Software Market Revenue and Forecast, by End-use Industry, 2012 – 2022 (US$ Mn)
TABLE 55 Latin America Carbon and Energy Software Market Segment Share, by Deployment Type, 2012 – 2022 (%)
TABLE 56 Latin America Carbon and Energy Software Market Revenue and Forecast, by Deployment Type, 2012 – 2022 (US$ Mn)
TABLE 57 Latin America Carbon and Energy Software Market Segment Share, by End-use Industry, 2012 – 2022 (%)
TABLE 58 Latin America Carbon and Energy Software Market Revenue and Forecast, by End-use Industry, 2012 – 2022 (US$ Mn)
TABLE 59 Latin America Carbon and Energy Software Market Segment Share, by Geography, 2012 – 2022 (%)
TABLE 60 Brazil Carbon and Energy Software Market Revenue and Forecast, by Deployment Type, 2012 – 2022 (US$ Mn)
TABLE 61 Brazil Carbon and Energy Software Market Revenue and Forecast, by End-use Industry, 2012 – 2022 (US$ Mn)
TABLE 62 Rest of Latin America Carbon and Energy Software Market Revenue and Forecast, by Deployment Type, 2012 – 2022 (US$ Mn)
TABLE 63 Rest of Latin America Carbon and Energy Software Market Revenue and Forecast, by End-use Industry, 2012 – 2022 (US$ Mn)
List of Figures
FIG. 1 Market Segmentation: Global Carbon and Energy Software Market
FIG. 2 Global Carbon and Energy Software Market, 2012 – 2022, Revenue (US$ Mn) and Y-o-Y Growth (%)
FIG. 3 Global Carbon and Energy Software Market, by Deployment Type, 2013 (US$ Mn)
FIG. 4 Global Carbon and Energy Software Market, by End-use Industry, 2013 (US$ Mn)
FIG. 5 North America Carbon and Energy Software Market, 2012 – 2022, Revenue (US$ Mn) and Y-o-Y Growth (%)
FIG. 6 Europe Carbon and Energy Software Market, 2012 – 2022, Revenue (US$ Mn) and Y-o-Y Growth (%)
FIG. 7 Asia Pacific Carbon and Energy Software Market, 2012 – 2022, Revenue (US$ Mn) and Y-o-Y Growth (%)
FIG. 8 Middle East and Africa Carbon and Energy Software Market, 2012 – 2022, Revenue (US$ Mn) and Y-o-Y Growth (%)
FIG. 9 Latin America Carbon and Energy Software Market, 2012 – 2022, Revenue (US$ Mn) and Y-o-Y Growth (%)