
Analysts’ Viewpoint on Market Scenario
Surge in demand for high-powered compact electronic devices is driving the global integrated passive device market. Apart from consumer electronics, integrated passive devices (IPDs) are used in various end-use industries such as automotive, energy & utility, aerospace & defense, healthcare, and IT & telecommunication. Rise in penetration of the Internet of Things (IoT) and 5G technology is contributing to market growth.
Furthermore, increase in adoption of integrated passive components in LED, RF modules, WLAN, GPS systems, and Bluetooth is expected to fuel integrated passive device market development in the next few years. Rise in demand for electric vehicles and smartphones packed with 5G technologies is expected to boost integrated passive device market share during the forecast period. Integrated passive device manufacturers are likely to grab incremental opportunities by integrating IPDs in different wearable devices in the next few years.
Baluns, filters, couplers, diplexers, resonators, power splitters/combiners, attenuators, etc., are the various types of integrated passive devices. Integrated passive device market demand is expected to rise in the near future, due to increase in usage of filters and diplexers in wireless system applications. IoT applications of passive electronic components such as resistors, capacitors, and inductors are creating lucrative opportunities for manufacturers.
IPDs are being increasingly used in smart appliances, smart TVs, and wearable & hearable devices. They are also being utilized in consumer electronic products such as set-top boxes, wireless speakers, routers, drones, and gaming systems. Moreover, the integrated passive device market size is increasing due to the advancement in M2M communication technology.
Request a sample to get extensive insights into the Integrated Passive Device Market
Demand for high-speed mobile communication is rising consistently; however, the current ceramic filters have some constraints in thin modules and high-frequency applications. IPDs developed using glass thin films are increasingly being preferred over IPDs developed using through-silicon via (TSV) substrate.
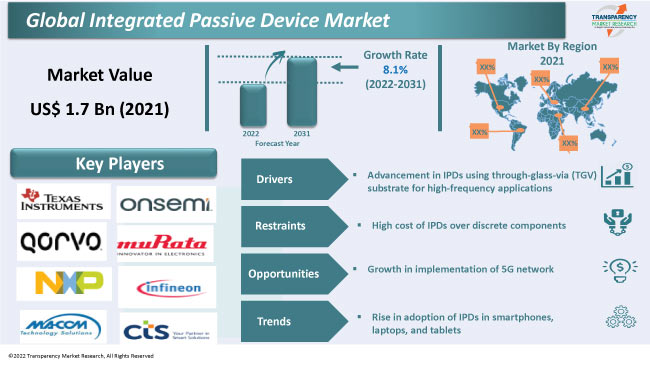
Glass substrate became progressively popular in passive device fabrication due to its high thermal stability, low dielectric loss, high resistivity, and adjustable coefficient of thermal expansion. Therefore, advancement in IPDs using through-glass-via (TGV) substrate is anticipated to augment the integrated passive device business growth during the forecast period.
Key players in the market are focusing on the development of efficient and reliable passive devices for the adoption of 5G network. This is expected to contribute to market growth in the next few years. Integrated passive devices offer excellent stability in harsh environments. These devices are suitable for 5G telecom equipment, due to their high power. 5G telecom networks are expected to gain tremendous popularity in the near future as they deliver faster data and better connections for smartphones, industrial applications, self-driving cars, and smart cities. 5G phone networks are causing an exponential increase in global data traffic and mobile data, which must be supported by electronic hardware and infrastructure.
IPDs are used in several applications such as telecom base stations and other internet networking hardware due to their stability and reliability. Small dimensions, compact size, stable parameters in a broad range of temperatures, and long-term reliability are some of the major requirements of 5G components. Demand for passive components increased significantly in 2020 despite the pandemic's threat to overall economic growth. Demand is expected to increase during the forecast period.
According to IDC, global smartphone shipments are expected to reach 1.54 billion units in 2025 with a compound annual growth rate (CAGR) of 3.9% from 2020 to 2025. This growth is attributed primarily to emerging countries in South Asia and Middle East & Africa, where demand for smartphones is strong due to the lower penetration of smartphones. Therefore, rise in demand for smartphones across the globe is likely to have a positive impact on the adoption of integrated passive device technologies during the forecast period.
Request a custom report on Integrated Passive Device Market
According to the integrated passive device market research report, North America is expected to hold major share of the global market during the forecast period. This is due to the increase in penetration of the internet of things (IoT), rise in investment in 5G communication, and expansion of semiconductor sector in the region. Furthermore, rise in demand for IPDs in consumer durables is fueling integrated passive device industry growth in the near future.
Furthermore, region-wise analysis of the integrated passive device market forecast report also revealed that Asia Pacific and Europe accounted for a significant share of the global market in 2021. Growth in adoption of in-vehicle infotainment systems is driving the integrated passive devices market demand in the automotive sector in Europe. Ultra-miniaturized RF passive devices are largely installed in GPS, instrument clusters, and other electronic devices.
This business is consolidated with the presence of a few large-scale entities controlling majority of the global integrated passive device industry share. Key players operating in the global market are CTS Corporation, Global Communication Semiconductors, LLC, Infineion Technologies AG, Johanson Technology, Inc, MACOM, Murata Manufacturing Co., Ltd., NXP Semiconductors, ON Semiconductors, Qurvo, Inc., STMicroelectronics and Texas Instruments Incorporated. These players are engaged in implementing productive strategies to mark their presence in the global integrated passive device.
The global integrated passive device market report profiles these key players based on financial overview, product portfolio, company overview, business segments, business strategies, and recent developments.
|
Attribute |
Detail |
|
Market Size Value in 2021 |
US$ 1.7 Bn |
|
Market Forecast Value in 2031 |
US$ 3.6 Bn |
|
Growth Rate (CAGR) |
8.1% |
|
Forecast Period |
2022–2031 |
|
Historical Data Available for |
2017–2020 |
|
Quantitative Units |
US$ Bn for Value & Million Units for Volume |
|
Market Analysis |
It includes cross segment analysis at global as well as regional level. Furthermore, qualitative analysis includes drivers, restraints, opportunities, key trends, Porter’s Five Forces analysis, value chain analysis, and key trend analysis and COVID-19 Impact Analysis. |
|
Competition Landscape |
|
|
Format |
Electronic (PDF) + Excel |
|
Market Segmentation |
|
|
Regions Covered |
|
|
Countries Covered |
|
|
Companies Profiled |
|
|
Customization Scope |
Available upon request |
|
Pricing |
Available upon request |
It stood at US$ 1.7 Bn in 2021.
It is expected to advance at a CAGR of 8.1% from 2022 to 2031.
It is likely to reach 3.6 Bn in 2031.
Advancement in IPDs using through-glass-via (TGV) substrate for high-frequency applications, growth in implementation of 5G network, and rise in adoption of IPDs in smartphones, laptops, and tablets.
Asia Pacific was a more lucrative region for vendors in 2021.
Murata Manufacturing Co., Ltd., NXP Semiconductors, ON Semiconductors, Qurvo, Inc., STMicroelectronics, and Texas Instruments Incorporated.
1. Preface
1.1. Market Introduction
1.2. Market and Segments Definition
1.3. Market Taxonomy
1.4. Research Methodology
1.5. Assumption and Acronyms
2. Executive Summary
2.1. Global Integrated Passive Device Market Overview
2.2. Regional Outline
2.3. Industry Outline
2.4. Market Dynamics Snapshot
2.5. Competition Blueprint
3. Market Dynamics
3.1. Macro-economic Factors
3.2. Drivers
3.3. Restraints
3.4. Opportunities
3.5. Key Trends
3.6. Regulatory Framework
4. Associated Industry and Key Indicator Assessment
4.1. Parent Industry Overview - Global Integrated Passive Device (IPD) Technology Industry Overview
4.2. Supply Chain Analysis
4.3. Pricing Analysis
4.4. Technology Roadmap
4.5. Industry SWOT Analysis
4.6. Porter’s Five Forces Analysis
4.7. COVID-19 Impact and Recovery Analysis
5. Global Integrated Passive Device Market Analysis, by Passive Devices
5.1. Integrated Passive Device Market Size (US$ Mn) and Volume (Million Units) Analysis & Forecast, By Passive Devices, 2017–2031
5.1.1. Baluns
5.1.2. Filters
5.1.3. Couplers
5.1.4. Diplexers
5.1.5. Resonators
5.1.6. Others
5.2. Market Attractiveness Analysis, By Passive Devices
6. Global Integrated Passive Device Market Analysis, by Substrate
6.1. Integrated Passive Device Market Size (US$ Mn) Analysis & Forecast, By Substrate, 2017–2031
6.1.1. Silicon
6.1.2. Glass Wafer
6.1.3. GaAs
6.1.4. Ceramic
6.2. Market Attractiveness Analysis, By Substrate
7. Global Integrated Passive Device Market Analysis, by Packaging
7.1. Integrated Passive Device Market Size (US$ Mn) Analysis & Forecast, By Packaging, 2017–2031
7.1.1. Wire Bonding
7.1.2. SIL
7.1.3. QFN
7.1.4. Chip-scale Package
7.1.5. Wafer Level Package
7.1.6. Others
7.2. Market Attractiveness Analysis, By Packaging
8. Global Integrated Passive Device Market Analysis, by Application
8.1. Integrated Passive Device Market Size (US$ Mn) Analysis & Forecast, By Application, 2017–2031
8.1.1. LED
8.1.2. RF Module
8.1.3. Ultra-wideband
8.1.4. WLAN
8.1.5. GPS System
8.1.6. Others
8.2. Market Attractiveness Analysis, By Application
9. Global Integrated Passive Device Market Analysis, by End-use Industry
9.1. Integrated Passive Device Market Size (US$ Mn) Analysis & Forecast, By End-use Industry, 2017–2031
9.1.1. Automotive
9.1.2. Aerospace & Defense
9.1.3. Consumer Electronics
9.1.4. Healthcare
9.1.5. Others
9.2. Market Attractiveness Analysis, By End-use Industry
10. Global Integrated Passive Device Market Analysis and Forecast, By Region
10.1. Integrated Passive Device Market Size (US$ Mn) and Volume (Million Units) Analysis & Forecast, By Region, 2017–2031
10.1.1. North America
10.1.2. Europe
10.1.3. Asia Pacific
10.1.4. Middle East & Africa
10.1.5. South America
10.2. Market Attractiveness Analysis, By Region
11. North America Integrated Passive Device Market Analysis and Forecast
11.1. Market Snapshot
11.2. Drivers and Restraints: Impact Analysis
11.3. Integrated Passive Device Market Size (US$ Mn) and Volume (Million Units) Analysis & Forecast, By Passive Devices, 2017–2031
11.3.1. Baluns
11.3.2. Filters
11.3.3. Couplers
11.3.4. Diplexers
11.3.5. Resonators
11.3.6. Others
11.4. Integrated Passive Device Market Size (US$ Mn) Analysis & Forecast, By Substrate, 2017–2031
11.4.1. Silicon
11.4.2. Glass Wafer
11.4.3. GaAs
11.4.4. Ceramic
11.5. Integrated Passive Device Market Size (US$ Mn) Analysis & Forecast, By Packaging, 2017–2031
11.5.1. Wire Bonding
11.5.2. SIL
11.5.3. QFN
11.5.4. Chip-scale Package
11.5.5. Wafer Level Package
11.5.6. Others
11.6. Integrated Passive Device Market Size (US$ Mn) Analysis & Forecast, By Application, 2017–2031
11.6.1. LED
11.6.2. RF Module
11.6.3. Ultra-wideband
11.6.4. WLAN
11.6.5. GPS System
11.6.6. Others
11.7. Integrated Passive Device Market Size (US$ Mn) Analysis & Forecast, By End-use Industry, 2017–2031
11.7.1. Automotive
11.7.2. Aerospace & Defense
11.7.3. Consumer Electronics
11.7.4. Healthcare
11.7.5. Others
11.8. Integrated Passive Device Market Size (US$ Mn) and Volume (Million Units) Analysis & Forecast, By Country and Sub-region, 2017–2031
11.8.1. U.S.
11.8.2. Canada
11.8.3. Rest of North America
11.9. Market Attractiveness Analysis
11.9.1. By Passive Devices
11.9.2. By Substrate
11.9.3. By Packaging
11.9.4. By Application
11.9.5. By End-use Industry
11.9.6. By Country/Sub-region
12. Europe Integrated Passive Device Market Analysis and Forecast
12.1. Market Snapshot
12.2. Drivers and Restraints: Impact Analysis
12.3. Integrated Passive Device Market Size (US$ Mn) and Volume (Million Units) Analysis & Forecast, By Passive Devices, 2017–2031
12.3.1. Baluns
12.3.2. Filters
12.3.3. Couplers
12.3.4. Diplexers
12.3.5. Resonators
12.3.6. Others
12.4. Integrated Passive Device Market Size (US$ Mn) Analysis & Forecast, By Substrate, 2017–2031
12.4.1. Silicon
12.4.2. Glass Wafer
12.4.3. GaAs
12.4.4. Ceramic
12.5. Integrated Passive Device Market Size (US$ Mn) Analysis & Forecast, By Packaging, 2017–2031
12.5.1. Wire Bonding
12.5.2. SIL
12.5.3. QFN
12.5.4. Chip-scale Package
12.5.5. Wafer Level Package
12.5.6. Others
12.6. Integrated Passive Device Market Size (US$ Mn) Analysis & Forecast, By Application, 2017–2031
12.6.1. LED
12.6.2. RF Module
12.6.3. Ultra-wideband
12.6.4. WLAN
12.6.5. GPS System
12.6.6. Others
12.7. Integrated Passive Device Market Size (US$ Mn) Analysis & Forecast, By End-use Industry, 2017–2031
12.7.1. Automotive
12.7.2. Aerospace & Defense
12.7.3. Consumer Electronics
12.7.4. Healthcare
12.7.5. Others
12.8. Integrated Passive Device Market Size (US$ Mn) and Volume (Million Units) Analysis & Forecast, By Country and Sub-region, 2017–2031
12.8.1. The U.K.
12.8.2. Germany
12.8.3. France
12.8.4. Rest of Europe
12.9. Market Attractiveness Analysis
12.9.1. By Passive Devices
12.9.2. By Substrate
12.9.3. By Packaging
12.9.4. By Application
12.9.5. By End-use Industry
12.9.6. By Country/Sub-region
13. Asia Pacific Integrated Passive Device Market Analysis and Forecast
13.1. Market Snapshot
13.2. Drivers and Restraints: Impact Analysis
13.3. Integrated Passive Device Market Size (US$ Mn) and Volume (Million Units) Analysis & Forecast, By Passive Devices, 2017–2031
13.3.1. Baluns
13.3.2. Filters
13.3.3. Couplers
13.3.4. Diplexers
13.3.5. Resonators
13.3.6. Others
13.4. Integrated Passive Device Market Size (US$ Mn) Analysis & Forecast, By Substrate, 2017–2031
13.4.1. Silicon
13.4.2. Glass Wafer
13.4.3. GaAs
13.4.4. Ceramic
13.5. Integrated Passive Device Market Size (US$ Mn) Analysis & Forecast, By Packaging, 2017–2031
13.5.1. Wire Bonding
13.5.2. SIL
13.5.3. QFN
13.5.4. Chip-scale Package
13.5.5. Wafer Level Package
13.5.6. Others
13.6. Integrated Passive Device Market Size (US$ Mn) Analysis & Forecast, By Application, 2017–2031
13.6.1. LED
13.6.2. RF Module
13.6.3. Ultra-wideband
13.6.4. WLAN
13.6.5. GPS System
13.6.6. Others
13.7. Integrated Passive Device Market Size (US$ Mn) Analysis & Forecast, By End-use Industry, 2017–2031
13.7.1. Automotive
13.7.2. Aerospace & Defense
13.7.3. Consumer Electronics
13.7.4. Healthcare
13.7.5. Others
13.8. Integrated Passive Device Market Size (US$ Mn) and Volume (Million Units) Analysis & Forecast, By Country and Sub-region, 2017–2031
13.8.1. China
13.8.2. Japan
13.8.3. Taiwan
13.8.4. South Korea
13.8.5. Rest of Asia Pacific
13.9. Market Attractiveness Analysis
13.9.1. By Passive Devices
13.9.2. By Substrate
13.9.3. By Packaging
13.9.4. By Application
13.9.5. By End-use Industry
13.9.6. By Country/Sub-region
14. Middle East & Africa Integrated Passive Device Market Analysis and Forecast
14.1. Market Snapshot
14.2. Drivers and Restraints: Impact Analysis
14.3. Integrated Passive Device Market Size (US$ Mn) and Volume (Million Units) Analysis & Forecast, By Passive Devices, 2017–2031
14.3.1. Baluns
14.3.2. Filters
14.3.3. Couplers
14.3.4. Diplexers
14.3.5. Resonators
14.3.6. Others
14.4. Integrated Passive Device Market Size (US$ Mn) Analysis & Forecast, By Substrate, 2017–2031
14.4.1. Silicon
14.4.2. Glass Wafer
14.4.3. GaAs
14.4.4. Ceramic
14.5. Integrated Passive Device Market Size (US$ Mn) Analysis & Forecast, By Packaging, 2017–2031
14.5.1. Wire Bonding
14.5.2. SIL
14.5.3. QFN
14.5.4. Chip-scale Package
14.5.5. Wafer Level Package
14.5.6. Others
14.6. Integrated Passive Device Market Size (US$ Mn) Analysis & Forecast, By Application, 2017–2031
14.6.1. LED
14.6.2. RF Module
14.6.3. Ultra-wideband
14.6.4. WLAN
14.6.5. GPS System
14.6.6. Others
14.7. Integrated Passive Device Market Size (US$ Mn) Analysis & Forecast, By End-use Industry, 2017–2031
14.7.1. Automotive
14.7.2. Aerospace & Defense
14.7.3. Consumer Electronics
14.7.4. Healthcare
14.7.5. Others
14.8. Integrated Passive Device Market Size (US$ Mn) and Volume (Million Units) Analysis & Forecast, By Country and Sub-region, 2017–2031
14.8.1. GCC
14.8.2. South Africa
14.8.3. Rest of Middle East & Africa
14.9. Market Attractiveness Analysis
14.9.1. By Passive Devices
14.9.2. By Substrate
14.9.3. By Packaging
14.9.4. By Application
14.9.5. By End-use Industry
14.9.6. By Country/Sub-region
15. South America Integrated Passive Device Market Analysis and Forecast
15.1. Market Snapshot
15.2. Drivers and Restraints: Impact Analysis
15.3. Integrated Passive Device Market Size (US$ Mn) and Volume (Million Units) Analysis & Forecast, By Passive Devices, 2017–2031
15.3.1. Baluns
15.3.2. Filters
15.3.3. Couplers
15.3.4. Diplexers
15.3.5. Resonators
15.3.6. Others
15.4. Integrated Passive Device Market Size (US$ Mn) Analysis & Forecast, By Substrate, 2017–2031
15.4.1. Silicon
15.4.2. Glass Wafer
15.4.3. GaAs
15.4.4. Ceramic
15.5. Integrated Passive Device Market Size (US$ Mn) Analysis & Forecast, By Packaging, 2017–2031
15.5.1. Wire Bonding
15.5.2. SIL
15.5.3. QFN
15.5.4. Chip-scale Package
15.5.5. Wafer Level Package
15.5.6. Others
15.6. Integrated Passive Device Market Size (US$ Mn) Analysis & Forecast, By Application, 2017–2031
15.6.1. LED
15.6.2. RF Module
15.6.3. Ultra-wideband
15.6.4. WLAN
15.6.5. GPS System
15.6.6. Others
15.7. Integrated Passive Device Market Size (US$ Mn) Analysis & Forecast, By End-use Industry, 2017–2031
15.7.1. Automotive
15.7.2. Aerospace & Defense
15.7.3. Consumer Electronics
15.7.4. Healthcare
15.7.5. Others
15.8. Integrated Passive Device Market Size (US$ Mn) and Volume (Million Units) Analysis & Forecast, By Country and Sub-region, 2017–2031
15.8.1. Brazil
15.8.2. Rest of South America
15.9. Market Attractiveness Analysis
15.9.1. By Passive Devices
15.9.2. By Substrate
15.9.3. By Packaging
15.9.4. By Application
15.9.5. By End-use Industry
15.9.6. By Country/Sub-region
16. Competition Assessment
16.1. Global Integrated Passive Device Market Competition Matrix - a Dashboard View
16.1.1. Global Integrated Passive Device Market Company Share Analysis, by Value (2021)
16.1.2. Technological Differentiator
17. Company Profiles (Global Manufacturers/Suppliers)
17.1. Broadcom
17.1.1. Overview
17.1.2. Product Portfolio
17.1.3. Sales Footprint
17.1.4. Key Subsidiaries or Distributors
17.1.5. Strategy and Recent Developments
17.1.6. Key Financials
17.2. CTS Corporation
17.2.1. Overview
17.2.2. Product Portfolio
17.2.3. Sales Footprint
17.2.4. Key Subsidiaries or Distributors
17.2.5. Strategy and Recent Developments
17.2.6. Key Financials
17.3. Global Communication Semiconductors, LLC
17.3.1. Overview
17.3.2. Product Portfolio
17.3.3. Sales Footprint
17.3.4. Key Subsidiaries or Distributors
17.3.5. Strategy and Recent Developments
17.3.6. Key Financials
17.4. Infineon Technologies AG
17.4.1. Overview
17.4.2. Product Portfolio
17.4.3. Sales Footprint
17.4.4. Key Subsidiaries or Distributors
17.4.5. Strategy and Recent Developments
17.4.6. Key Financials
17.5. Johanson Technology, Inc.
17.5.1. Overview
17.5.2. Product Portfolio
17.5.3. Sales Footprint
17.5.4. Key Subsidiaries or Distributors
17.5.5. Strategy and Recent Developments
17.5.6. Key Financials
17.6. MACOM
17.6.1. Overview
17.6.2. Product Portfolio
17.6.3. Sales Footprint
17.6.4. Key Subsidiaries or Distributors
17.6.5. Strategy and Recent Developments
17.6.6. Key Financials
17.7. Murata Manufacturing Co., Ltd.
17.7.1. Overview
17.7.2. Product Portfolio
17.7.3. Sales Footprint
17.7.4. Key Subsidiaries or Distributors
17.7.5. Strategy and Recent Developments
17.7.6. Key Financials
17.8. NXP Semiconductors
17.8.1. Overview
17.8.2. Product Portfolio
17.8.3. Sales Footprint
17.8.4. Key Subsidiaries or Distributors
17.8.5. Strategy and Recent Developments
17.8.6. Key Financials
17.9. ON Semiconductors
17.9.1. Overview
17.9.2. Product Portfolio
17.9.3. Sales Footprint
17.9.4. Key Subsidiaries or Distributors
17.9.5. Strategy and Recent Developments
17.9.6. Key Financials
17.10. Qurvo, Inc.
17.10.1. Overview
17.10.2. Product Portfolio
17.10.3. Sales Footprint
17.10.4. Key Subsidiaries or Distributors
17.10.5. Strategy and Recent Developments
17.10.6. Key Financials
17.11. STMicroelectronics
17.11.1. Overview
17.11.2. Product Portfolio
17.11.3. Sales Footprint
17.11.4. Key Subsidiaries or Distributors
17.11.5. Strategy and Recent Developments
17.11.6. Key Financials
17.12. Texas Instruments Incorporated
17.12.1. Overview
17.12.2. Product Portfolio
17.12.3. Sales Footprint
17.12.4. Key Subsidiaries or Distributors
17.12.5. Strategy and Recent Developments
17.12.6. Key Financials
18. Recommendation
18.1. Opportunity Assessment
18.1.1. By Passive Devices
18.1.2. By Substrate
18.1.3. By Packaging
18.1.4. By Application
18.1.5. By End-use Industry
18.1.6. By Region
List of Tables
Table 01: Global Integrated Passive Device Market Size & Forecast, by Passive Devices, Value (US$ Mn), 2017–2031
Table 02: Global Integrated Passive Device Market Size & Forecast, by Passive Devices, Volume (Million Units), 2017–2031
Table 03: Global Integrated Passive Device Market Size & Forecast, by Substrate (US$ Mn), 2017–2031
Table 04: Global Integrated Passive Device Market Size & Forecast, by Application, Value (US$ Mn), 2017–2031
Table 05: Global Integrated Passive Device Market Size & Forecast, by End-use Industry, Value (US$ Mn), 2017–2031
Table 06: Global Integrated Passive Device Market Size & Forecast, by Region, Value (US$ Mn), 2017–2031
Table 07: North America Integrated Passive Device Market Size & Forecast, by Passive Devices, Volume (Million Units), 2017–2031
Table 08: North America Integrated Passive Device Market Size & Forecast, by Substrate (US$ Mn), 2017–2031
Table 09: North America Integrated Passive Device Market Size & Forecast, by Application, Value (US$ Mn), 2017–2031
Table 10: North America Integrated Passive Device Market Size & Forecast, by End-use Industry, Value (US$ Mn), 2017–2031
Table 11: North America Integrated Passive Device Market Size & Forecast, by Country, Value (USD Million), 2017–2031
Table 12: Europe Integrated Passive Device Market Size & Forecast, by Passive Devices, Value (US$ Mn), 2017–2031
Table 13: Europe Integrated Passive Device Market Size & Forecast, by Passive Devices, Volume (Million Units), 2017–2031
Table 14: Europe Integrated Passive Device Market Size & Forecast, by Substrate (US$ Mn), 2017–2031
Table 15: Europe Integrated Passive Device Market Size & Forecast, by Application, Value (US$ Mn), 2017–2031
Table 16: Europe Integrated Passive Device Market Size & Forecast, by End-use Industry, Value (US$ Mn), 2017–2031
Table 17: Europe Integrated Passive Device Market Size & Forecast, by Country & Sub-region, Value (US$ Mn), 2017–2031
Table 18: Asia Pacific Integrated Passive Device Market Size & Forecast, by Passive Devices, Value (US$ Mn), 2017–2031
Table 19: Asia Pacific Integrated Passive Device Market Size & Forecast, by Passive Devices, Volume (Million Units), 2017–2031
Table 20: Asia Pacific Integrated Passive Device Market Size & Forecast, by Substrate (US$ Mn), 2017–2031
Table 21: Asia Pacific Integrated Passive Device Market Size & Forecast, by Application, Value (US$ Mn), 2017–2031
Table 22: Asia Pacific Integrated Passive Device Market Size & Forecast, by End-use Industry, Value (US$ Mn), 2017–2031
Table 23: Asia Pacific Integrated Passive Device Market Size & Forecast, by Country & Sub-region, Value (US$ Mn), 2017–2031
Table 24: Middle East & Africa Integrated Passive Device Market Size & Forecast, by Passive Devices, Value (US$ Mn), 2017–2031
Table 25: Middle East & Africa Integrated Passive Device Market Size & Forecast, by Passive Devices, Volume (Million Units), 2017–2031
Table 26: Middle East & Africa Integrated Passive Device Market Size & Forecast, by Substrate (US$ Mn), 2017–2031
Table 27: Middle East & Africa Integrated Passive Device Market Size & Forecast, by Application, Value (US$ Mn), 2017–2031
Table 28: Middle East & Africa Integrated Passive Device Market Size & Forecast, by End-use Industry, Value (US$ Mn), 2017–2031
Table 29: Middle East & Africa (MEA) Integrated Passive Device Market Size & Forecast, by Country & Sub-region, Value (US$ Mn), 2017–2031
Table 30: South America Integrated Passive Device Market Size & Forecast, by Passive Devices, Value (US$ Mn), 2017–2031
Table 31: South America Integrated Passive Device Market Size & Forecast, by Passive Devices, Volume (Million Units), 2017–2031
Table 32: South America Integrated Passive Device Market Size & Forecast, by Substrate (US$ Mn), 2017–2031
Table 33: South America Integrated Passive Device Market Size & Forecast, by Application, Value (US$ Mn), 2017–2031
Table 34: South America Integrated Passive Device Market Size & Forecast, by End-use Industry, Value (US$ Mn), 2017–2031
Table 35: South America Integrated Passive Device Market Size & Forecast, by Country & Sub-region, Value (US$ Mn), 2017–2031
List of Figures
Figure 01: Global Integrated Passive Device Price Trend Analysis (Average Price, US$)
Figure 02: Global Integrated Passive Device Market, Y-O-Y Growth 2017–2031
Figure 03: Global Integrated Passive Device Market, Value (US$ Mn), 2017–2031
Figure 04: Global Integrated Passive Device Market, Volume (Million Units), 2017–2031
Figure 05: Global Integrated Passive Device Market Projections, by Passive Devices, Value (US$ Mn), 2017–2031
Figure 06: Global Integrated Passive Device Market, Incremental Opportunity, by Passive Devices, Value (US$ Mn), 2022 – 2031
Figure 07: Global Integrated Passive Device Market Share, by Passive Devices, Value (US$ Mn), 2022 – 2031
Figure 08: Global Integrated Passive Device Market Projections, by Substrate, Value (US$ Mn), 2017–2031
Figure 09: Global Integrated Passive Device Market, Incremental Opportunity, by Substrate, Value (US$ Mn), 2022 – 2031
Figure 10: Global Integrated Passive Device Market Projections, by Packaging, Value (US$ Mn), 2017–2031
Figure 11: Global Integrated Passive Device Market, Incremental Opportunity, by Packaging, Value (US$ Mn), 2022 – 2031
Figure 12: Global Integrated Passive Device Market Share, by Packaging, Value (US$ Mn), 2022 – 2031
Figure 13: Global Integrated Passive Device Market Size & Forecast, by Application, Value (US$ Mn), 2022 – 2031
Figure 14: Global Integrated Passive Device Market Size & Forecast, by End-use Industry, Revenue (US$ Mn), 2017–2031
Figure 15: Global Integrated Passive Device Market Attractiveness, by End-use Industry, Value (US$ Mn), 2022 – 2031
Figure 16: Global Integrated Passive Device Market Share Analysis, by End-use Industry, 2021 and 2031
Figure 17: Global Integrated Passive Device Market Size & Forecast, by Region, Revenue (US$ Mn), 2017–2031
Figure 18: Global Integrated Passive Device Market Attractiveness, by Region, Value (US$ Mn), 2022 – 2031
Figure 19: Global Integrated Passive Device Market Size & Forecast, by Region, Value (US$ Mn), 2022 – 2031
Figure 20: North America Integrated Passive Device Market, Y-O-Y Growth, 2017–2031
Figure 21: North America Integrated Passive Device Market, Value (US$ Mn), 2017–2031
Figure 22: North America Integrated Passive Device Market, Volume (Million Units), 2017–2031
Figure 23: North America Integrated Passive Device Market, Price Trend, 2017–2031
Figure 24: North America Integrated Passive Device Market Projections, by Passive Devices, Value (US$ Mn), 2017–2031
Figure 25: North America Integrated Passive Device Market, Incremental Opportunity, by Passive Devices, Value (US$ Mn), 2022 – 2031
Figure 26: North America Integrated Passive Device Market Share, by Passive Devices, Value (US$ Mn), 2022 – 2031
Figure 27: North America Integrated Passive Device Market Projections, by Substrate, Value (US$ Mn), 2017–2031
Figure 28: North America Integrated Passive Device Market, Incremental Opportunity, by Substrate, Value (US$ Mn), 2022 – 2031
Figure 29: North America Integrated Passive Device Market Projections, by Packaging, Value (US$ Mn), 2017–2031
Figure 30: North America Integrated Passive Device Market, Incremental Opportunity, by Packaging,, Value (US$ Mn), 2022 – 2031
Figure 31: North America Integrated Passive Device Market Share, by Packaging,, Value (US$ Mn), 2022 – 2031
Figure 32: North America Integrated Passive Device Market Size & Forecast, by Application, Value (US$ Mn), 2022 – 2031
Figure 33: North America Integrated Passive Device Market Size & Forecast, by End-use Industry, Revenue (US$ Mn), 2017–2031
Figure 34: North America Integrated Passive Device Market Attractiveness, by End-use Industry, Value (US$ Mn), 2022 – 2031
Figure 35: North America Integrated Passive Device Market Share Analysis, by End-use Industry, 2021 and 2031
Figure 36: North America Integrated Passive Device Market Size & Forecast, by Country, Revenue (US$ Mn), 2017–2031
Figure 37: North America Integrated Passive Device Market Attractiveness, by Country, Value (US$ Mn), 2022 – 2031
Figure 38: North America Integrated Passive Device Market Size & Forecast, by Country, Value (US$ Mn), 2022 – 2031
Figure 39: Europe Integrated Passive Device Market, Y-O-Y Growth, 2017–2031
Figure 40: Europe Integrated Passive Device Market, Value (US$ Mn), 2017–2031
Figure 41: Europe Integrated Passive Device Market, Volume (Million Units), 2017–2031
Figure 42: Europe Integrated Passive Device Market, Price Trend
Figure 43: Europe Integrated Passive Device Market Projections, by Passive Devices, Value (US$ Mn), 2017–2031
Figure 44: Europe Integrated Passive Device Market, Incremental Opportunity, by Passive Devices, Value (US$ Mn), 2022 – 2031
Figure 45: Europe Integrated Passive Device Market Share, by Passive Devices, Value (US$ Mn), 2022 – 2031
Figure 46: Europe Integrated Passive Device Market Projections, by Substrate, Value (US$ Mn), 2017–2031
Figure 47: Europe Integrated Passive Device Market, Incremental Opportunity, by Substrate, Value (US$ Mn), 2022 – 2031
Figure 48: Europe Integrated Passive Device Market Projections, by Packaging, Value (US$ Mn), 2017–2031
Figure 49: Europe Integrated Passive Device Market, Incremental Opportunity, by Packaging, Value (US$ Mn), 2022 – 2031
Figure 50: Europe Integrated Passive Device Market Share, by Packaging, Value (US$ Mn), 2022 – 2031
Figure 51: Europe Integrated Passive Device Market Size & Forecast, by Application, Value (US$ Mn), 2022 – 2031
Figure 52: Europe Integrated Passive Device Market Size & Forecast, by End-use Industry, Revenue (US$ Mn), 2017–2031
Figure 53: Europe Integrated Passive Device Market Attractiveness, by End-use Industry, Value (US$ Mn), 2022 – 2031
Figure 54: Europe Integrated Passive Device Market Share Analysis, by End-use Industry, 2021 and 2031
Figure 55: Europe Integrated Passive Device Market Size & Forecast, by Country & Sub-region, Revenue (US$ Mn), 2017–2031
Figure 56: Europe Integrated Passive Device Market Attractiveness, by Country & Sub-region, Value (US$ Mn), 2022 – 2031
Figure 57: Europe Integrated Passive Device Market Size & Forecast, by Country & Sub-region, Value (US$ Mn), 2022 – 2031
Figure 58: Asia Pacific Integrated Passive Device Market, Y-O-Y Growth, 2017–2031
Figure 59: Asia Pacific Integrated Passive Device Market, Value (US$ Mn), 2017–2031
Figure 60: Asia Pacific Integrated Passive Device Market, Volume (Million Units), 2017–2031
Figure 61: Asia Pacific Integrated Passive Device Market, Price Trend
Figure 62: Asia Pacific Integrated Passive Device Market Projections, by Passive Devices, Value (US$ Mn), 2017–2031
Figure 63: Asia Pacific Integrated Passive Device Market, Incremental Opportunity, by Passive Devices, Value (US$ Mn), 2022 – 2031
Figure 64: Asia Pacific Integrated Passive Device Market Share, by Passive Devices, Value (US$ Mn), 2022 – 2031
Figure 65: Asia Pacific Integrated Passive Device Market Projections, by Substrate, Value (US$ Mn), 2017–2031
Figure 66: Asia Pacific Integrated Passive Device Market, Incremental Opportunity, by Substrate, Value (US$ Mn), 2022 – 2031
Figure 67: Asia Pacific Integrated Passive Device Market Projections, by Packaging, Value (US$ Mn), 2017–2031
Figure 68: Asia Pacific Integrated Passive Device Market, Incremental Opportunity, by Packaging, Value (US$ Mn), 2022 – 2031
Figure 69: Asia Pacific Integrated Passive Device Market Share, by Packaging, Value (US$ Mn), 2022 – 2031
Figure 70: Asia Pacific Integrated Passive Device Market Size & Forecast, by Application, Value (US$ Mn), 2022 – 2031
Figure 71: Asia Pacific Integrated Passive Device Market Size & Forecast, by End-use Industry, Revenue (US$ Mn), 2017–2031
Figure 72: Asia Pacific Integrated Passive Device Market Attractiveness, by End-use Industry, Value (US$ Mn), 2022 – 2031
Figure 73: Asia Pacific Integrated Passive Device Market Share Analysis, by End-use Industry, 2021 and 2031
Figure 74: Asia Pacific Integrated Passive Device Market Size & Forecast, by Country & Sub-region, Revenue (US$ Mn), 2017–2031
Figure 75: Asia Pacific Integrated Passive Device Market Attractiveness, by Country & Sub-region, Value (US$ Mn), 2022 – 2031
Figure 76: Asia Pacific Integrated Passive Device Market Size & Forecast, by Country & Sub-region, Value (US$ Mn), 2022 – 2031
Figure 77: Middle East & Africa Integrated Passive Device Market, Y-O-Y Growth, 2017–2031
Figure 78: Middle East & Africa Integrated Passive Device Market, Value (US$ Mn), 2017–2031
Figure 79: Middle East & Africa Integrated Passive Device Market, Volume (Million Units), 2017–2031
Figure 80: Middle East & Africa Integrated Passive Device Market, Price Trend
Figure 81: Middle East & Africa Integrated Passive Device Market Projections, by Passive Devices, Value (US$ Mn), 2017–2031
Figure 82: Middle East & Africa Integrated Passive Device Market, Incremental Opportunity, by Passive Devices, Value (US$ Mn), 2022 – 2031
Figure 83: Middle East & Africa Integrated Passive Device Market Share, by Passive Devices, Value (US$ Mn), 2022 – 2031
Figure 84: Middle East & Africa Integrated Passive Device Market Projections, by Substrate, Value (US$ Mn), 2017–2031
Figure 85: Middle East & Africa Integrated Passive Device Market, Incremental Opportunity, by Substrate, Value (US$ Mn), 2022 – 2031
Figure 86: Middle East & Africa Integrated Passive Device Market Projections, by Packaging, Value (US$ Mn), 2017–2031
Figure 87: Middle East & Africa Integrated Passive Device Market, Incremental Opportunity, by Packaging, Value (US$ Mn), 2022 – 2031
Figure 88: Middle East & Africa Integrated Passive Device Market Share, by Packaging, Value (US$ Mn), 2022 – 2031
Figure 89: Middle East & Africa Integrated Passive Device Market Size & Forecast, by Application, Value (US$ Mn), 2022 – 2031
Figure 90: Middle East & Africa Integrated Passive Device Market Size & Forecast, by End-use Industry, Revenue (US$ Mn), 2017–2031
Figure 91: Middle East & Africa Integrated Passive Device Market Attractiveness, by End-use Industry, Value (US$ Mn), 2022 – 2031
Figure 92: Middle East & Africa Integrated Passive Device Market Share Analysis, by End-use Industry, 2021 and 2031
Figure 93: Middle East & Africa (MEA) Integrated Passive Device Market Size & Forecast, by Country & Sub-region, Revenue (US$ Mn), 2017–2031
Figure 94: Middle East & Africa (MEA)Integrated Passive Device Market Attractiveness, by Country & Sub-region, Value (US$ Mn), 2022 – 2031
Figure 95: Middle East & Africa (MEA) Integrated Passive Device Market Size & Forecast, by Country & Sub-region, Value (US$ Mn), 2022 – 2031
Figure 96: South America Integrated Passive Device Market, Y-O-Y Growth, 2017–2031
Figure 97: South America Integrated Passive Device Market, Value (US$ Mn), 2017–2031
Figure 98: South America Integrated Passive Device Market, Volume (Million Units), 2017–2031
Figure 99: South America Integrated Passive Device Market, Price Trend
Figure 100: South America Integrated Passive Device Market Projections, by Passive Devices, Value (US$ Mn), 2017–2031
Figure 101: South America Integrated Passive Device Market, Incremental Opportunity, by Passive Devices, Value (US$ Mn), 2022 – 2031
Figure 102: South America Integrated Passive Device Market Share, by Passive Devices, Value (US$ Mn), 2022 – 2031
Figure 103: South America Integrated Passive Device Market Projections, by Substrate, Value (US$ Mn), 2017–2031
Figure 104: South America Integrated Passive Device Market, Incremental Opportunity, by Substrate, Value (US$ Mn), 2022 – 2031
Figure 105: South America Integrated Passive Device Market Projections, by Packaging, Value (US$ Mn), 2017–2031
Figure 106: South America Integrated Passive Device Market, Incremental Opportunity, by Packaging, Value (US$ Mn), 2022 – 2031
Figure 107: South America Integrated Passive Device Market Share, by Packaging, Value (US$ Mn), 2022 – 2031
Figure 108: South America Integrated Passive Device Market Size & Forecast, by Application, Value (US$ Mn), 2022 – 2031
Figure 109: South America Integrated Passive Device Market Size & Forecast, by End-use Industry, Revenue (US$ Mn), 2017–2031
Figure 110: South America Integrated Passive Device Market Attractiveness, by End-use Industry, Value (US$ Mn), 2022 – 2031
Figure 111: South America Integrated Passive Device Market Share Analysis, by End-use Industry, 2021 and 2031
Figure 112: South America Integrated Passive Device Market Size & Forecast, by Country & Sub-region, Revenue (US$ Mn), 2017–2031
Figure 113: South America Integrated Passive Device Market Attractiveness, by Country & Sub-region, Value (US$ Mn), 2022 – 2031
Figure 114: South America Integrated Passive Device Market Size & Forecast, by Country & Sub-region, Value (US$ Mn), 2022 – 2031
Copyright © Transparency Market Research, Inc. All Rights reserved
Trust Online


Integrated Passive Device Market