
In response to the COVID-19 pandemic, stakeholders in the EMI/RFI filtering market are increasing efforts to stay up and running to ensure the supply of live-saving drugs, medicines, medical devices, and other equipment to hospitals and pharmacies. The second wave of the coronavirus pandemic has affected India, Brazil, and Europe. During these challenging times, the semiconductor industry is supporting vital parts of the global economy, critical infrastructure, and national security.
In order to keep economies running, companies in the EMI/RFI filtering market are increasing R&D for breakthrough innovations to combat the global health crisis. Although it is debatable whether the semiconductor industry is essential or not, stakeholders are focusing on mission-critical industries such as in automotive battery chargers, CNC (Computer Numerical Control) machinery, and telecom infrastructure, among others. Government, food distribution, and power supply are important applications that are fueling the demand for steady supply of semicon devices and materials.
Request a sample to get extensive insights into the EMI/RFI Filtering Market
Shields and filters are both valuable tools for reducing electronic emissions caused by the EMI (electromagnetic interference). It has been found that using both is one of the most effective solutions to reduce electronic emissions. For instance, EMI shielding methods are used to overcome a range of EMI problems and can adequately reflect EMI.
On the other hand, filters help to eliminate the EMI. They help to solve issues related to penetrations through shields as well as the inputs and outputs of an electrical system. Such combination of filters and shields is contributing to the growth of the EMI/RFI filtering market. Using EMI filtering techniques, a transient suppression at a shielded enclosure interface is found to be a highly efficient way to protect against compatibility issues in several electronic machines and devices.
To understand how our report can bring difference to your business strategy, Ask for a brochure
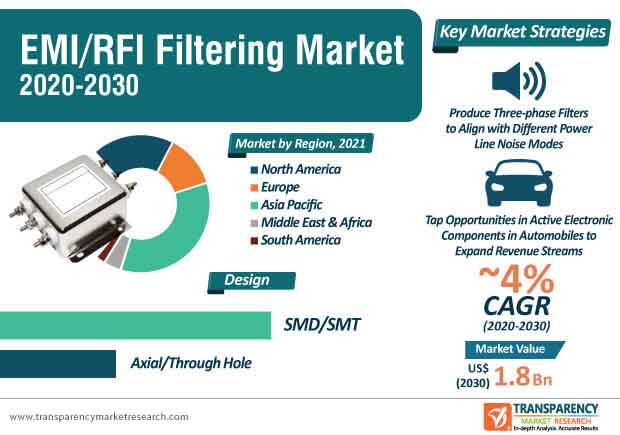
The global EMI/RFI filtering market is expected to grow at a modest CAGR of ~4% during the assessment period. This is evident since issues such as harmonic distortions and conducted emissions are leading to concerns about compliance of devices and machinery with certification regulations worldwide. Hence, companies including EMI Solutions - a manufacturer of EMI/RFI filters in Karnataka, India, is focusing on problem solving by offering EMC (Electro-Magnetic Compatibility) compliance to its industrial corporation clients and OEMs (Original Equipment Manufacturer).
Stakeholders in the India EMI/RFI filtering market are becoming aware about the EMC Compliance Certification Scheme in India, which is necessary for manufacturers to meet various IS, EN, FCC, and IEC EMC standards requirements.
The EMI/RFI filtering market is expected to cross the value mark of US$ 1.8 Bn by the end of 2030. Power supply is one of the most important applications of EMI/RFI filters. Since manufacturers are adhering to compliance regulations recognized and accepted in domestic and international markets for quality, delivery & cost, popular sources such as motors, household appliances, Wi-Fi devices, and the likes are gaining sales impetus.
There is a growing demand for EMI/RFI power line filters to trap noise and prevent it from entering or leaving an equipment. Companies in the EMI/RFI filtering market are increasing their production capabilities in single-phase filters, three-phase filters, and DC filters to align with different power line noise modes. DC filters are being designed for filtering DC power and control lines. These filters are gaining prominence in solar panels, photovoltaic (PV) charging systems, inverters, and battery charging systems.
Compact nanocrystalline single-phase filters that suppress EMI are offering greater design flexibility in applications. An increasingly connected world, which is highly dependent on electronic equipment and devices, is contributing toward the growth of the EMI/RFI filtering market. One of the most common and effective types of EMI filters is mode chokes. Manufacturers are bolstering their production capacities to develop common mode toroidal chokes that are being designed with nanocrystalline metal cores that are useful in multiple noise countermeasure fields.
On the other hand, plastic case filters catering to single-phase EMC requirements are grabbing the attention of manufacturers in the EMI/RFI filtering market. Companies are capitalizing on the opportunity to innovate in next-gen devices by taking advantage of patented refinements and soft nanocrystalline materials that are giving rise to optimized cores delivering unique performance benefits.
The ever-increasing automotive industry is creating stable revenue streams for manufacturers in the EMI/RFI filtering market. Two-wheelers, cars, rickshaws, and heavy vehicles are highly dependent on electro-mechanical components and sub-assemblies. Manufacturers are boosting their output capacities to increase the availability of active electronic components in automotive range from ABS and ECO automotive powertrains, car navigation systems, safety equipment, and automotive infotainment devices.
Automotive components and assemblies tend to emit RF (radio frequency) noise, and are potentially exposed to external sources of energy, resulting in unanticipated changes in system operation. This is where manufacturers in the EMI/RFI filtering market are stepping in to boost their output capabilities for single-phase EMI filters, 3 phase filters, and harmonic filters. Vehicle OEMs are addressing issues of broadband and narrowband noises of EMI with filters build immunity characteristics in automotive systems and components.
Shielded rooms, energy managements, and communication applications are creating revenue streams for companies in the EMI/RFI filtering market. Shielded rooms are popular in SCIFs (Sensitive Compartmented Information Facility) utilized in military applications, MRI rooms in hospitals, and server rooms for commercial businesses. EMI/RFI filters are being used in energy management systems to keep emissions from affecting sensitive equipment in smart home applications and renewable energy systems.
Communications systems such as data lines, telephones, and fire alarms are fueling the demand for EMI/RFI filters to avoid interference on the lines. EMI/RFI filters help to prevent false alarms or noise being projected over the alerting system. Electronics applications are helping manufacturers expand their business streams, since automation or test equipment electronics and laboratory equipment are integrated with EMI/RFI filters to prevent emissions.
Stuck in a neck-to-neck competition with other brands? Request a custom report on EMI/RFI Filtering Market
Analysts’ Viewpoint
Essential industries such as agriculture, telecom, and medical devices have become key focus points of companies operating in the EMI/RFI filtering market during the COVID-19 pandemic. Next-gen nanocrystalline materials are offering high permeability and lower losses than ferrite variants found in traditional EMI filters. However, Indian manufacturers need to abide with stringent compliance regulations including CE marking for European market and Industrial (FCC) & Military Standards (MIL) for the U.S. market. Thus, Indian manufacturers should capitalize on this opportunity to boost credibility by adhering to compliance requirements to gain a competitive edge in India’s highly unstructured and fragmented market landscape. Automotive components and communication systems are creating stable revenue streams for manufacturers.
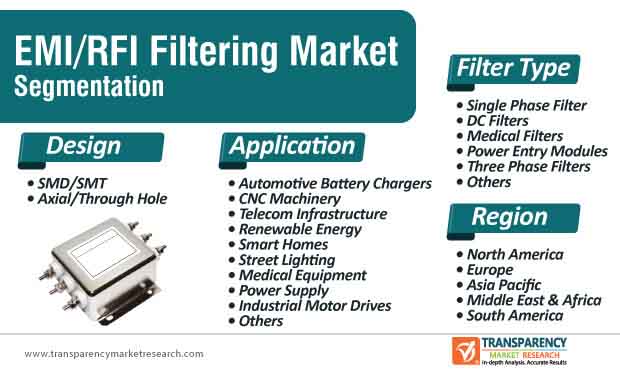
EMI/RFI Filtering Market – Segmentation
TMR’s study of the global EMI/RFI filtering market segments the market based on design, filter type, application, and region. Changing market trends and other crucial market dynamics associated with segments of the global EMI/RFI filtering market have been discussed in detail in TMR’s study.
| Design |
|
| Filter Type |
|
| Application |
|
| Region |
|
The EMI/RFI Filtering Market To Surpass Valuation Of US$ 1.8 Bn By 2030.
The global EMI/RFI filtering market is estimated to expand at a CAGR of ~4% during the forecast period.
EMI (Electromagnetic Interference)/RFI (Radio Frequency Interference) Filter is a type of device which is generally electronic and used to compress the conducted interference present on a signal or power line
Key players operating in the global EMI/RFI filtering market are Astrodyne TDI Corporation, AVX Corporation, API Tech, Coilcraft Inc., Murata Manufacturing Co., Ltd., NXP Semiconductors, ON Semiconductors, Schaffner, TDK Corporation, TE Connectivity, TOKIN Corporation, and Vishay Intertechnology, Inc.
The Global EMI/RFI Filters Market is segmented based on Type, Application, and Geography.
1. Global EMI/RFI Filtering Market- Executive Summary
1.1. Global EMI/RFI Filtering Market Country Analysis
1.2. Competition Blueprint
1.3. Technology Time Line Mapping
1.4. TMR Analysis and Recommendations
2. Market Overview
2.1. Market Introduction
2.2. Market Definition
2.3. Market Taxonomy
3. Market Dynamics
3.1. Macro-economic Factors
3.2. Drivers
3.2.1. Economic Drivers
3.2.2. Supply Side Drivers
3.2.3. Demand Side Drivers
3.3. Market Restraints
3.4. Market Trends
3.5. Trend Analysis- Impact on Time Line (2020-2030)
3.6. Key Regulations By Regions
4. Associated Industry and Key Indicator Assessment
4.1. Parent Industry Overview
4.2. Supply Chain Analysis
4.2.1. Profitability and Gross Margin Analysis By Competition
4.2.2. List of Active Participants- By Region
4.2.2.1. Raw Material Suppliers
4.2.2.2. Key Manufacturers
4.2.2.3. Integrators
4.2.2.4. Key Distributor/Retailers
4.3. Technology Roadmap Analysis
4.4. Porter Five Forces Analysis
5. Global EMI/RFI Filtering Market Pricing Analysis
5.1. Price Point Assessment by Filter Type
5.2. Country wise Average Pricing Analysis
5.2.1. North America
5.2.2. Europe
5.2.3. Asia Pacific
5.2.4. Middle East & Africa
5.2.5. South America
5.3. Price Forecast till 2030
5.4. Factors Influencing Pricing
6. Global EMI/RFI Filtering Market Analysis and Forecast
6.1. Market Size Analysis (2018-2019) and Forecast (2020-2030)
6.1.1. Market Value (US$ Mn) and Volume (Million Units) and Y-o-Y Growth
6.2. Global EMI/RFI Filtering Market Scenario Forecast (Optimistic, Likely and Conservative Market Conditions)
6.2.1. Forecast Factors and Relevance of Impact
6.2.2. RegionalEMI/RFI Filtering Market Business Performance Summary
7. Global EMI/RFI Filtering Market Analysis By Filter Type
7.1. Introduction
7.1.1. Y-o-Y Growth Comparison By Filter Type
7.2. EMI/RFI Filtering Market Size (US$ Mn) and Volume (Million Units) Analysis & Forecast, By Filter Type, 2018 - 2030
7.2.1. Single Phase Filters
7.2.2. DC Filters
7.2.3. Medical Filters
7.2.4. Power Entry Modules
7.2.5. Three Phase Filters
7.2.6. Others (Custom Filters, etc.)
7.3. Market Attractiveness Analysis By Filter Type
8. Global EMI/RFI Filtering Market Analysis By Design
8.1. Introduction
8.1.1. Y-o-Y Growth Comparison By Design
8.2. EMI/RFI Filtering Market Size (US$ Mn) Analysis & Forecast, By Design, 2018 - 2030
8.2.1. SMD/SMT
8.2.2. Axial/Through Hole
8.3. Market Attractiveness Analysis By Design
9. Global EMI/RFI Filtering Market Analysis By Application
9.1. Introduction
9.1.1. Y-o-Y Growth Comparison By Application
9.2. EMI/RFI Filtering Market Size (US$ Mn) Analysis & Forecast, By Application, 2018 - 2030
9.2.1. Automotive Battery Chargers
9.2.2. Automated Test Equipment
9.2.3. CNC Machinery
9.2.4. Renewable Energy
9.2.5. Robotics Automation
9.2.6. Smart Homes
9.2.7. Street Lighting
9.2.8. Medical Equipment
9.2.9. Power Supply
9.2.10. Industrial Motor Drives
9.2.11. Others (Treadmills, Military Communication Equipment, Telephone Lines, etc.)
9.3. Market Attractiveness Analysis By Application
10. Global EMI/RFI Filtering Market Analysis and Forecast, By Region
10.1. Introduction
10.1.1. Basis Point Share (BPS) Analysis By Region
10.2. EMI/RFI Filtering Market Size (US$ Mn) and Volume (Million Units) Analysis & Forecast, By Region, 2018 - 2030
10.2.1. North America
10.2.2. Europe
10.2.3. Asia Pacific
10.2.4. Middle East & Africa
10.2.5. South America
10.3. Market Attractiveness Analysis By Country
11. North America EMI/RFI Filtering Market Analysis and Forecast
11.1. Introduction
11.2. Drivers and Restraints: Impact Analysis
11.3. EMI/RFI Filtering Market Size (US$ Mn) and Volume (Million Units) Analysis & Forecast, By Filter Type, 2018 - 2030
11.3.1. Single Phase Filters
11.3.2. DC Filters
11.3.3. Medical Filters
11.3.4. Power Entry Modules
11.3.5. Three Phase Filters
11.3.6. Others (Custom Filters, etc.)
11.4. EMI/RFI Filtering Market Size (US$ Mn) Analysis & Forecast, By Design, 2018 - 2030
11.4.1. SMD/SMT
11.4.2. Axial/Through Hole
11.5. EMI/RFI Filtering Market Size (US$ Mn) Analysis & Forecast, By Application, 2018 - 2030
11.5.1. Automotive Battery Chargers
11.5.2. Automated Test Equipment
11.5.3. CNC Machinery
11.5.4. Renewable Energy
11.5.5. Robotics Automation
11.5.6. Smart Homes
11.5.7. Street Lighting
11.5.8. Medical Equipment
11.5.9. Power Supply
11.5.10. Industrial Motor Drives
11.5.11. Others (Treadmills, Military Communication Equipment, Telephone Lines, etc.)
11.6. EMI/RFI Filtering Market Size (US$ Mn) and Volume (Million Units) Analysis & Forecast, By Country, 2018 - 2030
11.6.1. U.S.
11.6.2. Canada
11.6.3. Mexico
11.7. Market Attractiveness Analysis
11.7.1. Filter Type
11.7.2. Design
11.7.3. Application
11.7.4. Country
12. Europe EMI/RFI Filtering Market Analysis and Forecast
12.1. Introduction
12.2. Drivers and Restraints: Impact Analysis
12.3. EMI/RFI Filtering Market Size (US$ Mn) and Volume (Million Units) Analysis & Forecast, By Filter Type, 2018 - 2030
12.3.1. Single Phase Filters
12.3.2. DC Filters
12.3.3. Medical Filters
12.3.4. Power Entry Modules
12.3.5. Three Phase Filters
12.3.6. Others (Custom Filters, etc.)
12.4. EMI/RFI Filtering Market Size (US$ Mn) Analysis & Forecast, By Design, 2018 - 2030
12.4.1. SMD/SMT
12.4.2. Axial/Through Hole
12.5. EMI/RFI Filtering Market Size (US$ Mn) Analysis & Forecast, By Application, 2018 - 2030
12.5.1. Automotive Battery Chargers
12.5.2. Automated Test Equipment
12.5.3. CNC Machinery
12.5.4. Renewable Energy
12.5.5. Robotics Automation
12.5.6. Smart Homes
12.5.7. Street Lighting
12.5.8. Medical Equipment
12.5.9. Power Supply
12.5.10. Industrial Motor Drives
12.5.11. Others (Treadmills, Military Communication Equipment, Telephone Lines, etc.)
12.6. EMI/RFI Filtering Market Size (US$ Mn) and Volume (Million Units) Analysis & Forecast, By Country & Sub-region, 2018 - 2030
12.6.1. U.K.
12.6.2. Germany
12.6.3. France
12.6.4. Italy
12.6.5. Russia
12.6.6. Rest of Europe
12.7. Market Attractiveness Analysis
12.7.1. Filter Type
12.7.2. Design
12.7.3. Application
12.7.4. Country
13. Asia Pacific EMI/RFI Filtering Market Analysis and Forecast
13.1. Introduction
13.2. Drivers and Restraints: Impact Analysis
13.3. EMI/RFI Filtering Market Size (US$ Mn) and Volume (Million Units) Analysis & Forecast, By Filter Type, 2018 - 2030
13.3.1. Single Phase Filters
13.3.2. DC Filters
13.3.3. Medical Filters
13.3.4. Power Entry Modules
13.3.5. Three Phase Filters
13.3.6. Others (Custom Filters, etc.)
13.4. EMI/RFI Filtering Market Size (US$ Mn) Analysis & Forecast, By Design, 2018 - 2030
13.4.1. SMD/SMT
13.4.2. Axial/Through Hole
13.5. EMI/RFI Filtering Market Size (US$ Mn) Analysis & Forecast, By Application, 2018 - 2030
13.5.1. Automotive Battery Chargers
13.5.2. Automated Test Equipment
13.5.3. CNC Machinery
13.5.4. Renewable Energy
13.5.5. Robotics Automation
13.5.6. Smart Homes
13.5.7. Street Lighting
13.5.8. Medical Equipment
13.5.9. Power Supply
13.5.10. Industrial Motor Drives
13.5.11. Others (Treadmills, Military Communication Equipment, Telephone Lines, etc.)
13.6. EMI/RFI Filtering Market Size (US$ Mn) and Volume (Million Units) Analysis & Forecast, By Country & Sub-region, 2018 - 2030
13.6.1. China
13.6.2. India
13.6.3. Japan
13.6.4. South Korea
13.6.5. Taiwan
13.6.6. Australia & New Zealand
13.6.7. ASEAN
13.6.8. Rest of Asia Pacific
13.7. Market Attractiveness Analysis
13.7.1. Filter Type
13.7.2. Design
13.7.3. Application
13.7.4. Country
14. Middle East & Africa EMI/RFI Filtering Market Analysis and Forecast
14.1. Introduction
14.2. Drivers and Restraints: Impact Analysis
14.3. EMI/RFI Filtering Market Size (US$ Mn) and Volume (Million Units) Analysis & Forecast, By Filter Type, 2018 - 2030
14.3.1. Single Phase Filters
14.3.2. DC Filters
14.3.3. Medical Filters
14.3.4. Power Entry Modules
14.3.5. Three Phase Filters
14.3.6. Others (Custom Filters, etc.)
14.4. EMI/RFI Filtering Market Size (US$ Mn) Analysis & Forecast, By Design, 2018 - 2030
14.4.1. SMD/SMT
14.4.2. Axial/Through Hole
14.5. EMI/RFI Filtering Market Size (US$ Mn) Analysis & Forecast, By Application, 2018 - 2030
14.5.1. Automotive Battery Chargers
14.5.2. Automated Test Equipment
14.5.3. CNC Machinery
14.5.4. Renewable Energy
14.5.5. Robotics Automation
14.5.6. Smart Homes
14.5.7. Street Lighting
14.5.8. Medical Equipment
14.5.9. Power Supply
14.5.10. Industrial Motor Drives
14.5.11. Others (Treadmills, Military Communication Equipment, Telephone Lines, etc.)
14.6. EMI/RFI Filtering Market Size (US$ Mn) and Volume (Million Units) Analysis & Forecast, By Country & Sub-region, 2018 - 2030
14.6.1. GCC
14.6.2. South Africa
14.6.3. North Africa
14.6.4. Rest of Middle East & Africa
14.7. Market Attractiveness Analysis
14.7.1. Filter Type
14.7.2. Design
14.7.3. Application
14.7.4. Country
15. South America EMI/RFI Filtering Market Analysis and Forecast
15.1. Introduction
15.2. Drivers and Restraints: Impact Analysis
15.3. EMI/RFI Filtering Market Size (US$ Mn) and Volume (Million Units) Analysis & Forecast, By Filter Type, 2018 - 2030
15.3.1. Single Phase Filters
15.3.2. DC Filters
15.3.3. Medical Filters
15.3.4. Power Entry Modules
15.3.5. Three Phase Filters
15.3.6. Others (Custom Filters, etc.)
15.4. EMI/RFI Filtering Market Size (US$ Mn) Analysis & Forecast, By Design, 2018 - 2030
15.4.1. SMD/SMT
15.4.2. Axial/Through Hole
15.5. EMI/RFI Filtering Market Size (US$ Mn) Analysis & Forecast, By Application, 2018 - 2030
15.5.1. Automotive Battery Chargers
15.5.2. Automated Test Equipment
15.5.3. CNC Machinery
15.5.4. Renewable Energy
15.5.5. Robotics Automation
15.5.6. Smart Homes
15.5.7. Street Lighting
15.5.8. Medical Equipment
15.5.9. Power Supply
15.5.10. Industrial Motor Drives
15.5.11. Others (Treadmills, Military Communication Equipment, Telephone Lines, etc.)
15.6. EMI/RFI Filtering Market Size (US$ Mn) and Volume (Million Units) Analysis & Forecast, By Country & Sub-region, 2018 - 2030
15.6.1. Brazil
15.6.2. Argentina
15.6.3. Rest of South America
15.7. Market Attractiveness Analysis
15.7.1. Filter Type
15.7.2. Design
15.7.3. Application
15.7.4. Country
16. Competition Assessment
16.1. GlobalEMI/RFI Filtering Market Competition - a Dashboard View
16.2. GlobalEMI/RFI Filtering Market Structure Analysis
16.3. GlobalEMI/RFI Filtering Market Company Share Analysis, by Value and Volume (2019)
17. Competition Deep-dive (Manufacturers/Suppliers)
17.1. Astrodyne TDI Corporation
17.1.1. Overview
17.1.2. Product Portfolio
17.1.3. Sales Footprint
17.1.4. Channel Footprint
17.1.4.1. Distributors List
17.1.5. Strategy Overview
17.1.5.1. Marketing Strategy
17.1.5.2. Culture Strategy
17.1.5.3. Channel Strategy
17.1.6. SWOT Analysis
17.1.7. Financial Analysis
17.1.8. Revenue Share
17.1.8.1. By Region
17.1.9. Key Clients
17.1.10. Analyst Comments
17.2. AVX Corporation
17.2.1. Overview
17.2.2. Product Portfolio
17.2.3. Sales Footprint
17.2.4. Channel Footprint
17.2.4.1. Distributors List
17.2.5. Strategy Overview
17.2.5.1. Marketing Strategy
17.2.5.2. Culture Strategy
17.2.5.3. Channel Strategy
17.2.6. SWOT Analysis
17.2.7. Financial Analysis
17.2.8. Revenue Share
17.2.8.1. By Region
17.2.9. Key Clients
17.2.10. Analyst Comments
17.3. Coilcraft Inc.
17.3.1. Overview
17.3.2. Product Portfolio
17.3.3. Sales Footprint
17.3.4. Channel Footprint
17.3.4.1. Distributors List
17.3.5. Strategy Overview
17.3.5.1. Marketing Strategy
17.3.5.2. Culture Strategy
17.3.5.3. Channel Strategy
17.3.6. SWOT Analysis
17.3.7. Financial Analysis
17.3.8. Revenue Share
17.3.8.1. By Region
17.3.9. Key Clients
17.3.10. Analyst Comments
17.4. Murata Manufacturing Co., Ltd.
17.4.1. Overview
17.4.2. Product Portfolio
17.4.3. Sales Footprint
17.4.4. Channel Footprint
17.4.4.1. Distributors List
17.4.5. Strategy Overview
17.4.5.1. Marketing Strategy
17.4.5.2. Culture Strategy
17.4.5.3. Channel Strategy
17.4.6. SWOT Analysis
17.4.7. Financial Analysis
17.4.8. Revenue Share
17.4.8.1. By Region
17.4.9. Key Clients
17.4.10. Analyst Comments
17.5. NXP Semiconductors
17.5.1. Overview
17.5.2. Product Portfolio
17.5.3. Sales Footprint
17.5.4. Channel Footprint
17.5.4.1. Distributors List
17.5.5. Strategy Overview
17.5.5.1. Marketing Strategy
17.5.5.2. Culture Strategy
17.5.5.3. Channel Strategy
17.5.6. SWOT Analysis
17.5.7. Financial Analysis
17.5.8. Revenue Share
17.5.8.1. By Region
17.5.9. Key Clients
17.5.10. Analyst Comments
17.6. ON Semiconductors
17.6.1. Overview
17.6.2. Product Portfolio
17.6.3. Sales Footprint
17.6.4. Channel Footprint
17.6.4.1. Distributors List
17.6.5. Strategy Overview
17.6.5.1. Marketing Strategy
17.6.5.2. Culture Strategy
17.6.5.3. Channel Strategy
17.6.6. SWOT Analysis
17.6.7. Financial Analysis
17.6.8. Revenue Share
17.6.8.1. By Region
17.6.9. Key Clients
17.6.10. Analyst Comments
17.7. Panasonic Corporation
17.7.1. Overview
17.7.2. Product Portfolio
17.7.3. Sales Footprint
17.7.4. Channel Footprint
17.7.4.1. Distributors List
17.7.5. Strategy Overview
17.7.5.1. Marketing Strategy
17.7.5.2. Culture Strategy
17.7.5.3. Channel Strategy
17.7.6. SWOT Analysis
17.7.7. Financial Analysis
17.7.8. Revenue Share
17.7.8.1. By Region
17.7.9. Key Clients
17.7.10. Analyst Comments
17.8. Schaffner
17.8.1. Overview
17.8.2. Product Portfolio
17.8.3. Sales Footprint
17.8.4. Channel Footprint
17.8.4.1. Distributors List
17.8.5. Strategy Overview
17.8.5.1. Marketing Strategy
17.8.5.2. Culture Strategy
17.8.5.3. Channel Strategy
17.8.6. SWOT Analysis
17.8.7. Financial Analysis
17.8.8. Revenue Share
17.8.8.1. By Region
17.8.9. Key Clients
17.8.10. Analyst Comments
17.9. Shanghai Aide Electronic Co., Ltd.
17.9.1. Overview
17.9.2. Product Portfolio
17.9.3. Sales Footprint
17.9.4. Channel Footprint
17.9.4.1. Distributors List
17.9.5. Strategy Overview
17.9.5.1. Marketing Strategy
17.9.5.2. Culture Strategy
17.9.5.3. Channel Strategy
17.9.6. SWOT Analysis
17.9.7. Financial Analysis
17.9.8. Revenue Share
17.9.8.1. By Region
17.9.9. Key Clients
17.9.10. Analyst Comments
17.10. TDK Corporation
17.10.1. Overview
17.10.2. Product Portfolio
17.10.3. Sales Footprint
17.10.4. Channel Footprint
17.10.4.1. Distributors List
17.10.5. Strategy Overview
17.10.5.1. Marketing Strategy
17.10.5.2. Culture Strategy
17.10.5.3. Channel Strategy
17.10.6. SWOT Analysis
17.10.7. Financial Analysis
17.10.8. Revenue Share
17.10.8.1. By Region
17.10.9. Key Clients
17.10.10. Analyst Comments
17.11. TOKIN Corporation
17.11.1. Overview
17.11.2. Product Portfolio
17.11.3. Sales Footprint
17.11.4. Channel Footprint
17.11.4.1. Distributors List
17.11.5. Strategy Overview
17.11.5.1. Marketing Strategy
17.11.5.2. Culture Strategy
17.11.5.3. Channel Strategy
17.11.6. SWOT Analysis
17.11.7. Financial Analysis
17.11.8. Revenue Share
17.11.8.1. By Region
17.11.9. Key Clients
17.11.10. Analyst Comments
17.12. Vishay Intertechnology, Inc.
17.12.1. Overview
17.12.2. Product Portfolio
17.12.3. Sales Footprint
17.12.4. Channel Footprint
17.12.4.1. Distributors List
17.12.5. Strategy Overview
17.12.5.1. Marketing Strategy
17.12.5.2. Culture Strategy
17.12.5.3. Channel Strategy
17.12.6. SWOT Analysis
17.12.7. Financial Analysis
17.12.8. Revenue Share
17.12.8.1. By Region
17.12.9. Key Clients
17.12.10. Analyst Comments
17.13. Others (On additional request)
18. Recommendation- Critical Success Factors
19. Research Methodology
20. Assumptions & Acronyms Used
List of Tables
Table 01: Global EMI/RFI Filtering Market Revenue (US$ Mn), By Filter Type, 2018–2030
Table 02: Global EMI/RFI Filtering Market Volume (Million Units), By Filter Type, 2018–2030
Table 03: Global EMI/RFI Filtering Market Revenue (US$ Mn), By Design, 2018–2030
Table 04: Global EMI/RFI Filtering Market Revenue (US$ Mn), By Application, 2018–2030
Table 05: Global EMI/RFI Filtering Market Revenue (US$ Mn), by Region, 2018–2030
Table 06: Global EMI/RFI Filtering Market Volume (Million Units), by Region, 2018–2030
Table 07: North America EMI/RFI Filtering Market Revenue (US$ Mn), By Filter Type, 2018–2030
Table 08: North America EMI/RFI Filtering Market Volume (Million Units), By Filter Type, 2018–2030
Table 09: North America EMI/RFI Filtering Market Revenue (US$ Mn), By Design, 2018–2030
Table 10: North America EMI/RFI Filtering Market Revenue (US$ Mn), By Application, 2018–2030
Table 11: North America EMI/RFI Filtering Market Revenue (US$ Mn), by Country, 2018–2030
Table 12: North America EMI/RFI Filtering Market Volume (Million Units), by Country, 2018–2030
Table 13: Europe EMI/RFI Filtering Market Revenue (US$ Mn), By Filter Type, 2018–2030
Table 14: Europe EMI/RFI Filtering Market Volume (Million Units), By Filter Type, 2018–2030
Table 15: Europe EMI/RFI Filtering Market Revenue (US$ Mn), By Design, 2018–2030
Table 16: Europe EMI/RFI Filtering Market Revenue (US$ Mn), By Application, 2018–2030
Table 17: Europe EMI/RFI Filtering Market Revenue (US$ Mn), by Country, 2018–2030
Table 18: Europe EMI/RFI Filtering Market Volume (Million Units), by Country, 2018–2030
Table 19: Asia Pacific EMI/RFI Filtering Market Revenue (US$ Mn), By Filter Type, 2018–2030
Table 20: Asia Pacific EMI/RFI Filtering Market Volume (Million Units), By Filter Type, 2018–2030
Table 21: Asia Pacific EMI/RFI Filtering Market Revenue (US$ Mn), By Design, 2018–2030
Table 22: Asia Pacific EMI/RFI Filtering Market Revenue (US$ Mn), By Application, 2018–2030
Table 23: Asia Pacific EMI/RFI Filtering Market Revenue (US$ Mn), by Country, 2018–2030
Table 24: Asia Pacific EMI/RFI Filtering Market Volume (Million Units), by Country, 2018–2030
Table 25: Middle East & Africa EMI/RFI Filtering Market Revenue (US$ Mn), By Filter Type, 2018–2030
Table 26: Middle East & Africa EMI/RFI Filtering Market Volume (Million Units), By Filter Type, 2018–2030
Table 27: Middle East & Africa EMI/RFI Filtering Market Revenue (US$ Mn), By Design, 2018–2030
Table 28: Middle East & Africa EMI/RFI Filtering Market Revenue (US$ Mn), By Application, 2018–2030
Table 29: Middle East & Africa EMI/RFI Filtering Market Revenue (US$ Mn), by Country, 2018–2030
Table 30: Middle East & Africa EMI/RFI Filtering Market Volume (Million Units), by Country, 2018–2030
Table 31: South America EMI/RFI Filtering Market Revenue (US$ Mn), By Filter Type, 2018–2030
Table 32: South America EMI/RFI Filtering Market Volume (Million Units), By Filter Type, 2018–2030
Table 33: South America EMI/RFI Filtering Market Revenue (US$ Mn), By Design, 2018–2030
Table 34: South America EMI/RFI Filtering Market Revenue (US$ Mn), By Application, 2018–2030
Table 35: South America EMI/RFI Filtering Market Revenue (US$ Mn), by Country, 2018–2030
Table 36: South America EMI/RFI Filtering Market Volume (Million Units), by Country, 2018–2030
List of Figures
Figure 01: Global EMI/RFI Filtering Market Revenue (US$ Mn) Forecast, 2018–2030
Figure 02: Global EMI/RFI Filtering Market Size Analysis (2018-2019) and Forecast (2020-2030)
Figure 03: Global EMI/RFI Filtering Market Revenue, by Value, 2018 - 2030
Figure 04: Global EMI/RFI Filtering Market Volume, by Volume, 2018 - 2030
Figure 05: Global EMI/RFI Filtering Market, by Single Phase Filters
Figure 06: Global EMI/RFI Filtering Market, by DC Filters
Figure 07: Global EMI/RFI Filtering Market, by Medical Filters
Figure 08: Global EMI/RFI Filtering Market, by Power Entry Modules
Figure 09: Global EMI/RFI Filtering Market, by Three Phase Filters
Figure 10: Global EMI/RFI Filtering Market, by Others (Custom Filters, etc.)
Figure 11: Global EMI/RFI Filtering Market Comparison Matrix, By Filter Type
Figure 12: Global EMI/RFI Filtering Market Attractiveness Analysis, By Filter Type
Figure 13: Global EMI/RFI Filtering Market, by SMD/SMT
Figure 14: Global EMI/RFI Filtering Market, by Axial/Through Hole
Figure 15: Global EMI/RFI Filtering Market Comparison Matrix, By Design
Figure 16: Global EMI/RFI Filtering Market Attractiveness Analysis, By Design
Figure 17: Global EMI/RFI Filtering Market, by Automotive Battery Chargers
Figure 18: Global EMI/RFI Filtering Market, by CNC Machinery
Figure 19: Global EMI/RFI Filtering Market, by Telecom Infrastructure
Figure 20: Global EMI/RFI Filtering Market, by Renewable Energy
Figure 21: Global EMI/RFI Filtering Market, by Smart Homes
Figure 22: Global EMI/RFI Filtering Market, by Street Lighting
Figure 23: Global EMI/RFI Filtering Market, by Medical Equipment
Figure 24: Global EMI/RFI Filtering Market, by Power Supply
Figure 25: Global EMI/RFI Filtering Market, by Industrial Motor Drives
Figure 26: Global EMI/RFI Filtering Market, by Others
Figure 27: Global EMI/RFI Filtering Market Comparison Matrix, By Application
Figure 28: Global EMI/RFI Filtering Market Attractiveness Analysis, By Application
Figure 29: Global EMI/RFI Filtering Market Value Share Analysis, by Region (2020F)
Figure 30: Global EMI/RFI Filtering Market Value Share Analysis, by Region (2030F)
Figure 31: Global EMI/RFI Filtering Market Volume Share Analysis, by Region (2020F)
Figure 32: Global EMI/RFI Filtering Market Volume Share Analysis, by Region (2030F)
Figure 33: Global EMI/RFI Filtering Market Attractiveness Analysis, by Region
Figure 34: North America EMI/RFI Filtering Market Revenue (US$ Mn) Forecast, 2018–2030
Figure 35: North America EMI/RFI Filtering Market Y-o-Y Growth Projection, 2018–2030
Figure 36: North America EMI/RFI Filtering Market Volume (Million Units) Forecast, 2018–2030
Figure 37: North America EMI/RFI Filtering Market Y-o-Y Growth Projection, 2018–2030
Figure 38: North America EMI/RFI Filtering Market Value Share Analysis, By Filter Type (2020)
Figure 39: North America EMI/RFI Filtering Market Value Share Analysis, By Filter Type (2030)
Figure 40: North America EMI/RFI Filtering Market Volume Share Analysis, By Filter Type (2020)
Figure 41: North America EMI/RFI Filtering Market Volume Share Analysis, By Filter Type (2030)
Figure 42: North America EMI/RFI Filtering Market Value Share Analysis, By Design (2020)
Figure 43: North America EMI/RFI Filtering Market Value Share Analysis, By Design (2030)
Figure 44: North America EMI/RFI Filtering Market Value Share Analysis, By Application (2020)
Figure 45: North America EMI/RFI Filtering Market Value Share Analysis, By Application (2030)
Figure 46: North America EMI/RFI Filtering Market Value Share Analysis, by Country (2020F)
Figure 47: North America EMI/RFI Filtering Market Value Share Analysis, by Country (2030F )
Figure 48: North America EMI/RFI Filtering Market Volume Share Analysis, by Country (2020F)
Figure 49: North America EMI/RFI Filtering Market Volume Share Analysis, by Country (2030F )
Figure 50: North America EMI/RFI Filtering Market Attractiveness Analysis, By Filter Type
Figure 51: North America EMI/RFI Filtering Market Attractiveness Analysis, By Design
Figure 52: North America EMI/RFI Filtering Market Attractiveness Analysis, by Application
Figure 53: North America EMI/RFI Filtering Market Attractiveness Analysis, by Country
Figure 54: Europe EMI/RFI Filtering Market Revenue (US$ Mn) Forecast, 2018–2030
Figure 55: Europe EMI/RFI Filtering Market Y-o-Y Growth Projection, 2018–2030
Figure 56: Europe EMI/RFI Filtering Market Volume (Million Units) Forecast, 2018–2030
Figure 57: Europe EMI/RFI Filtering Market Y-o-Y Growth Projection, 2018–2030
Figure 58: Europe EMI/RFI Filtering Market Value Share Analysis, By Filter Type (2020)
Figure 59: Europe EMI/RFI Filtering Market Value Share Analysis, By Filter Type (2030)
Figure 60: Europe EMI/RFI Filtering Market Volume Share Analysis, By Filter Type (2020)
Figure 61: Europe EMI/RFI Filtering Market Volume Share Analysis, By Filter Type (2030)
Figure 62: Europe EMI/RFI Filtering Market Value Share Analysis, By Design (2020)
Figure 63: Europe EMI/RFI Filtering Market Value Share Analysis, By Design (2030)
Figure 64: Europe EMI/RFI Filtering Market Value Share Analysis, By Application (2020)
Figure 65: Europe EMI/RFI Filtering Market Value Share Analysis, By Application (2030)
Figure 66: Europe EMI/RFI Filtering Market Value Share Analysis, by Country (2020F)
Figure 67: Europe EMI/RFI Filtering Market Value Share Analysis, by Country (2030F )
Figure 68: Europe EMI/RFI Filtering Market Volume Share Analysis, by Country (2020F)
Figure 69: Europe EMI/RFI Filtering Market Volume Share Analysis, by Country (2030F )
Figure 70: Europe EMI/RFI Filtering Market Attractiveness Analysis, By Filter Type
Figure 71: Europe EMI/RFI Filtering Market Attractiveness Analysis, By Design
Figure 72: Europe EMI/RFI Filtering Market Attractiveness Analysis, by Component
Figure 73: Europe EMI/RFI Filtering Market Attractiveness Analysis, by Country
Figure 74: Asia Pacific EMI/RFI Filtering Market Revenue (US$ Mn) Forecast, 2018–2030
Figure 75: Asia Pacific EMI/RFI Filtering Market Y-o-Y Growth Projection, 2018–2030
Figure 76: Asia Pacific EMI/RFI Filtering Market Volume (Million Units) Forecast, 2018–2030
Figure 77: Asia Pacific EMI/RFI Filtering Market Y-o-Y Growth Projection, 2018–2030
Figure 78: Asia Pacific EMI/RFI Filtering Market Value Share Analysis, By Filter Type (2020)
Figure 79: Asia Pacific EMI/RFI Filtering Market Value Share Analysis, By Filter Type (2030)
Figure 80: Asia Pacific EMI/RFI Filtering Market Volume Share Analysis, By Filter Type (2020)
Figure 81: Asia Pacific EMI/RFI Filtering Market Volume Share Analysis, By Filter Type (2030)
Figure 82: Asia Pacific EMI/RFI Filtering Market Value Share Analysis, By Design (2020)
Figure 83: Asia Pacific EMI/RFI Filtering Market Value Share Analysis, By Design (2030)
Figure 84: Asia Pacific EMI/RFI Filtering Market Value Share Analysis, By Application (2020)
Figure 85: Asia Pacific EMI/RFI Filtering Market Value Share Analysis, By Application (2030)
Figure 86: Asia Pacific EMI/RFI Filtering Market Value Share Analysis, by Country (2020F)
Figure 87: Asia Pacific EMI/RFI Filtering Market Value Share Analysis, by Country (2030F )
Figure 88: Asia Pacific EMI/RFI Filtering Market Volume Share Analysis, by Country (2020F)
Figure 89: Asia Pacific EMI/RFI Filtering Market Volume Share Analysis, by Country (2030F )
Figure 90: Asia Pacific EMI/RFI Filtering Market Attractiveness Analysis, By Filter Type
Figure 91: Asia Pacific EMI/RFI Filtering Market Attractiveness Analysis, By Design
Figure 92: Asia Pacific EMI/RFI Filtering Market Attractiveness Analysis, by Application
Figure 93: Asia Pacific EMI/RFI Filtering Market Attractiveness Analysis, by Country
Figure 94: Middle East & Africa EMI/RFI Filtering Market Revenue (US$ Mn) Forecast, 2018–2030
Figure 95: Middle East & Africa EMI/RFI Filtering Market Y-o-Y Growth Projection, 2018–2030
Figure 96: Middle East & Africa EMI/RFI Filtering Market Volume (Million Units) Forecast, 2018–2030
Figure 97: Middle East & Africa EMI/RFI Filtering Market Y-o-Y Growth Projection, 2018–2030
Figure 98: Middle East & Africa EMI/RFI Filtering Market Value Share Analysis, By Filter Type (2020)
Figure 99: Middle East & Africa EMI/RFI Filtering Market Value Share Analysis, By Filter Type (2030)
Figure 100: Middle East & Africa EMI/RFI Filtering Market Volume Share Analysis, By Filter Type (2020)
Figure 101: Middle East & Africa EMI/RFI Filtering Market Volume Share Analysis, By Filter Type (2030)
Figure 102: Middle East & Africa EMI/RFI Filtering Market Value Share Analysis, By Design (2020)
Figure 103: Middle East & Africa EMI/RFI Filtering Market Value Share Analysis, By Design (2030)
Figure 104: Middle East & Africa EMI/RFI Filtering Market Value Share Analysis, By Application (2020)
Figure 105: Middle East & Africa EMI/RFI Filtering Market Value Share Analysis, By Application (2030)
Figure 106: Middle East & Africa EMI/RFI Filtering Market Value Share Analysis, by Country (2020F)
Figure 107: Middle East & Africa EMI/RFI Filtering Market Value Share Analysis, by Country (2030F )
Figure 108: Middle East & Africa EMI/RFI Filtering Market Volume Share Analysis, by Country (2020F)
Figure 109: Middle East & Africa EMI/RFI Filtering Market Volume Share Analysis, by Country (2030F )
Figure 110: Middle East & Africa EMI/RFI Filtering Market Attractiveness Analysis, By Filter Type
Figure 111: Middle East & Africa EMI/RFI Filtering Market Attractiveness Analysis, By Design
Figure 112: Middle East & Africa EMI/RFI Filtering Market Attractiveness Analysis, by Application
Figure 113: Middle East & Africa EMI/RFI Filtering Market Attractiveness Analysis, by Country
Figure 114: South America EMI/RFI Filtering Market Revenue (US$ Mn) Forecast, 2018–2030
Figure 115: South America EMI/RFI Filtering Market Y-o-Y Growth Projection, 2018–2030
Figure 116: South America EMI/RFI Filtering Market Volume (Million Units) Forecast, 2018–2030
Figure 117: South America EMI/RFI Filtering Market Y-o-Y Growth Projection, 2018–2030
Figure 118: South America EMI/RFI Filtering Market Value Share Analysis, By Filter Type (2020)
Figure 119: South America EMI/RFI Filtering Market Value Share Analysis, By Filter Type (2030)
Figure 120: South America EMI/RFI Filtering Market Volume Share Analysis, By Filter Type (2020)
Figure 121: South America EMI/RFI Filtering Market Volume Share Analysis, By Filter Type (2030)
Figure 122: South America EMI/RFI Filtering Market Value Share Analysis, By Design (2020)
Figure 123: South America EMI/RFI Filtering Market Value Share Analysis, By Design (2030)
Figure 124: South America EMI/RFI Filtering Market Value Share Analysis, By Application (2020)
Figure 125: South America EMI/RFI Filtering Market Value Share Analysis, By Application (2030)
Figure 126: South America EMI/RFI Filtering Market Value Share Analysis, by Country (2020F)
Figure 127: South America EMI/RFI Filtering Market Value Share Analysis, by Country (2030F)
Figure 128: South America EMI/RFI Filtering Market Volume Share Analysis, by Country (2020F)
Figure 129: South America EMI/RFI Filtering Market Volume Share Analysis, by Country (2030F )
Figure 130: South America EMI/RFI Filtering Market Attractiveness Analysis, By Filter Type
Figure 131: South America EMI/RFI Filtering Market Attractiveness Analysis, By Design
Figure 132: South America EMI/RFI Filtering Market Attractiveness Analysis, by Application
Figure 133: South America EMI/RFI Filtering Market Attractiveness Analysis, by Country
Figure 134: Global EMI/RFI Filtering Market Share Analysis, by Company
Copyright © Transparency Market Research, Inc. All Rights reserved
Trust Online


EMI/RFI Filtering Market