
Analysts’ Viewpoint on Market Scenario
The increased use of electronic items, combined with shorter product lifecycles, is driving the global e-scrap recycling market share. The market is expected to grow significantly during the forecast period, owing to the increase in disposable income of the people, urbanization, and industrialization in most parts of the world, which is leading to a rise in the amount of electrical and electronic equipment, and thus e-scrap. Furthermore, growth in awareness among electric and electronic product users about environmental issues related to landfills and the hazardous effects of e-scrap, as well as stringent government regulations to prevent improper disposal make electronic scrap one of the fastest growing recycling segments. E-waste recycling companies are focusing on research and development in order to build new recycling facilities and new recycling technologies, as well as cover unexplored areas post the COVID-19 impact.
The global e-scrap recycling industry has become an integral part of the modern society not only due to its social and economic impact, but also because it plays a vital role in the future of our planet. Extraction of valuable metals and other useful materials offers lucrative opportunities for top companies in e-waste management, especially in untapped markets.
The global e-scrap recycling market is projected to grow at a significant pace during the forecast period, owing to the presence of institutions dealing with environmental issues, including e-scrap management, and availability of large e-scrap volume across the globe.
Request a sample to get extensive insights into the E-scrap Recycling Market
The need for electronic and electrical equipment has increased significantly as a result of technological improvements. E-scrap comprises laptops, computers, mobile phones, television sets, and other electrical or electronic household appliances, primarily fueled by expanding markets and rapid product innovations such as the switch from analog to digital technologies.
E-scrap production is rising rapidly on a worldwide scale. It is anticipated to keep rising in the next few years. E-scrap is thought to be dangerous and thus needs to be handled and treated carefully. Furthermore, the existence of other precious metals in e-scrap, including gold, silver, palladium, tantalum, and gallium, makes e-waste attractive for recycling.
Elimination of environmental and health risks brought on by the disposal of electronic waste in landfills is one of the major benefits of electronic recycling. Lead, mercury, cadmium, arsenic, and antimony are just a few of the dangerous and non-biodegradable materials that are present in significant amounts in e-scrap. These harmful materials pollute water and soil when e-waste is dumped in landfills, thus posing health risks.
Electronic waste management reduces the risk to human health and the environment. The e-scrap recycling business is anticipated to grow in the near future with the rise in awareness about environmental issues of landfills. Electronic scrap is one of the fastest growing recycling categories due to the toxic consequences of e-scrap and strict regulatory restrictions to prevent incorrect disposal. Hence, Implementation of strict laws pertaining to environment-friendly processing of e-waste is driving market growth.
Cities are predicted to produce the majority of e-waste. Therefore, it is crucial to manage this waste appropriately. It is also vital to increase collection and recycling rates and lessen the quantity of e-waste that ends up in landfills. New and interesting prospects are presented by the development of smart cities and the use of ICT for trash management. High discretionary income, urbanization, and industrialization are contributing to an increase in usage of electrical and electronic equipment, which in turn is causing a rise in e-scrap.
More than 60% of the entire amount of electronic waste produced is not recycled and is either illegally exported or dumped in landfills. This is seen as an opportunity for the market for recycling electronic waste. A further possibility for e-waste management is the engagement of e-scrap companies in charity, small-scale pilot projects, or event-based collections that help collect tiny, high-value waste of electrical and electronic equipment (WEEE).
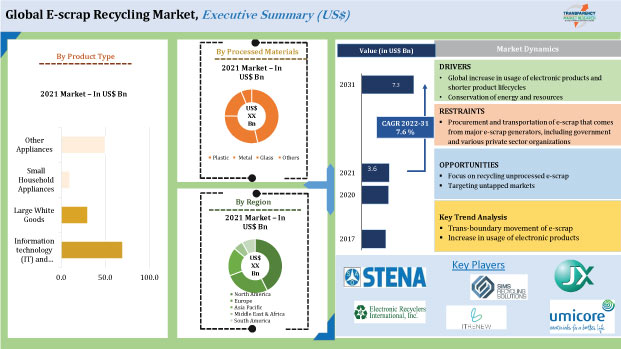
In terms of product type, the large white goods segment has been classified into refrigerators/freezers, washing machines, dishwashers, and others. Large white goods dominate the e-scrap recycling business. Increase in demand for refrigerators and freezers, washing machines, dishwashers, and many other consumer electronic goods has resulted in a rise in recycling of large white goods.
Implementation of stringent regulatory frameworks regarding the recycling of electronic waste across the globe has resulted in growth in recycling of large white goods. Large white goods are closely followed by small household appliances such as toasters, coffee makers, and hair dryers. Rise in usage of these appliances worldwide is benefitting e-waste suppliers. IT-related products such as computers and laptops, telephones and mobile phones, as well as printers and scanners also hold substantial share of the market for electronic waste recycling.
In terms of processed materials, the market has been divided into plastic, metal, glass, and others. The metal segment dominates the market and is further anticipated to grow during the forecast period. Plastic, on the other hand, is gradually gaining market share owing to its wide application in consumer electronic products. Plastic resins such as acrylonitrile butadiene styrene (ABS), high impact polystyrene (HIPS), and expanded polystyrene (EPS) are extensively used in consumer electronic products. Plastic recycling is anticipated to increase considerably in the next couple of years due to the rise in usage of plastics.
Europe dominated the global e-scrap recycling industry in 2021. It was closely followed by Asia Pacific and North America, respectively, in the same year. Amendment of stringent regulations regarding the e-scrap recycling process in Europe, North America, and countries in Asia is driving the market in these regions. Rise in trend of export of electronic waste from western countries to Asia has helped Asia Pacific acquire a significant share of the global e-scrap recycling market.
The global e-scrap recycling market is consolidated, with a few large-scale vendors controlling a majority of the share. Most firms are investing significantly in comprehensive research and development activities to increase the availability of e-waste solutions. As per the electronic recycling industry analysis, mergers and acquisitions are important strategies adopted by key players. JX Nippon Mining and Metal Corporation, Umicore N.V., DOWA HOLDINGS Co., Ltd, Sims Metal Management, STENA METALL AB, ITRenew, Inc., Electronic Recyclers International, Enviro-Hub Holdings Ltd., and Ecoreco Ltd. are the prominent entities operating in this market.
Organization for Economic Cooperation and Development (OECD), the Basel Convention, and bilateral agreements between the U.S. and Canada, Mexico, Costa Rica, Malaysia, and the Philippines monitor the export-import practices of e-scrap across the globe.
Request a custom report on E-scrap Recycling Market
Each of these players has been profiled in the e-scrap recycling market report based on parameters such as company overview, financial overview, business strategies, product portfolio, business segments, and recent developments.
|
Attribute |
Detail |
|
Market Size Value in 2021 |
US$ 3.6 Bn |
|
Market Forecast Value in 2031 |
US$ 7.3 Bn |
|
Growth Rate (CAGR) |
7.6% |
|
Forecast Period |
2022–2031 |
|
Historical Data Available for |
2017–2020 |
|
Quantitative Units |
US$ Bn for Value & Thousand Units for Volume |
|
Market Analysis |
Includes cross-segment analysis at the region as well as country level. Furthermore, the qualitative analysis includes drivers, restraints, opportunities, key trends, Porter’s Five Forces analysis, value chain analysis, and key trend analysis. |
|
Competition Landscape |
|
|
Format |
Electronic (PDF) + Excel |
|
Market Segmentation |
|
|
Countries Covered |
|
|
Companies Profiled |
|
|
Customization Scope |
Available upon request |
|
Pricing |
Available upon request |
The market stood at US$ 3.6 Bn in 2021
The market is estimated to grow at a CAGR of 7.6% during 2022-2031
The market is likely to reach US$ 7.3 Bn by 2031
The large white goods segment is expected to have the highest growth rate during the forecast period
Europe to hold the highest CAGR during the forecast period
Increase in usage of electronic products and shorter product lifecycles; and implementation of stringent laws to avoid adverse environmental effect
JX Nippon Mining and Metal Corporation, Umicore N.V., DOWA HOLDINGS Co., Ltd, Sims Metal Management, STENA METALL AB, ITRenew, Inc., Electronic Recyclers International, Enviro-Hub Holdings Ltd., Ecoreco Ltd., and Global Electric Electronic Processing Inc.
1. Preface
1.1. Market Definition and Scope
1.2. Market Segmentation
1.3. Key Research Objectives
1.4. Research Highlights
2. Assumptions
3. Research Methodology
4. Executive Summary
5. Market Overview
5.1. Market Dynamics
5.1.1. Drivers
5.1.2. Restraints
5.1.3. Opportunities
5.2. Key Trends Analysis
5.2.1. Demand Side Analysis
5.2.2. Supply Side Analysis
5.3. Key Market Indicators
5.3.1. Overall Electronic Equipment Industry Overview
5.4. Porter’s Five Forces Analysis
5.5. Value Chain Analysis
5.6. Industry SWOT Analysis
5.7. COVID-19 Impact Analysis
5.8. Technological Overview
5.9. Standards and Regulations
5.10. Global E-scrap Recycling Market Analysis and Forecast, 2017 - 2031
5.10.1. Market Revenue Projections (US$ Mn)
5.10.2. Market Revenue Projections (Thousand Units)
6. Global E-scrap Recycling Market Analysis and Forecast, By Product Type
6.1. Global E-scrap Recycling Market (US$ Mn and Thousand Units) Forecast, By Product Type, 2017 - 2031
6.1.1. Information Technology (IT) and Telecommunications Equipment
6.1.1.1. Computers & Laptops
6.1.1.2. Telephones & Mobile Phones
6.1.1.3. Printers & Scanners
6.1.1.4. Photocopiers
6.1.1.5. Others (Tablets, Wi-Fi devices etc.)
6.1.2. Large White Goods
6.1.2.1. Refrigerators/Freezers
6.1.2.2. Washing Machines
6.1.2.3. Dishwashers
6.1.2.4. Others (Dishwashers, cooking ranges etc.)
6.1.3. Small Household Appliances
6.1.3.1. Toasters
6.1.3.2. Coffee Makers
6.1.3.3. Hairdryers
6.1.3.4. Stereo Equipment
6.1.3.5. Others (Irons, electric toothbrushes etc.)
6.1.4. Other Appliances (Handheld Drills, sports Equipment, Electronic Toys etc.)
6.2. Incremental Opportunity, By Product Type
7. Global E-scrap Recycling Market Analysis and Forecast, By Processed Materials
7.1. Global E-scrap Recycling Market (US$ Mn and Thousand Units) Forecast, By Processed Materials, 2017 - 2031
7.1.1. Plastic
7.1.2. Metal
7.1.2.1. Ferrous
7.1.2.2. Non-ferrous
7.1.2.3. Other Precious Metal
7.1.3. Glass
7.1.4. Others (Aluminum, polycarbonate etc.)
7.2. Incremental Opportunity, By Processed Materials
8. Global E-scrap Recycling Market Analysis and Forecast, by Region
8.1. Global E-scrap Recycling Market (US$ Mn and Thousand Units), by Region, 2017 - 2031
8.1.1. North America
8.1.2. Europe
8.1.3. Asia Pacific
8.1.4. Middle East & Africa
8.1.5. South America
8.2. Incremental Opportunity, by Region
9. North America E-scrap Recycling Market Analysis and Forecast
9.1. Regional Snapshot
9.2. COVID 19 Impact Analysis
9.3. Price Trend Analysis
9.3.1. Weighted Average Selling Price (US$)
9.4. Key Trends Analysis
9.4.1. Demand Side
9.4.2. Supply Side
9.5. Key Supplier Analysis
9.6. E-scrap Recycling Market (US$ Mn and Thousand Units) Forecast, By Product Type, 2017 - 2031
9.6.1. Information Technology (IT) and Telecommunications Equipment
9.6.1.1. Computers & Laptops
9.6.1.2. Telephones & Mobile Phones
9.6.1.3. Printers & Scanners
9.6.1.4. Photocopiers
9.6.1.5. Others (Tablets, Wi-Fi devices etc.)
9.6.2. Large White Goods
9.6.2.1. Refrigerators/Freezers
9.6.2.2. Washing Machines
9.6.2.3. Dishwashers
9.6.2.4. Others (Dishwashers, Cooking Ranges etc.)
9.6.3. Small Household Appliances
9.6.3.1. Toasters
9.6.3.2. Coffee Makers
9.6.3.3. Hairdryers
9.6.3.4. Stereo Equipment
9.6.3.5. Others (Irons, Electric Toothbrushes etc.)
9.6.4. Other Appliances (Handheld Drills, Sports Equipment, Electronic Toys etc.)
9.7. E-scrap Recycling Market (US$ Mn and Thousand Units) Forecast, By Processed Materials, 2017 - 2031
9.7.1. Plastic
9.7.2. Metal
9.7.2.1. Ferrous
9.7.2.2. Non-ferrous
9.7.2.3. Other Precious Metal
9.7.3. Glass
9.7.4. Others (Aluminum, polycarbonate etc.)
9.8. E-scrap Recycling Market (US$ Mn and Thousand Units), by Country & Sub-region, 2017 - 2031
9.8.1. U.S.
9.8.2. Canada
9.8.3. Rest of North America
9.9. Incremental Opportunity Analysis
9.10. Europe E-scrap Recycling Market Analysis and Forecast
9.11. Regional Snapshot
9.12. COVID 19 Impact Analysis
9.13. Price Trend Analysis
9.13.1. Weighted Average Selling Price (US$)
9.14. Key Trends Analysis
9.14.1. Demand Side
9.14.2. Supply Side
9.15. Key Supplier Analysis
9.16. E-scrap Recycling Market (US$ Mn and Thousand Units) Forecast, By Product Type, 2017 - 2031
9.16.1. Information Technology (IT) and Telecommunications Equipment
9.16.1.1. Computers & Laptops
9.16.1.2. Telephones & Mobile Phones
9.16.1.3. Printers & Scanners
9.16.1.4. Photocopiers
9.16.1.5. Others (Tablets, Wi-Fi devices etc.)
9.16.2. Large White Goods
9.16.2.1. Refrigerators/Freezers
9.16.2.2. Washing Machines
9.16.2.3. Dishwashers
9.16.2.4. Others (Dishwashers, cooking ranges etc.)
9.16.3. Small Household Appliances
9.16.3.1. Toasters
9.16.3.2. Coffee Makers
9.16.3.3. Hairdryers
9.16.3.4. Stereo Equipment
9.16.3.5. Others (Irons, electric toothbrushes etc.)
9.16.4. Other Appliances (Handheld Drills, sports equipment, electronic toys etc.)
9.17. E-scrap Recycling Market (US$ Mn and Thousand Units) Forecast, By Processed Materials, 2017 - 2031
9.17.1. Plastic
9.17.2. Metal
9.17.2.1. Ferrous
9.17.2.2. Non-ferrous
9.17.2.3. Other Precious Metal
9.17.3. Glass
9.17.4. Others (Aluminum, polycarbonate etc.)
9.18. E-scrap Recycling Market (US$ Mn and Thousand Units), by Country & Sub-region, 2017 - 2031
9.18.1. Germany
9.18.2. U.K.
9.18.3. France
9.18.4. Rest of Europe
9.19. Incremental Opportunity Analysis
10. Asia Pacific E-scrap Recycling Market Analysis and Forecast
10.1. Regional Snapshot
10.2. COVID 19 Impact Analysis
10.3. Price Trend Analysis
10.3.1. Weighted Average Selling Price (US$)
10.4. Key Trends Analysis
10.4.1. Demand Side
10.4.2. Supply Side
10.5. Key Supplier Analysis
10.6. E-scrap Recycling Market (US$ Mn and Thousand Units) Forecast, By Product Type, 2017 - 2031
10.6.1. Information Technology (IT) and Telecommunications Equipment
10.6.1.1. Computers & Laptops
10.6.1.2. Telephones & Mobile Phones
10.6.1.3. Printers & Scanners
10.6.1.4. Photocopiers
10.6.1.5. Others (Tablets, Wi-Fi devices etc.)
10.6.2. Large White Goods
10.6.2.1. Refrigerators/Freezers
10.6.2.2. Washing Machines
10.6.2.3. Dishwashers
10.6.2.4. Others (Dishwashers, cooking ranges etc.)
10.6.3. Small Household Appliances
10.6.3.1. Toasters
10.6.3.2. Coffee Makers
10.6.3.3. Hairdryers
10.6.3.4. Stereo Equipment
10.6.3.5. Others (Irons, electric toothbrushes etc.)
10.6.4. Other Appliances (Handheld Drills, sports equipment, electronic toys etc.)
10.7. E-scrap Recycling Market (US$ Mn and Thousand Units) Forecast, By Processed Materials, 2017 - 2031
10.7.1. Plastic
10.7.2. Metal
10.7.2.1. Ferrous
10.7.2.2. Non-ferrous
10.7.2.3. Other Precious Metal
10.7.3. Glass
10.7.4. Others (Aluminum, polycarbonate etc.)
10.8. E-scrap Recycling Market (US$ Mn and Thousand Units), by Country & Sub-region, 2017 - 2031
10.8.1. China
10.8.2. India
10.8.3. Japan
10.8.4. Rest of Asia Pacific
10.9. Incremental Opportunity Analysis
11. Middle East & Africa E-scrap Recycling Market Analysis and Forecast
11.1. Regional Snapshot
11.2. COVID 19 Impact Analysis
11.3. Price Trend Analysis
11.3.1. Weighted Average Selling Price (US$)
11.4. Key Trends Analysis
11.4.1. Demand Side
11.4.2. Supply Side
11.5. Key Supplier Analysis
11.6. E-scrap Recycling Market (US$ Mn and Thousand Units) Forecast, By Product Type, 2017 - 2031
11.6.1. Information Technology (IT) and Telecommunications Equipment
11.6.1.1. Computers & Laptops
11.6.1.2. Telephones & Mobile Phones
11.6.1.3. Printers & Scanners
11.6.1.4. Photocopiers
11.6.1.5. Others (Tablets, Wi-Fi devices etc.)
11.6.2. Large White Goods
11.6.2.1. Refrigerators/Freezers
11.6.2.2. Washing Machines
11.6.2.3. Dishwashers
11.6.2.4. Others (Dishwashers, cooking ranges etc.)
11.6.3. Small Household Appliances
11.6.3.1. Toasters
11.6.3.2. Coffee Makers
11.6.3.3. Hairdryers
11.6.3.4. Stereo Equipment
11.6.3.5. Others (Irons, electric toothbrushes etc.)
11.6.4. Other Appliances (Handheld Drills, sports equipment, electronic toys etc.)
11.7. E-scrap Recycling Market (US$ Mn and Thousand Units) Forecast, By Processed Materials, 2017 - 2031
11.7.1. Plastic
11.7.2. Metal
11.7.2.1. Ferrous
11.7.2.2. Non-ferrous
11.7.2.3. Other Precious Metal
11.7.3. Glass
11.7.4. Others (Aluminum, polycarbonate etc.)
11.8. E-scrap Recycling Market (US$ Mn and Thousand Units), by Country & Sub-region, 2017 - 2031
11.8.1. GCC
11.8.2. South Africa
11.8.3. Rest of Middle East & Africa
11.9. Incremental Opportunity Analysis
12. South America E-scrap Recycling Market Analysis and Forecast
12.1. Regional Snapshot
12.2. COVID 19 Impact Analysis
12.3. Price Trend Analysis
12.3.1. Weighted Average Selling Price (US$)
12.4. Key Trends Analysis
12.4.1. Demand Side
12.4.2. Supply Side
12.5. Key Supplier Analysis
12.6. E-scrap Recycling Market (US$ Mn and Thousand Units) Forecast, By Product Type, 2017 - 2031
12.6.1. Information Technology (IT) and Telecommunications Equipment
12.6.1.1. Computers & Laptops
12.6.1.2. Telephones & Mobile Phones
12.6.1.3. Printers & Scanners
12.6.1.4. Photocopiers
12.6.1.5. Others (Tablets, Wi-Fi devices etc.)
12.6.2. Large White Goods
12.6.2.1. Refrigerators/Freezers
12.6.2.2. Washing Machines
12.6.2.3. Dishwashers
12.6.2.4. Others (Dishwashers, cooking ranges etc.)
12.6.3. Small Household Appliances
12.6.3.1. Toasters
12.6.3.2. Coffee Makers
12.6.3.3. Hairdryers
12.6.3.4. Stereo Equipment
12.6.3.5. Others (Irons, electric toothbrushes etc.)
12.6.4. Other Appliances (Handheld Drills, sports equipment, electronic toys etc.)
12.7. E-scrap Recycling Market (US$ Mn and Thousand Units) Forecast, By Processed Materials, 2017 - 2031
12.7.1. Plastic
12.7.2. Metal
12.7.2.1. Ferrous
12.7.2.2. Non-ferrous
12.7.2.3. Other Precious Metal
12.7.3. Glass
12.7.4. Others (Aluminum, polycarbonate etc.)
12.8. E-scrap Recycling Market (US$ Mn and Thousand Units), by Country & Sub-region, 2017 - 2031
12.8.1. Brazil
12.8.2. Rest of South America
12.9. Incremental Opportunity Analysis
13. Competition Landscape
13.1. Market Player – Competition Dashboard
13.2. Market Revenue Share Analysis (%), By Company, (2020)
13.3. Company Profiles (Details – Company Overview, Sales Area/Geographical Presence, Revenue, Strategy & Business Overview)
13.3.1. JX Nippon Mining and Metal Corporation
13.3.1.1. Company Overview
13.3.1.2. Sales Area/Geographical Presence
13.3.1.3. Revenue
13.3.1.4. Strategy & Business Overview
13.3.2. Umicore N.V.
13.3.2.1. Company Overview
13.3.2.2. Sales Area/Geographical Presence
13.3.2.3. Revenue
13.3.2.4. Strategy & Business Overview
13.3.3. DOWA HOLDINGS Co., Ltd
13.3.3.1. Company Overview
13.3.3.2. Sales Area/Geographical Presence
13.3.3.3. Revenue
13.3.3.4. Strategy & Business Overview
13.3.4. Sims Metal Management
13.3.4.1. Company Overview
13.3.4.2. Sales Area/Geographical Presence
13.3.4.3. Revenue
13.3.4.4. Strategy & Business Overview
13.3.5. STENA METALL AB
13.3.5.1. Company Overview
13.3.5.2. Sales Area/Geographical Presence
13.3.5.3. Revenue
13.3.5.4. Strategy & Business Overview
13.3.6. ITRenew, Inc.
13.3.6.1. Company Overview
13.3.6.2. Sales Area/Geographical Presence
13.3.6.3. Revenue
13.3.6.4. Strategy & Business Overview
13.3.7. Electronic Recyclers International
13.3.7.1. Company Overview
13.3.7.2. Sales Area/Geographical Presence
13.3.7.3. Revenue
13.3.7.4. Strategy & Business Overview
13.3.8. Enviro-Hub Holdings Ltd.
13.3.8.1. Company Overview
13.3.8.2. Sales Area/Geographical Presence
13.3.8.3. Revenue
13.3.8.4. Strategy & Business Overview
13.3.9. Ecoreco Ltd.
13.3.9.1. Company Overview
13.3.9.2. Sales Area/Geographical Presence
13.3.9.3. Revenue
13.3.9.4. Strategy & Business Overview
13.3.10. Global Electric Electronic Processing Inc.
13.3.10.1. Company Overview
13.3.10.2. Sales Area/Geographical Presence
13.3.10.3. Revenue
13.3.10.4. Strategy & Business Overview
14. Key Takeaway
14.1. Identification of Potential Market Spaces
14.1.1. Product Type
14.1.2. Processed Materials
14.1.3. Region
14.2. Understanding the Procurement Process of Customers
14.3. Prevailing Market Risks
List Of Tables
Table 1: Global E-scrap Recycling Market Value, by Product Type, US$ Mn, 2017-2031
Table 2: Global E-scrap Recycling Market Volume, by Product Type, Thousand Units,2017-2031
Table 3: Global E-scrap Recycling Market Value, by Processed Materials, US$ Mn, 2017-2031
Table 4: Global E-scrap Recycling Market Volume, by Processed Materials, Thousand Units,2017-2031
Table 5: Global E-scrap Recycling Market Value, by Region, US$ Mn, 2017-2031
Table 6: Global E-scrap Recycling Market Volume, by Region, Thousand Units,2017-2031
Table 7: North America Global E-scrap Recycling Market Value, by Product Type, US$ Mn, 2017-2031
Table 8: North America Global E-scrap Recycling Market Volume, by Product Type, Thousand Units,2017-2031
Table 9: North America Global E-scrap Recycling Market Value, by Processed Materials, US$ Mn, 2017-2031
Table 10: North America Global E-scrap Recycling Market Volume, by Processed Materials, Thousand Units,2017-2031
Table 11: North America Global E-scrap Recycling Market Value, by Country, US$ Mn, 2017-2031
Table 12: North America Global E-scrap Recycling Market Volume, by Country, Thousand Units,2017-2031
Table 13: Europe E-scrap Recycling Market Value, by Product Type, US$ Mn, 2017-2031
Table 14: Europe E-scrap Recycling Market Volume, by Product Type, Thousand Units,2017-2031
Table 15: Europe E-scrap Recycling Market Value, by Processed Materials, US$ Mn, 2017-2031
Table 16: Europe E-scrap Recycling Market Volume, by Processed Materials, Thousand Units,2017-2031
Table 17: Europe E-scrap Recycling Market Value, by Country, US$ Mn, 2017-2031
Table 18: Europe E-scrap Recycling Market Volume, by Country, Thousand Units,2017-2031
Table 19: Asia Pacific Global E-scrap Recycling Market Value, by Product Type, US$ Mn, 2017-2031
Table 20: Asia Pacific Global E-scrap Recycling Market Volume, by Product Type, Thousand Units,2017-2031
Table 21: Asia Pacific Global E-scrap Recycling Market Value, by Processed Materials, US$ Mn, 2017-2031
Table 22: Asia Pacific Global E-scrap Recycling Market Volume, by Processed Materials, Thousand Units,2017-2031
Table 23: Asia Pacific Global E-scrap Recycling Market Value, by Country, US$ Mn, 2017-2031
Table 24: Asia Pacific Global E-scrap Recycling Market Volume, by Country, Thousand Units,2017-2031
Table 25: MEA Global E-scrap Recycling Market Value, by Product Type, US$ Mn, 2017-2031
Table 26: MEA Global E-scrap Recycling Market Volume, by Product Type, Thousand Units,2017-2031
Table 27: MEA Global E-scrap Recycling Market Value, by Processed Materials, US$ Mn, 2017-2031
Table 28: MEA Global E-scrap Recycling Market Volume, by Processed Materials, Thousand Units,2017-2031
Table 29: MEA Global E-scrap Recycling Market Value, by Country, US$ Mn, 2017-2031
Table 30: MEA Global E-scrap Recycling Market Volume, by Country, Thousand Units,2017-2031
Table 31: South America Global E-scrap Recycling Market Value, by Product Type, US$ Mn, 2017-2031
Table 32: South America Global E-scrap Recycling Market Volume, by Product Type, Thousand Units,2017-2031
Table 33: South America Global E-scrap Recycling Market Value, by Processed Materials, US$ Mn, 2017-2031
Table 34: South America Global E-scrap Recycling Market Volume, by Processed Materials, Thousand Units,2017-2031
Table 35: South America Global E-scrap Recycling Market Value, by Country, US$ Mn, 2017-2031
Table 36: South America Global E-scrap Recycling Market Volume, by Country, Thousand Units,2017-2031
List of Figures
Figure 1: Global E-scrap Recycling Market Value, by Product Type, US$ Mn, 2017-2031
Figure 2: Global E-scrap Recycling Market Volume, by Product Type, Thousand Units,2017-2031
Figure 3: Global E-scrap Recycling Market Incremental Opportunity Processed Materials, by Product Type, 2021-2031
Figure 4: Global E-scrap Recycling Market Value, by Processed Materials, US$ Mn, 2017-2031
Figure 5: Global E-scrap Recycling Market Volume, by Processed Materials, Thousand Units,2017-2031
Figure 6: Global E-scrap Recycling Market Incremental Opportunity Processed Materials, by Processed Materials, 2021-2031
Figure 7: Global E-scrap Recycling Market Value, by Region, US$ Mn, 2017-2031
Figure 8: Global E-scrap Recycling Market Volume, by Region, Thousand Units,2017-2031
Figure 9: Global E-scrap Recycling Market Incremental Opportunity Processed Materials, by Region,2021-2031
Figure 10: North America E-scrap Recycling Market Value, by Product Type, US$ Mn, 2017-2031
Figure 11: North America E-scrap Recycling Market Volume, by Product Type, Thousand Units,2017-2031
Figure 12: North America E-scrap Recycling Market Incremental Opportunity Processed Materials, by Product Type, 2021-2031
Figure 13: North America E-scrap Recycling Market Value, by Processed Materials, US$ Mn, 2017-2031
Figure 14: North America E-scrap Recycling Market Volume, by Processed Materials, Thousand Units,2017-2031
Figure 15: North America E-scrap Recycling Market Incremental Opportunity Processed Materials, by Processed Materials, 2021-2031
Figure 16: North America E-scrap Recycling Market Value, by Country, US$ Mn, 2017-2031
Figure 17: North America E-scrap Recycling Market Volume, by Country, Thousand Units,2017-2031
Figure 18: North America E-scrap Recycling Market Incremental Opportunity Processed Materials, by Country, 2021-2031
Figure 19: Europe E-scrap Recycling Market Value, by Product Type, US$ Mn, 2017-2031
Figure 20: Europe E-scrap Recycling Market Volume, by Product Type, Thousand Units,2017-2031
Figure 21: Europe E-scrap Recycling Market Incremental Opportunity Processed Materials, by Product Type, 2021-2031
Figure 22: Europe E-scrap Recycling Market Value, by Processed Materials, US$ Mn, 2017-2031
Figure 23: Europe E-scrap Recycling Market Volume, by Processed Materials, Thousand Units,2017-2031
Figure 24: Europe E-scrap Recycling Market Incremental Opportunity Processed Materials, by Processed Materials, 2021-2031
Figure 25: Europe E-scrap Recycling Market Value, by Country, US$ Mn, 2017-2031
Figure 26: Europe E-scrap Recycling Market Volume, by Country, Thousand Units,2017-2031
Figure 27: Europe E-scrap Recycling Market Incremental Opportunity Processed Materials, by Country, 2021-2031
Figure 28: Asia Pacific E-scrap Recycling Market Value, by Product Type, US$ Mn, 2017-2031
Figure 29: Asia Pacific E-scrap Recycling Market Volume, by Product Type, Thousand Units,2017-2031
Figure 30: Asia Pacific E-scrap Recycling Market Incremental Opportunity Processed Materials, by Product Type, 2021-2031
Figure 31: Asia Pacific E-scrap Recycling Market Value, by Processed Materials, US$ Mn, 2017-2031
Figure 32: Asia Pacific E-scrap Recycling Market Volume, by Processed Materials, Thousand Units,2017-2031
Figure 33: Asia Pacific E-scrap Recycling Market Incremental Opportunity Processed Materials, by Processed Materials, 2021-2031
Figure 34: Asia Pacific E-scrap Recycling Market Value, by Country, US$ Mn, 2017-2031
Figure 35: Asia Pacific E-scrap Recycling Market Volume, by Country, Thousand Units,2017-2031
Figure 36: Asia Pacific E-scrap Recycling Market Incremental Opportunity Processed Materials, by Country, 2021-2031
Figure 37: MEA E-scrap Recycling Market Value, by Product Type, US$ Mn, 2017-2031
Figure 38: MEA E-scrap Recycling Market Volume, by Product Type, Thousand Units,2017-2031
Figure 39: MEA E-scrap Recycling Market Incremental Opportunity Processed Materials, by Product Type, 2021-2031
Figure 40: MEA E-scrap Recycling Market Value, by Processed Materials, US$ Mn, 2017-2031
Figure 41: MEA E-scrap Recycling Market Volume, by Processed Materials, Thousand Units,2017-2031
Figure 42: MEA E-scrap Recycling Market Incremental Opportunity Processed Materials, by Processed Materials, 2021-2031
Figure 43: MEA E-scrap Recycling Market Value, by Country, US$ Mn, 2017-2031
Figure 44: MEA E-scrap Recycling Market Volume, by Country, Thousand Units,2017-2031
Figure 45: MEA E-scrap Recycling Market Incremental Opportunity Processed Materials, by Country, 2021-2031
Figure 46: South America E-scrap Recycling Market Value, by Product Type, US$ Mn, 2017-2031
Figure 47: South America E-scrap Recycling Market Volume, by Product Type, Thousand Units,2017-2031
Figure 48: South America E-scrap Recycling Market Incremental Opportunity Processed Materials, by Product Type, 2021-2031
Figure 49: South America E-scrap Recycling Market Value, by Processed Materials, US$ Mn, 2017-2031
Figure 50: South America E-scrap Recycling Market Volume, by Processed Materials, Thousand Units,2017-2031
Figure 51: South America E-scrap Recycling Market Incremental Opportunity Processed Materials, by Processed Materials, 2021-2031
Figure 52: South America E-scrap Recycling Market Value, by Country, US$ Mn, 2017-2031
Figure 53: South America E-scrap Recycling Market Volume, by Country, Thousand Units,2017-2031
Figure 54: South America E-scrap Recycling Market Incremental Opportunity Processed Materials, by Country, 2021-2031
Copyright © Transparency Market Research, Inc. All Rights reserved
Trust Online


E-scrap Recycling Market