
Dairy Alternatives Market - Snapshot
A rise in the focus of consumers on the various nutritional values such as high vitamin and protein content and low calories of milk is likely to influence the growth trajectory of the global dairy alternatives market in the near future.
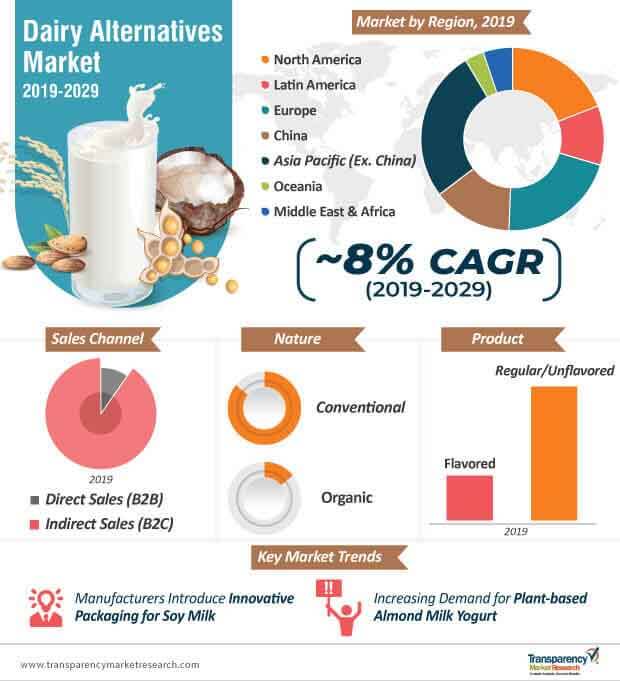
Soymilk is a popular dairy alternative, which comes with multiple minerals such as magnesium, potassium, sodium, zinc, phosphorous, calcium, and iron. This dairy alternative is extremely popular amongst patients with heart issues as it diminishes levels of cholesterol. In addition to that, soymilk comes with as much protein as cow milk and is quite low in calories as compared to skim and whole milk. As such, augmented consumption of soymilk is likely to drive the demand for dairy alternatives in the years to come. It is estimated that consumption of dairy alternatives is likely to rise with the outbreak of a global pandemic, COVID-19. In a bid to boost immunity to survive COVID-19, people are expected to increase consumption of nutritious dairy alternatives. As such, it is expected that the global dairy alternatives market is likely to witness rapid growth during the times of COVID-19 and afterwards.
Expansion in the Pool of Geriatric Population to Spell Growth of the Market
Many consumers consider a vegan diet to be a highly nutritious and healthy one. Such people prefer having various dairy alternatives such as
In addition, many other plant-based milk products. Increased adoption of a vegan diet is likely to play a positive role in the expansion of the global dairy alternatives market.
Implementation of effective marketing technologies such as segmentation and diversification can lead to an increase in the sales of dairy alternatives. The main objective behind such marketing strategies is to generate demand for these products amongst various types of consumers such as vegans, trainers, and lactose intolerant consumers. Furthermore, it is essential to place the product at the right place, right time, and through the right channel of sales.
Players in the dairy alternatives market are introducing unique dairy alternatives in the food and beverage landscape. According to NIH (National Institutes of Health), ~65% of the world population faces the issue of lactose intolerance. This is why manufacturers in the dairy alternatives market are innovating on alternatives such as soy milk with chickpea protein.
To add further value to their products, dairy alternatives market manufacturers are innovating on novel packaging options such as microwaveable aseptic carton packs. In order to provide 'on-the-go' convenience for consumers, soy milk is designed to be served warm with first-of-its-kind technology of microwaveable packaging. This helps in brand enhancement and premiumization of nutritional beverages, which leads to flexibility for sales through various distribution channels.
Manufacturers in the dairy alternatives market are developing fail-safe packaging mechanisms to protect the product from light, oxygen, scent, water, and even overheating. As such, dairy alternatives market players are increasing the distribution of soy milk products using online retail channels, groceries, and convenience stores. The nutritional value of soy milk is leveraged with high protein ingredients such as cabbage, banana, broccoli, and the like.
To understand how our report can bring difference to your business strategy, Ask for a brochure
Manufacturers are increasing product line offerings with expansions in non-dairy alternatives. They are introducing plant-based offerings such as almond milk yogurt. This dairy alternative is made using premium-quality almonds and interesting add-ons such as granola and chocolate chips, to provide excellent taste and texture to the product. Plant-based almond milk yogurt serves as a high quality dairy alternative, free from allergens such as lactose.
Due to the growing demand from consumers for delicious plant-based foods, manufacturers are introducing the crunchy goodness of almonds and other toppings to bring innovation into the growing plant-based yogurt space. For instance, in May 2019, Blue Diamond Growers — a California agricultural cooperative, announced the launch of Almond Breeze Almond milk Yogurt Alternative, a dairy substitute that is a new addition to its plant-based yogurt category.
As the dairy alternatives market is estimated to grow to a value of ~US$ 34.6 billion by the year 2029, oat milk is gaining consumer attention with the introduction of innovative oat milk beverages. Companies are looking to profit from the surge in non-dairy milk sales, and are introducing oat beverages in unflavored as well as flavored essence, such as vanilla.
Request a sample to get extensive insights into the Dairy Alternatives Market
The dairy alternatives market has dominated product innovation and grown tremendously in the last couple of years, which has led to a significant threat to the sales of traditional dairy products. However, the growing demand for plant-based foods has given rise to environmental concerns. Manufacturers have to exert tremendous pressure on water resources to cultivate almonds. Also, rice emits the most greenhouse gases, such as methane, due to bacterial activity in flooded rice paddies. The cultivation of soy and oats requires large land areas, thus leading to deforestation.
Since children are one of the key consumers of dairy alternatives and plant-based milks, the nutritional content of certain plant-based milks do not suffice requirements. For example, almond milk is low in protein, rice milk contains low levels of arsenic, and hemp milk is not easily available in supermarkets and other retail stores. Thus, market players need to consider long-term environmental costs and dietary changes of consumers from dairy to plant-based diets to effectively push the sales of non-dairy products.
Stuck in a neck-to-neck competition with other brands? Request a custom report on “Dairy Alternatives Market”
Dairy Alternatives Market: Analysts’ Viewpoint
Analysts of the dairy alternatives market opine that the market will experience promising growth during the forecast period. Manufacturers must cater to the growing demand for microwaveable and nutritious plant-based beverages for on-the-go consumption, especially targeting in Asia. The concept of active nutrition is increasing in the sports nutrition space with the growing adoption of plant-based diets. Also, vegan cheese is triggering sales in the dairy alternatives market. However, market players are challenged with environmental costs and lack of product availability in developing economies. Thus, manufacturers are adopting sustainable crop cultivation techniques, and increasing distribution via online home shopping channels, specialty stores, and supermarkets. Market players should focus on innovative offerings in soy and almond milk products.
Dairy Alternatives Remain More Preferred than Dairy Products
Asia Pacific to Lead Market Growth
Growing Concerns Regarding Animal Welfare
Rising Prevalence of Dietary Restrictions
Increasing Vegan Population Driving the Market Demand for Dairy Alternatives
Dairy Alternatives Market: Key Players
Key players in the global dairy alternatives market are
Dairy Alternatives Market: Key Developments
Some of the key developments seen in the dairy alternatives market from the past few years are as follows:
Key Segments of the Dairy Alternatives Market
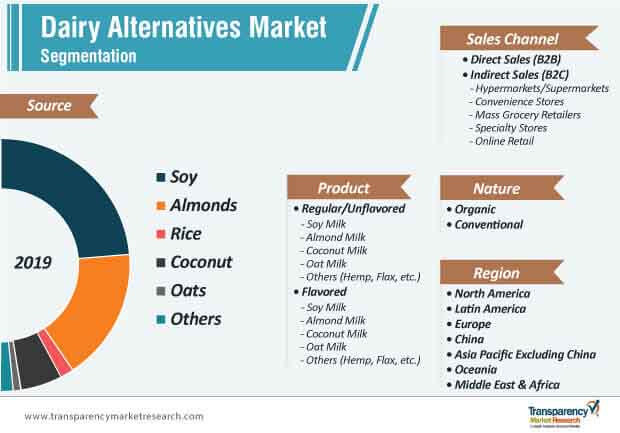
TMR’s study on the dairy alternatives market offers information divided into important segments—source, product, nature, sales channel, and region. This report offers comprehensive data and information about the important market dynamics and growth parameters associated with these categories.
|
Source |
|
|
Product |
|
|
Nature |
|
|
Sales Channel |
|
|
Region |
|
1. Executive Summary
1.1. Global Market Outlook
1.2. Demand-Side Trends
1.3. Supply-Side Trends
1.4. Technology Roadmap Analysis
1.5. Fmi Analysis And Recommendations
2. Market Overview
2.1. Market Coverage / Taxonomy
2.2. Market Definition / Scope / Limitations
3. Key Market Trends
3.1. Key Trends Impacting The Market
3.2. Technology Trends
3.3. Product Innovation / New Launches / Patents
4. Key Success Factors
4.1. Product Lifecycle Analysis
4.2. Quality Certifications And Claims Impact Analysis
4.3. Product Branding And Promotional Strategies
5. Global Dairy Alternatives Market Demand / Consumption (Metric Tons) Analysis
5.1. Historical Market Volume (Metric Tons) Analysis
5.2. Current And Future Market Volume Projections
5.3. Y-O-Y Growth Trend Analysis
6. Global Dairy Alternatives Market Pricing Analysis
6.1. Regional Average Pricing Analysis (Us$/Mt) By Source / Extraction Method
6.2. Pricing Break-Up
6.2.1. Manufacturer Level Pricing
6.2.2. Distributor Level Pricing
6.2.3. Pricing Mark-Ups
6.2.3.1. Transportation Costs
6.2.3.2. Miscellaneous Costs
6.3. Global Average Pricing Analysis Benchmark
7. Global Dairy Alternatives Market Demand / Consumption (Size In Us$ Mn) Analysis
7.1. Historical Market Value (Us$ Mn) Analysis
7.2. Current And Future Market Value (Us$ Mn) Projections
7.2.1. Y-O-Y Growth Trend Analysis
7.2.2. Absolute $ Opportunity Analysis
8. Dairy Alternatives Market Context
8.1. Global Dairy Market Overview
8.2. Nutritional Composition Of Dairy Alternatives
8.3. List Of Functional Ingredients Used In Dairy Alternatives
8.4. Policy Developments And Regulatory Scenario
8.5. Purchase Pattern Assessment
8.6. Macro-Economic Indicators
8.6.1. Global Gdp By Region And Country, 2006–2021
8.6.2. Global Industry Value Added
8.6.3. Global Food & Beverages Industry Outlook
8.7. Value Chain Analysis
8.8. Raw Material Suppliers
8.9. Dairy Alternatives Producers
8.10. Wholesalers / Distributors
8.11. Traders
8.12. Retailers
8.13. End Use Segments
8.14. Market Dynamics
8.14.1. Drivers
8.14.2. Restraints
8.14.3. Opportunities
8.14.4. Trends
8.15. Forecast Factors – Relevance And Impact
9. Global Dairy Alternatives Market Analysis 2014–2018 And Forecast 2019–2029, By Source
9.1. Introduction
9.1.1. Market Value Share Analysis By Source
9.1.2. Y-O-Y Growth Analysis By Source
9.2. Historical Market Value (Us$ Mn) And Volume (Metric Tons) By Source, 2014–2018
9.3. Market Value (Us$ Mn) And Volume (Metric Tons) Forecast By Source, 2019-2029
9.3.1. Soy
9.3.2. Almond
9.3.3. Rice
9.3.4. Coconut
9.3.5. Oats
9.3.6. Others
9.4. Market Attractiveness Analysis By Source
10. Global Dairy Alternatives Market Analysis 2014–2018 And Forecast 2019–2029, By Product
10.1. Introduction
10.1.1. Market Value Share Analysis By Product
10.1.2. Y-O-Y Growth Analysis By Product
10.2. Historical Market Value (Us$ Mn) And Volume (Metric Tons) By Product, 2014–2018
10.3. Market Value (Us$ Mn) And Volume (Metric Tons) Forecast By Product, 2019-2029
10.3.1. Regular/Unflavoured
10.3.1.1. Soy Milk
10.3.1.2. Almond Milk
10.3.1.3. Coconut Milk
10.3.1.4. Oat Milk
10.3.1.5. Others (Hemp, Flax, Etc.)
10.3.2. Flavoured
10.3.2.1. Soy Milk
10.3.2.2. Almond Milk
10.3.2.3. Coconut Milk
10.3.2.4. Oat Milk
10.3.2.5. Others (Hemp, Flax, Etc.)
10.4. Market Attractiveness Analysis By Product
11. Global Dairy Alternatives Market Analysis 2014–2018 And Forecast 2019–2029, By Nature
11.1. Introduction
11.1.1. Market Value Share Analysis By Nature
11.1.2. Y-O-Y Growth Analysis By Nature
11.2. Historical Market Value (Us$ Mn) And Volume (Metric Tons) By Nature, 2014–2018
11.3. Market Value (Us$ Mn) And Volume (Metric Tons) Forecast By Nature, 2019-2029
11.3.1. Organic
11.3.2. Conventional
11.4. Market Attractiveness Analysis By Nature
12. Global Dairy Alternatives Market Analysis 2014–2018 And Forecast 2019–2029, By Sales Channel
12.1. Introduction
12.1.1. Market Value Share Analysis By Sales Channel
12.1.2. Y-O-Y Growth Analysis By Sales Channel
12.2. Historical Market Value (Us$ Mn) And Volume (Metric Tons) By Sales Channel, 2014–2018
12.3. Market Value (Us$ Mn) And Volume (Metric Tons) Forecast By Sales Channel, 2019-2029
12.3.1. Direct Sales/B2b
12.3.2. Indirect Sales/B2c
12.3.2.1. Hypermarkets/ Supermarkets
12.3.2.2. Convenience Stores
12.3.2.3. Specialty Stores
12.3.2.4. Wholesale Store
12.3.2.5. Online Retailing
12.4. Market Attractiveness Analysis By Sales Channel
13. Global Dairy Alternatives Market Analysis And Forecast, By Region
13.1. Introduction
13.1.1. Market Value Share Analysis By Region
13.1.2. Y-O-Y Growth Analysis By Region
13.2. Historical Market Value (Us$ Mn) And Volume (Metric Tons) By Region, 2014–2018
13.3. Market Value (Us$ Mn) And Volume (Metric Tons) Forecast By Region, 2019-2029
13.3.1. North America
13.3.2. Latin America
13.3.3. Europe
13.3.4. China
13.3.5. Asia Pacific Excluding China
13.3.6. Oceania
13.3.7. Middle East And Africa
13.4. Market Attractiveness Analysis By Region
14. North America Dairy Alternatives Market Analysis 2014–2018 And Forecast 2019–2029
14.1. Introduction
14.2. Pricing Analysis
14.3. Historical Market Value (Us$ Mn) And Volume (Metric Tons) By Market Segments, 2014–2018
14.4. Market Value (Us$ Mn) And Volume (Metric Tons) Forecast By Market Segments, 2019-2029
14.4.1. By Country
14.4.1.1. United States
14.4.1.2. Canada
14.4.2. By Source
14.4.3. By Product
14.4.4. By Nature
14.4.5. By Sales Channel
14.5. Market Attractiveness Analysis
14.5.1. By Country
14.5.2. By Source
14.5.3. By Product
14.5.4. By Nature
14.5.5. By Sales Channel
14.6. Drivers And Restraints: Impact Analysis
14.7. Key Participants Market Presence Intensity Mapping
15. Latin America Dairy Alternatives Market Analysis 2014–2018 And Forecast 2019–2029
15.1. Introduction
15.2. Pricing Analysis
15.3. Historical Market Value (Us$ Mn) And Volume (Metric Tons) By Market Segments, 2014–2018
15.4. Market Value (Us$ Mn) And Volume (Metric Tons) Forecast By Market Segments, 2019-2029
15.4.1. By Country
15.4.1.1. Brazil
15.4.1.2. Mexico
15.4.1.3. Argentina
15.4.1.4. Rest Of Latin America
15.4.2. By Source
15.4.3. By Product
15.4.4. By Nature
15.4.5. By Sales Channel
15.5. Market Attractiveness Analysis
15.5.1. By Country
15.5.2. By Source
15.5.3. By Product
15.5.4. By Nature
15.5.5. By Sales Channel
15.6. Drivers And Restraints: Impact Analysis
15.7. Key Participants Market Presence Intensity Mapping
16. Europe Dairy Alternatives Market Analysis 2014–2018 And Forecast 2019–2029
16.1. Introduction
16.2. Pricing Analysis
16.3. Historical Market Value (Us$ Mn) And Volume (Metric Tons) By Market Segments, 2014–2018
16.4. Market Value (Us$ Mn) And Volume (Metric Tons) Forecast By Market Segments, 2019-2029
16.4.1. By Country
16.4.1.1. Germany
16.4.1.2. U.K.
16.4.1.3. France
16.4.1.4. Italy
16.4.1.5. Spain
16.4.1.6. Benelux
16.4.1.7. Nordic
16.4.1.8. Russia
16.4.1.9. Poland
16.4.1.10. Rest Of Western Europe
16.4.2. By Source
16.4.3. By Product
16.4.4. By Nature
16.4.5. By Packaging
16.4.6. By Sales Channel
16.5. Market Attractiveness Analysis
16.5.1. By Country
16.5.2. By Source
16.5.3. By Product
16.5.4. By Nature
16.5.5. By Sales Channel
16.6. Drivers And Restraints: Impact Analysis
16.7. Key Participants Market Presence Intensity Mapping
17. China Dairy Alternatives Market Analysis 2014–2018 And Forecast 2019–2029
17.1. Introduction
17.2. Pricing Analysis
17.3. Historical Market Value (Us$ Mn) And Volume (Metric Tons) By Market Segments, 2014–2018
17.4. Market Value (Us$ Mn) And Volume (Metric Tons) Forecast By Market Segments, 2019-2029
17.4.1. By Source
17.4.2. By Product
17.4.3. By Nature
17.4.4. By Sales Channel
17.5. Market Attractiveness Analysis
17.5.1. By Source
17.5.2. By Product
17.5.3. By Nature
17.5.4. By Sales Channel
17.6. Drivers And Restraints: Impact Analysis
17.7. Key Participants Market Presence Intensity Mapping
18. Asia Pacific Excluding China Dairy Alternatives Market Analysis 2014–2018 And Forecast 2019–2029
18.1. Introduction
18.2. Pricing Analysis
18.3. Historical Market Value (Us$ Mn) And Volume (Metric Tons) By Market Segments, 2014–2018
18.4. Market Value (Us$ Mn) And Volume (Metric Tons) Forecast By Market Segments, 2019-2029
18.4.1. By Country
18.4.1.1. India
18.4.1.2. Japan
18.4.1.3. Asean
18.4.1.4. Rest Of Asia Pacific Excluding China
18.4.2. By Source
18.4.3. By Product
18.4.4. By Nature
18.4.5. By Sales Channel
18.5. Market Attractiveness Analysis
18.5.1. By Country
18.5.2. By Source
18.5.3. By Product
18.5.4. By Nature
18.5.5. By Sales Channel
18.6. Drivers And Restraints: Impact Analysis
18.7. Key Participants Market Presence Intensity Mapping
19. Oceania Dairy Alternatives Market Analysis 2014–2018 And Forecast 2019–2029
19.1. Introduction
19.2. Pricing Analysis
19.3. Historical Market Value (Us$ Mn) And Volume (Metric Tons) By Market Segments, 2014–2018
19.4. Market Value (Us$ Mn) And Volume (Metric Tons) Forecast By Market Segments, 2019-2029
19.4.1. By Country
19.4.1.1. Australia
19.4.1.2. New Zealand
19.4.2. By Source
19.4.3. By Product
19.4.4. By Nature
19.4.5. By Sales Channel
19.5. Market Attractiveness Analysis
19.5.1. By Country
19.5.2. By Source
19.5.3. By Product
19.5.4. By Nature
19.5.5. By Sales Channel
19.6. Drivers And Restraints: Impact Analysis
19.7. Key Participants Market Presence Intensity Mapping
20. Middle East & Africa Dairy Alternatives Market Analysis 2014–2018 And Forecast 2019–2029
20.1. Introduction
20.2. Pricing Analysis
20.3. Historical Market Value (Us$ Mn) And Volume (Metric Tons) By Market Segments, 2014–2018
20.4. Market Value (Us$ Mn) And Volume (Metric Tons) Forecast By Market Segments, 2019-2029
20.4.1. By Country
20.4.1.1. Gcc Countries
20.4.1.2. Turkey
20.4.1.3. South Africa
20.4.1.4. Rest Of Mea
20.4.2. By Source
20.4.3. By Product
20.4.4. By Nature
20.4.5. By Sales Channel
20.5. Market Attractiveness Analysis
20.5.1. By Country
20.5.2. By Source
20.5.3. By Product
20.5.4. By Nature
20.5.5. By Sales Channel
20.6. Drivers And Restraints: Impact Analysis
20.7. Key Participants Market Presence Intensity Mapping
21. Dairy Alternatives Market Structure Analysis
21.1. Market Analysis By Tier Of Companies
21.2. Market Concentration
21.3. Market Share (Top 3 Or Top 5 Players) Analysis, By Region
21.3.1. Asia Pacific
21.3.2. Europe
21.3.3. North America
21.4. Brand Share (Top 3 Or Top 5 Brands) Analysis, By Region
21.4.1. North America
21.4.2. Asia Pacific
21.4.3. Europe
21.5. Market Presence Analysis
21.5.1. By Regional Footprint
21.5.2. By Product Footprint
21.5.3. By Channel Footprint
22. Competition Analysis
22.1. Competition Dashboard
22.2. Pricing Analysis, By Competition
22.3. Competition Benchmarking
22.4. Profitability And Gross Margin Analysis By Competition
22.5. Competition Developments (Mergers, Acquisitions And Expansions)
22.6. Competition Deepdive (Tentative List)
22.6.1. The Hain Celestial Group
22.6.1.1. Overview
22.6.1.2. Product Portfolio
22.6.1.3. Production Footprint
22.6.1.4. Sales Footprint
22.6.1.5. Strategy Overview
22.6.1.5.1. Marketing Strategy
22.6.1.5.2. Product Strategy
22.6.2. Sunopta, Inc.
22.6.2.1. Overview
22.6.2.2. Product Portfolio
22.6.2.3. Production Footprint
22.6.2.4. Sales Footprint
22.6.2.5. Strategy Overview
22.6.2.5.1. Marketing Strategy
22.6.2.5.2. Product Strategy
22.6.3. Earths Own Food Company
22.6.3.1. Overview
22.6.3.2. Product Portfolio
22.6.3.3. Production Footprint
22.6.3.4. Sales Footprint
22.6.3.5. Strategy Overview
22.6.3.5.1. Marketing Strategy
22.6.3.5.2. Product Strategy
22.6.4. Freedom Foods Group
22.6.4.1. Overview
22.6.4.2. Product Portfolio
22.6.4.3. Production Footprint
22.6.4.4. Sales Footprint
22.6.4.5. Strategy Overview
22.6.4.5.1. Marketing Strategy
22.6.4.5.2. Product Strategy
22.6.5. Dohler Gmbh
22.6.5.1. Overview
22.6.5.2. Product Portfolio
22.6.5.3. Production Footprint
22.6.5.4. Sales Footprint
22.6.5.5. Strategy Overview
22.6.5.5.1. Marketing Strategy
22.6.5.5.2. Product Strategy
22.6.6. Organic Valley
22.6.6.1. Overview
22.6.6.2. Product Portfolio
22.6.6.3. Production Footprint
22.6.6.4. Sales Footprint
22.6.6.5. Strategy Overview
22.6.6.5.1. Marketing Strategy
22.6.6.5.2. Product Strategy
22.6.7. Triballat Noyal
22.6.7.1. Overview
22.6.7.2. Product Portfolio
22.6.7.3. Production Footprint
22.6.7.4. Sales Footprint
22.6.7.5. Strategy Overview
22.6.7.5.1. Marketing Strategy
22.6.7.5.2. Product Strategy
22.6.8. Blue Diamond Growers
22.6.8.1. Overview
22.6.8.2. Product Portfolio
22.6.8.3. Production Footprint
22.6.8.4. Sales Footprint
22.6.8.5. Strategy Overview
22.6.8.5.1. Marketing Strategy
22.6.8.5.2. Product Strategy
22.6.9. Daiya Foods Inc.
22.6.9.1. Overview
22.6.9.2. Product Portfolio
22.6.9.3. Production Footprint
22.6.9.4. Sales Footprint
22.6.9.5. Strategy Overview
22.6.9.5.1. Marketing Strategy
22.6.9.5.2. Product Strategy
22.6.10. Califia Farms
22.6.10.1. Overview
22.6.10.2. Product Portfolio
22.6.10.3. Production Footprint
22.6.10.4. Sales Footprint
22.6.10.5. Strategy Overview
22.6.10.5.1. Marketing Strategy
22.6.10.5.2. Product Strategy
22.6.11. Sanitarium Health And Wellbeing Company
22.6.11.1. Overview
22.6.11.2. Product Portfolio
22.6.11.3. Production Footprint
22.6.11.4. Sales Footprint
22.6.11.5. Strategy Overview
22.6.11.5.1. Marketing Strategy
22.6.11.5.2. Product Strategy
22.6.12. Nutriops S.L.
22.6.12.1. Overview
22.6.12.2. Product Portfolio
22.6.12.3. Production Footprint
22.6.12.4. Sales Footprint
22.6.12.5. Strategy Overview
22.6.12.5.1. Marketing Strategy
22.6.12.5.2. Product Strategy
23. Assumptions And Acronyms Used
List of Tables
Table 01: Global Dairy Alternatives Historical Market Size (US$ Mn) 2014-2018 and Forecast 2019-2029 by Source
Table 02: Global Dairy Alternatives Historical Market Size (MT) 2014-2018 and Forecast 2019-2029 by Source
Table 03: Global Dairy Alternatives Historical Market Size (US$ Mn) 2014-2018 and Forecast 2019-2029 by Product
Table 04: Global Dairy Alternatives Historical Market Volume (MT) 2014-2018 and Forecast 2019-2029 by Product
Table 05: Global Dairy Alternatives Historical Market Size (US$ Mn) 2014-2018 and Forecast 2019-2029 by Nature
Table 06: Global Dairy Alternatives Historical Market Size (MT) 2014-2018 and Forecast 2019-2029 by Nature
Table 07: Global Dairy Alternatives Historical Market Size (US$ Mn) 2014-2018 and Forecast 2019-2029 by Sales Channel
Table 08: Global Dairy Alternatives Historical Market Size (MT) 2014-2018 and Forecast 2019-2029 by Sales Channel
Table 09: Global Dairy Alternatives Historical Market Size (US$ Mn) 2014-2018 and Forecast 2019-2029 by Region
Table 10: Global Dairy Alternatives Historical Market Size (MT) 2014-2018 and Forecast 2019-2029 by Region
Table 11: North America Dairy Alternatives Historical Market Size (US$ Mn) 2014-2018 and Forecast 2019-2029 by Source
Table 12: North America Dairy Alternatives Historical Market Size (MT) 2014-2018 and Forecast 2019-2029 by Source
Table 13: North America Dairy Alternatives Historical Market Size (US$ Mn) 2014-2018 and Forecast 2019-2029 by Product
Table 14: North America Dairy Alternatives Historical Market Volume (MT) 2014-2018 and Forecast 2019-2029 by Product
Table 15: North America Dairy Alternatives Historical Market Size (US$ Mn) 2014-2018 and Forecast 2019-2029 by Nature
Table 16: North America Dairy Alternatives Historical Market Volume (MT) 2014-2018 and Forecast 2019-2029 by Nature
Table 17: North America Dairy Alternatives Historical Market Size (US$ Mn) 2014-2018 and Forecast 2019-2029 by Sales Channel
Table 18: North America Dairy Alternatives Historical Market Size (MT) 2014-2018 and Forecast 2019-2029 by Sales Channel
Table 19: North America Dairy Alternatives Historical Market Size (US$ Mn) 2014-2018 and Forecast 2019-2029 by Country
Table 20: North America Dairy Alternatives Historical Market Size (MT) 2014-2018 and Forecast 2019-2029 by Country
Table 21: Latin America Dairy Alternatives Historical Market Size (US$ Mn) 2014-2018 and Forecast 2019-2029 by Source
Table 22: Latin America Dairy Alternatives Historical Market Size (MT) 2014-2018 and Forecast 2019-2029 by Source
Table 23: Latin America Dairy Alternatives Historical Market Size (US$ Mn) 2014-2018 and Forecast 2019-2029 by Product
Table 24: Latin America Dairy Alternatives Historical Market Volume (MT) 2014-2018 and Forecast 2019-2029 by Product
Table 25: Latin America Dairy Alternatives Historical Market Size (US$ Mn) 2014-2018 and Forecast 2019-2029 by Nature
Table 26: Latin America Dairy Alternatives Historical Market Size (MT) 2014-2018 and Forecast 2019-2029 by Nature
Table 27: Latin America Dairy Alternatives Historical Market Size (US$ Mn) 2014-2018 and Forecast 2019-2029 by Sales Channel
Table 28: Latin America Dairy Alternatives Historical Market Size (MT) 2014-2018 and Forecast 2019-2029 by Sales Channel
Table 29: Latin America Dairy Alternatives Historical Market Size (US$ Mn) 2014-2018 and Forecast 2019-2029 by Country
Table 30: Latin America Dairy Alternatives Historical Market Size (MT) 2014-2018 and Forecast 2019-2029 by Country
Table 31: Europe Dairy Alternatives Historical Market Size (US$ Mn) 2014-2018 and Forecast 2019-2029 by Source
Table 32: Europe Dairy Alternatives Historical Market Size (MT) 2014-2018 and Forecast 2019-2029 by Source
Table 33: Europe Dairy Alternatives Historical Market Size (US$ Mn) 2014-2018 and Forecast 2019-2029 by Product
Table 34: Europe Dairy Alternatives Historical Market Volume (MT) 2014-2018 and Forecast 2019-2029 by Product
Table 35: Europe Dairy Alternatives Historical Market Size (US$ Mn) 2014-2018 and Forecast 2019-2029 by Nature
Table 36: Europe Dairy Alternatives Historical Market Size (MT) 2014-2018 and Forecast 2019-2029 by Nature
Table 37: Europe Dairy Alternatives Historical Market Size (US$ Mn) 2014-2018 and Forecast 2019-2029 by Sales Channel
Table 38: Europe Dairy Alternatives Historical Market Size (MT) 2014-2018 and Forecast 2019-2029 by Sales Channel
Table 39: Europe Dairy Alternatives Historical Market Size (US$ Mn) 2014-2018 and Forecast 2019-2029 by Country
Table 40: Europe Dairy Alternatives Historical Market Size (MT) 2014-2018 and Forecast 2019-2029 by Country
Table 41: China Dairy Alternatives Historical Market Size (US$ Mn) 2014-2018 and Forecast 2019-2029 by Source
Table 42: China Dairy Alternatives Historical Market Size (MT) 2014-2018 and Forecast 2019-2029 by Source
Table 43: China Dairy Alternatives Historical Market Size (US$ Mn) 2014-2018 and Forecast 2019-2029 by Product
Table 44: China Dairy Alternatives Historical Market Volume (MT) 2014-2018 and Forecast 2019-2029 by Product
Table 45: China Dairy Alternatives Historical Market Size (US$ Mn) 2014-2018 and Forecast 2019-2029 by Nature
Table 46: China Dairy Alternatives Historical Market Size (MT) 2014-2018 and Forecast 2019-2029 by Nature
Table 47: China Dairy Alternatives Historical Market Size (US$ Mn) 2014-2018 and Forecast 2019-2029 by Sales Channel
Table 48: China Dairy Alternatives Historical Market Size (MT) 2014-2018 and Forecast 2019-2029 by Sales Channel
Table 49: Asia Pacific Excluding China Dairy Alternatives Historical Market Size (US$ Mn) 2014-2018 and Forecast 2019-2029 by Source
Table 50: Asia Pacific Excluding China Dairy Alternatives Historical Market Size (MT) 2014-2018 and Forecast 2019-2029 by Source
Table 51: Asia Pacific Excluding China Dairy Alternatives Historical Market Size (US$ Mn) 2014-2018 and Forecast 2019-2029 by Product
Table 52: Asia Pacific Excluding China Dairy Alternatives Historical Market Volume (MT) 2014-2018 and Forecast 2019-2029 by Product
Table 53: Asia Pacific Excluding China Dairy Alternatives Historical Market Size (US$ Mn) 2014-2018 and Forecast 2019-2029 by Nature
Table 54: Asia Pacific Excluding China Dairy Alternatives Historical Market Size (MT) 2014-2018 and Forecast 2019-2029 by Nature
Table 55: Asia Pacific Excluding China Dairy Alternatives Historical Market Size (US$ Mn) 2014-2018 and Forecast 2019-2029 by Sales Channel
Table 56: Asia Pacific Excluding China Dairy Alternatives Historical Market Size (MT) 2014-2018 and Forecast 2019-2029 by Sales Channel
Table 57: Asia Pacific Excluding China Dairy Alternatives Historical Market Size (US$ Mn) 2014-2018 and Forecast 2019-2029 by Country
Table 58: Asia Pacific Excluding China Dairy Alternatives Historical Market Size (MT) 2014-2018 and Forecast 2019-2029 by Country
Table 59: Oceania Dairy Alternatives Historical Market Size (US$ Mn) 2014-2018 and Forecast 2019-2029 by Source
Table 60: Oceania Dairy Alternatives Historical Market Size (MT) 2014-2018 and Forecast 2019-2029 by Source
Table 61: Oceania Dairy Alternatives Historical Market Size (US$ Mn) 2014-2018 and Forecast 2019-2029 by Product
Table 62: Oceania Dairy Alternatives Historical Market Volume (MT) 2014-2018 and Forecast 2019-2029 by Product
Table 63: Oceania Dairy Alternatives Historical Market Size (US$ Mn) 2014-2018 and Forecast 2019-2029 by Nature
Table 64: Oceania Dairy Alternatives Historical Market Size (MT) 2014-2018 and Forecast 2019-2029 by Nature
Table 65: Oceania Dairy Alternatives Historical Market Size (US$ Mn) 2014-2018 and Forecast 2019-2029 by Sales Channel
Table 66: Oceania Dairy Alternatives Historical Market Size (MT) 2014-2018 and Forecast 2019-2029 by Sales Channel
Table 67: Oceania Dairy Alternatives Historical Market Size (US$ Mn) 2014-2018 and Forecast 2019-2029 by Country
Table 68: Oceania Dairy Alternatives Historical Market Size (US$ Mn) 2014-2018 and Forecast 2019-2029 by Country
Table 69: MEA Dairy Alternatives Historical Market Size (US$ Mn) 2014-2018 and Forecast 2019-2029 by Source
Table 70: MEA Dairy Alternatives Historical Market Size (MT) 2014-2018 and Forecast 2019-2029 by Source
Table 71: MEA Dairy Alternatives Historical Market Size (US$ Mn) 2014-2018 and Forecast 2019-2029 by Product
Table 72: MEA Dairy Alternatives Historical Market Volume (MT) 2014-2018 and Forecast 2019-2029 by Product
Table 73: MEA Dairy Alternatives Historical Market Size (US$ Mn) 2014-2018 and Forecast 2019-2029 by Nature
Table 74: MEA Dairy Alternatives Historical Market Size (MT) 2014-2018 and Forecast 2019-2029 by Nature
Table 75: MEA Dairy Alternatives Historical Market Size (US$ Mn) 2014-2018 and Forecast 2019-2029 by Sales Channel
Table 76: MEA Dairy Alternatives Historical Market Size (MT) 2014-2018 and Forecast 2019-2029 by Sales Channel
Table 77: MEA Dairy Alternatives Historical Market Size (US$ Mn) 2014-2018 and Forecast 2019-2029 by Country
Table 78: MEA Dairy Alternatives Historical Market Size (US$ Mn) 2014-2018 and Forecast 2019-2029 by Country
List of Figures
Figure 01: Global Dairy Alternatives Market Size (US$ Mn) and Volume (Metric Tons) Forecast, 2019–2029
Figure 02: Global Dairy Alternatives Market Absolute $ Opportunity, 2019–2029
Figure 03: Global Dairy Alternatives Market Share Analysis by Source, 2019 and 2029
Figure 04: Global Dairy Alternatives Market Y-o-Y Growth Analysis by Source, 2019–2029
Figure 05: Global Dairy Alternatives Market Attractiveness Analysis by Source, 2019–2029
Figure 06: Global Dairy Alternatives Market Share Analysis by Product, 2019 and 2029
Figure 07: Global Dairy Alternatives Market Y-o-Y Growth Analysis by Product, 2019–2029
Figure 08: Global Dairy Alternatives Market Attractiveness Analysis by Product, 2019–2029
Figure 09: Global Dairy Alternatives Market Share Analysis by Nature, 2019 and 2029
Figure 10: Global Dairy Alternatives Market Y-o-Y Growth Analysis by Nature, 2019–2029
Figure 11: Global Dairy Alternatives Market Attractiveness Analysis by Nature, 2019–2029
Figure 12: Global Dairy Alternatives Market Share Analysis by Sales Channel, 2019 and 2029
Figure 13: Global Dairy Alternatives Market Y-o-Y Growth Analysis by Sales Channel, 2019–2029
Figure 14: Global Dairy Alternatives Market Attractiveness Analysis by Sales Channel, 2019–2029
Figure 15: Global Dairy Alternatives Market Share Analysis by Region, 2019 and 2029
Figure 16: Global Dairy Alternatives Market Y-o-Y Growth Analysis by Region, 2019–2029
Figure 17: Global Dairy Alternatives Market Attractiveness Analysis by Region, 2019–2029
Figure 18: North America Dairy Alternatives Market Share Analysis by Source, 2019 and 2029
Figure 19: North America Dairy Alternatives Market Y-o-Y Growth Analysis by Source, 2019–2029
Figure 20: North America Dairy Alternatives Market Attractiveness Analysis by Source, 2019–2029
Figure 21: North America Dairy Alternatives Market Share Analysis by Product, 2019 and 2029
Figure 22: North America Dairy Alternatives Market Y-o-Y Growth Analysis by Product, 2019–2029
Figure 23: North America Dairy Alternatives Market Attractiveness Analysis by Product, 2019–2029
Figure 24: North America Dairy Alternatives Market Share Analysis by Nature, 2019 and 2029
Figure 25: North America Dairy Alternatives Market Y-o-Y Growth Analysis by Nature, 2019–2029
Figure 26: North America Dairy Alternatives Market Attractiveness Analysis by Nature, 2019–2029
Figure 27: North America Dairy Alternatives Market Share Analysis by Sales Channel, 2019 and 2029
Figure 28: North America Dairy Alternatives Market Y-o-Y Growth Analysis by Sales Channel, 2019–2029
Figure 29: North America Dairy Alternatives Market Attractiveness Analysis by Sales Channel, 2019–2029
Figure 30: North America Dairy Alternatives Market Share Analysis by Country, 2019 and 2029
Figure 31: North America Dairy Alternatives Market Y-o-Y Growth Analysis by Country, 2019–2029
Figure 32: North America Dairy Alternatives Market Attractiveness Analysis by Country, 2019–2029
Figure 33: Latin America Dairy Alternatives Market Share Analysis by Source, 2019 and 2029
Figure 34: Latin America Dairy Alternatives Market Y-o-Y Growth Analysis by Source, 2019–2029
Figure 35: Latin America Dairy Alternatives Market Attractiveness Analysis by Source, 2019–2029
Figure 36: Latin America Dairy Alternatives Market Share Analysis by Product, 2019 and 2029
Figure 37: Latin America Dairy Alternatives Market Y-o-Y Growth Analysis by Product, 2019–2029
Figure 38: Latin America Dairy Alternatives Market Attractiveness Analysis by Product, 2019–2029
Figure 39: Latin America Dairy Alternatives Market Share Analysis by Nature, 2019 and 2029
Figure 40: Latin America Dairy Alternatives Market Y-o-Y Growth Analysis by Nature, 2019–2029
Figure 41: Latin America Dairy Alternatives Market Attractiveness Analysis by Nature, 2019–2029
Figure 42: Latin America Dairy Alternatives Market Share Analysis by Sales Channel, 2019 and 2029
Figure 43: Latin America Dairy Alternatives Market Y-o-Y Growth Analysis by Sales Channel, 2019–2029
Figure 44: Latin America Dairy Alternatives Market Attractiveness Analysis by Sales Channel, 2019–2029
Figure 45: Latin America Dairy Alternatives Market Share Analysis by Country, 2019 and 2029
Figure 46: Latin America Dairy Alternatives Market Y-o-Y Growth Analysis by Country, 2019–2029
Figure 47: Latin America Dairy Alternatives Market Attractiveness Analysis by Country, 2019–2029
Figure 48: Europe Dairy Alternatives Market Share Analysis by Source, 2019 and 2029
Figure 49: Europe Dairy Alternatives Market Y-o-Y Growth Analysis by Source, 2019–2029
Figure 50: Europe Dairy Alternatives Market Attractiveness Analysis by Source, 2019–2029
Figure 51: Europe Dairy Alternatives Market Share Analysis by Product, 2019 and 2029
Figure 52: Europe Dairy Alternatives Market Y-o-Y Growth Analysis by Product, 2019–2029
Figure 53: Europe Dairy Alternatives Market Attractiveness Analysis by Product, 2019–2029
Figure 54: Europe Dairy Alternatives Market Share Analysis by Nature, 2019 and 2029
Figure 55: Europe Dairy Alternatives Market Y-o-Y Growth Analysis by Nature, 2019–2029
Figure 56: Europe Dairy Alternatives Market Attractiveness Analysis by Nature, 2019–2029
Figure 57: Europe Dairy Alternatives Market Share Analysis by Sales Channel, 2019 and 2029
Figure 58: Europe Dairy Alternatives Market Y-o-Y Growth Analysis by Sales Channel, 2019–2029
Figure 59: Europe Dairy Alternatives Market Attractiveness Analysis by Sales Channel, 2019–2029
Figure 60: Europe Dairy Alternatives Market Share Analysis by Country, 2019 and 2029
Figure 61: Europe Dairy Alternatives Market Y-o-Y Growth Analysis by Country, 2019–2029
Figure 62: Europe Dairy Alternatives Market Attractiveness Analysis by Country, 2019–2029
Figure 63: China Dairy Alternatives Market Share Analysis by Source, 2019 and 2029
Figure 64: China Dairy Alternatives Market Y-o-Y Growth Analysis by Source, 2019–2029
Figure 65: China Dairy Alternatives Market Attractiveness Analysis by Source, 2019–2029
Figure 66: China Dairy Alternatives Market Share Analysis by Product, 2019 and 2029
Figure 67: China Dairy Alternatives Market Y-o-Y Growth Analysis by Product, 2019–2029
Figure 68: China Dairy Alternatives Market Attractiveness Analysis by Product, 2019–2029
Figure 69: China Dairy Alternatives Market Share Analysis by Nature, 2019 and 2029
Figure 70: China Dairy Alternatives Market Y-o-Y Growth Analysis by Nature, 2019–2029
Figure 71: China Dairy Alternatives Market Attractiveness Analysis by Nature, 2019–2029
Figure 72: China Dairy Alternatives Market Share Analysis by Sales Channel, 2019 and 2029
Figure 73: China Dairy Alternatives Market Y-o-Y Growth Analysis by Sales Channel, 2019–2029
Figure 74: China Dairy Alternatives Market Attractiveness Analysis by Sales Channel, 2019–2029
Figure 75: China Dairy Alternatives Market Share Analysis by Country, 2019 and 2029
Figure 76: Asia Pacific Excluding China Dairy Alternatives Market Share Analysis by Source, 2019 and 2029
Figure 77: Asia Pacific Excluding China Dairy Alternatives Market Y-o-Y Growth Analysis by Source, 2019–2029
Figure 78: Asia Pacific Excluding China Dairy Alternatives Market Attractiveness Analysis by Source, 2019–2029
Figure 79: Asia Pacific Excluding China Dairy Alternatives Market Share Analysis by Product, 2019 and 2029
Figure 80: Asia Pacific Excluding China Dairy Alternatives Market Y-o-Y Growth Analysis by Product, 2019–2029
Figure 81: Asia Pacific Excluding China Dairy Alternatives Market Attractiveness Analysis by Product, 2019–2029
Figure 82: Asia Pacific Excluding China Dairy Alternatives Market Share Analysis by Nature, 2019 and 2029
Figure 83: Asia Pacific Excluding China Dairy Alternatives Market Y-o-Y Growth Analysis by Nature, 2019–2029
Figure 84: Asia Pacific Excluding China Dairy Alternatives Market Attractiveness Analysis by Nature, 2019–2029
Figure 85: Asia Pacific Excluding China Dairy Alternatives Market Share Analysis by Sales Channel, 2019 and 2029
Figure 86: Asia Pacific Excluding China Dairy Alternatives Market Y-o-Y Growth Analysis by Sales Channel, 2019–2029
Figure 87: Asia Pacific Excluding China Dairy Alternatives Market Attractiveness Analysis by Sales Channel, 2019–2029
Figure 88: Asia Pacific Excluding China Dairy Alternatives Market Share Analysis by Country, 2019 and 2029
Figure 89: Asia Pacific Excluding China Dairy Alternatives Market Y-o-Y Growth Analysis by Country, 2019–2029
Figure 90: Asia Pacific Excluding China Dairy Alternatives Market Attractiveness Analysis by Country, 2019–2029
Figure 91: Oceania Dairy Alternatives Market Share Analysis by Source, 2019 and 2029
Figure 92: Oceania Dairy Alternatives Market Y-o-Y Growth Analysis by Source, 2019–2029
Figure 93: Oceania Dairy Alternatives Market Attractiveness Analysis by Source, 2019–2029
Figure 94: Oceania Dairy Alternatives Market Share Analysis by Product, 2019 and 2029
Figure 95: Oceania Dairy Alternatives Market Y-o-Y Growth Analysis by Product, 2019–2029
Figure 96: Oceania Dairy Alternatives Market Attractiveness Analysis by Product, 2019–2029
Figure 97: Oceania Dairy Alternatives Market Share Analysis by Nature, 2019 and 2029
Figure 98: Oceania Dairy Alternatives Market Y-o-Y Growth Analysis by Nature, 2019–2029
Figure 99: Oceania Dairy Alternatives Market Attractiveness Analysis by Nature, 2019–2029
Figure 100: Oceania Dairy Alternatives Market Share Analysis by Sales Channel, 2019 and 2029
Figure 101: Oceania Dairy Alternatives Market Y-o-Y Growth Analysis by Sales Channel, 2019–2029
Figure 102: Oceania Dairy Alternatives Market Attractiveness Analysis by Sales Channel, 2019–2029
Figure 103: Oceania Dairy Alternatives Market Share Analysis by Country, 2019 and 2029
Figure 104: Oceania Dairy Alternatives Market Y-o-Y Growth Analysis by Country, 2019–2029
Figure 105: Oceania Dairy Alternatives Market Attractiveness Analysis by Country, 2019–2029
Figure 106: MEA Dairy Alternatives Market Share Analysis by Source, 2019 and 2029
Figure 107: MEA Dairy Alternatives Market Y-o-Y Growth Analysis by Source, 2019–2029
Figure 108: MEA Dairy Alternatives Market Attractiveness Analysis by Source, 2019–2029
Figure 109: MEA Dairy Alternatives Market Share Analysis by Product, 2019 and 2029
Figure 110: MEA Dairy Alternatives Market Y-o-Y Growth Analysis by Product, 2019–2029
Figure 111: MEA Dairy Alternatives Market Attractiveness Analysis by Product, 2019–2029
Figure 112: MEA Dairy Alternatives Market Share Analysis by Nature, 2019 and 2029
Figure 113: MEA Dairy Alternatives Market Y-o-Y Growth Analysis by Nature, 2019–2029
Figure 114: MEA Dairy Alternatives Market Attractiveness Analysis by Nature, 2019–2029
Figure 115: MEA Dairy Alternatives Market Share Analysis by Sales Channel, 2019 and 2029
Figure 116: MEA Dairy Alternatives Market Y-o-Y Growth Analysis by Sales Channel, 2019–2029
Figure 117: MEA Dairy Alternatives Market Attractiveness Analysis by Sales Channel, 2019–2029
Figure 118: MEA Dairy Alternatives Market Share Analysis by Country, 2019 and 2029
Figure 119: MEA Dairy Alternatives Market Y-o-Y Growth Analysis by Country, 2019–2029
Figure 120: MEA Dairy Alternatives Market Attractiveness Analysis by Country, 2019–2029
Copyright © Transparency Market Research, Inc. All Rights reserved
Trust Online


Dairy Alternatives Market Insights, 2029