
Surge in the need for fulfilling IoT-associated rules and regulations globally and rising adoption of IoT technologies are creating profitable avenues in the global connected retail market. The market is estimated to expand at a CAGR of 19.8% during the forecast period 2017 to 2025 and gain a valuation of US$82.31 Bn by 2025.
Growth drivers, restraints, challenges, R&D projects, and competition analysis of the connected retail market is provided in detailed manner in an assessment by Transparency Market Research (TMR). Hence, this study becomes a rich source of reliable data and analysis on the global market for connected retail.
Analysts of the report by TMR have segmented all data from the global connected retail market into many sections, which are based on several crucial parameters such as connectivity, component, end use, and region. Based on connectivity, the market is classified into Wi-Fi, Zigbee, NFC, Bluetooth, and others. In terms of component, the connected retail market is segmented into software and hardware.
Internet of Things (IoT) is one of the advanced technologies gaining notable traction across a broad range of industries globally owing to numerous advantages including inventory management and theft & fraud prevention solutions.
IoT is being linked to all items that can be connected to the Internet. Wearable gadgets, coffee makers, headphones, mobile phones, washing machines, and lights are some of instances of such devices. Hence, rise in the use of IoT is resulting into revenue-generation opportunities in the connected retail market. Furthermore, the market is anticipated to gain the advantage of expanding ecommerce industry across the globe.
Connected retail is being used in different end uses such as beauty, electronics and appliance, food and beverage, home and personal care, footwear and accessories, apparel, sporting goods and toys, and home goods. This wide application of product is bolstering the connected retail market.
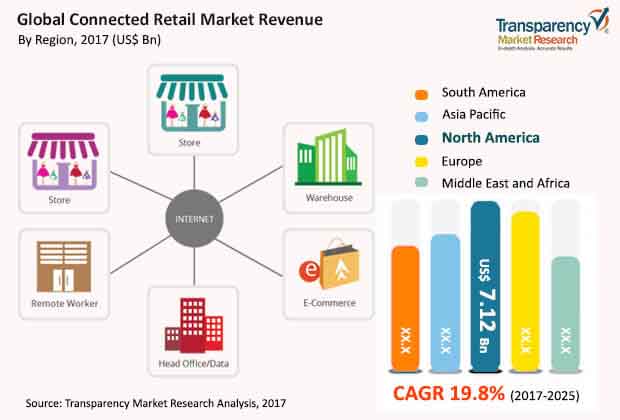
Asia Pacific, Latin America, Middle East and Africa, North America, and Europe are several prime regions of the global connected retail market. Among all, North America is considered as a hotbed of opportunities for companies in the connected retail market owing to presence of sturdy IoT market in the region. Moreover, increase in awareness about several advantages of connected solutions among retailers including cost savings, optimization of employee efficiency, and linked consumers is creating massive business prospects for market enterprises in the region.
The global connected retail market is fragmented in nature. Presence of many players represents a high level of competition in the market. Hence, enterprises are utilizing different strategic moves to sustain in this competition.
Many players in the global connected retail market are increasing cash in-flow toward R&D projects, which are helping enterprises to develop and launch innovative products, thereby attract new consumers. In addition, several organizers are using the strategy of acquiring their smaller competitors in order to maintain their leading position and expand their production capabilities. These efforts are prognosticated to help in the growth of the global connected retail market in the forecast period.
Some of the key players operating in the connected retail market include Verizon, Cisco Systems, Amazon Web Services Inc., International Business Machines Corporation, Belatrix Software, Microsoft Corporation, Softweb Solutions Inc., ARM Holdings PLC, Google Inc., Atmel Corporation (Microchip Technology Inc.), Intel Corporation, Microsoft Corporation, NXP Semiconductors NV, SAP SE, Fujitsu Limited, PTC Inc, and Zebra Technologies Corp.
Companies in the connected retail market are changing policies and guidelines in order to sustain in critical situations of the COVID-19 outbreak. They are focused on minimizing losses and boosting their revenue streams during the pandemic situations by continuing regular activities by adhering to all safety standards by regional government authorities.
Global Connected Retail market is segmented as follows:-
|
Connectivity |
|
|
Component |
|
|
End Use |
|
|
Geography |
|
1. Preface
1.1. Market Definition and Scope
1.2. Market Segmentation
1.3. Key Research Objectives
1.4. Research Highlights
2. Assumptions and Research Methodology
3. Executive Summary: Global Connected Retail Market
4. Market Overview
4.1. Introduction
4.2. Market Dynamics
4.2.1. Drivers
4.2.2. Restraints
4.2.3. Opportunities
4.3. Key Trends Analysis
4.4. Key Market Indicators
4.5. Africa Connected Retail Market Analysis and Forecast, 2015 - 2025
4.5.1. Market Revenue Projections (US$ Bn)
4.6. Porter’s Five Forces Analysis
4.7. Value Chain Analysis
4.8. Market Outlook
5. Global Connected Retail Market Analysis and Forecast, By Connectivity
5.1. Definitions
5.2. Key Trends
5.3. Global Connected Retail Market Size (US$ Bn) Forecast, By Connectivity, 2015 - 2025
5.3.1. Zigbee
5.3.2. Wi-Fi
5.3.3. Bluetooth
5.3.4. NFC
5.3.5. Others
5.4. Connectivity Comparison Matrix
5.5. Market Attractiveness By Connectivity
6. Global Connected Retail Market Analysis and Forecast, By Component
6.1. Definitions
6.2. Key Trends
6.3. Global Connected Retail Market Size (US$ Bn) Forecast, By Component, 2015 - 2025
6.3.1. Hardware
6.3.2. Software
6.4. Component Comparison Matrix
6.5. Market Attractiveness By Component
7. Global Connected Retail Market Analysis and Forecast, By End User
7.1. Definitions
7.2. Key Trends
7.3. Global Connected Retail Market Size (US$ Bn) Forecast, By End User, 2015 - 2025
7.3.1. Electronics and Appliances
7.3.2. Beauty
7.3.3. Home and Personal Care
7.3.4. Food and Beverage
7.3.5. Apparel, Footwear and Accessories
7.3.6. Home Goods
7.3.7. Sporting Goods and Toys
7.3.8. Others
7.4. End Use Comparison Matrix
7.5. Market Attractiveness By End Use
8. Global Connected Retail Market Analysis and Forecast, by Region
8.1. Key Findings
8.2. Global Connected Retail Market Size (US$ Bn) Forecast, by Region, 2015 - 2025
8.2.1. North America
8.2.2. Europe
8.2.3. Asia Pacific
8.2.4. Middle East and Africa
8.2.5. South America
8.3. Market Attractiveness by Region
9. North America Connected Retail Market Analysis and Forecast
9.1. Key Findings
9.2. Key Trends
9.3. Connected Retail Market Size (US$ Bn) Forecast, By Connectivity, 2015 - 2025
9.3.1. Zigbee
9.3.2. Wi-Fi
9.3.3. Bluetooth
9.3.4. NFC
9.3.5. Others
9.4. Connected Retail Market Size (US$ Bn) Forecast, By Component, 2015 - 2025
9.4.1. Hardware
9.4.2. Software
9.5. Connected Retail Market Size (US$ Bn) Forecast, By End User, 2015 - 2025
9.5.1. Electronics and Appliances
9.5.2. Beauty
9.5.3. Home and Personal Care
9.5.4. Food and Beverage
9.5.5. Apparel, Footwear and Accessories
9.5.6. Home Goods
9.5.7. Sporting Goods and Toys
9.5.8. Others
9.6. Connected Retail Market Size (US$ Bn) Forecast, By Country, 2015 - 2025
9.6.1. U.S
9.6.2. Canada
9.6.3. Rest of North America
9.7. Market Attractiveness Analysis
9.7.1. By Connectivity
9.7.2. By Component
9.7.3. By End User
9.7.4. By Country
10. Europe Connected Retail Market Analysis and Forecast
10.1. Key Findings
10.2. Key Trends
10.3. Connected Retail Market Size (US$ Bn) Forecast, By Connectivity, 2015 - 2025
10.3.1. Zigbee
10.3.2. Wi-Fi
10.3.3. Bluetooth
10.3.4. NFC
10.3.5. Others
10.4. Connected Retail Market Size (US$ Bn) Forecast, By Component, 2015 - 2025
10.4.1. Hardware
10.4.2. Software
10.5. Connected Retail Market Size (US$ Bn) Forecast, By End User, 2015 - 2025
10.5.1. Electronics and Appliances
10.5.2. Beauty
10.5.3. Home and Personal Care
10.5.4. Food and Beverage
10.5.5. Apparel, Footwear and Accessories
10.5.6. Home Goods
10.5.7. Sporting Goods and Toys
10.5.8. Others
10.6. Connected Retail Market Size (US$ Bn) Forecast, By Country, 2015 - 2025
10.6.1. United Kingdom
10.6.2. Germany
10.6.3. France
10.6.4. Italy
10.6.5. Rest of Europe
10.7. Market Attractiveness Analysis
10.7.1. By Connectivity
10.7.2. By Component
10.7.3. By End User
10.7.4. By Country
11. Asia Pacific Connected Retail Market Analysis and Forecast
11.1. Key Findings
11.2. Key Trends
11.3. Connected Retail Market Size (US$ Bn) Forecast, By Connectivity, 2015 - 2025
11.3.1. Zigbee
11.3.2. Wi-Fi
11.3.3. Bluetooth
11.3.4. NFC
11.3.5. Others
11.4. Connected Retail Market Size (US$ Bn) Forecast, By Component, 2015 - 2025
11.4.1. Hardware
11.4.2. Software
11.5. Connected Retail Market Size (US$ Bn) Forecast, By End User, 2015 - 2025
11.5.1. Electronics and Appliances
11.5.2. Beauty
11.5.3. Home and Personal Care
11.5.4. Food and Beverage
11.5.5. Apparel, Footwear and Accessories
11.5.6. Home Goods
11.5.7. Sporting Goods and Toys
11.5.8. Others
11.6. Connected Retail Market Size (US$ Bn) Forecast, By Country, 2015 - 2025
11.6.1. China
11.6.2. India
11.6.3. Japan
11.6.4. Rest of Asia Pacific
11.7. Market Attractiveness Analysis
11.7.1. By Connectivity
11.7.2. By Component
11.7.3. By End User
11.7.4. By Country
12. Middle East and Africa Connected Retail Market Analysis and Forecast
12.1. Key Findings
12.2. Key Trends
12.3. Connected Retail Market Size (US$ Bn) Forecast, By Connectivity, 2015 - 2025
12.3.1. Zigbee
12.3.2. Wi-Fi
12.3.3. Bluetooth
12.3.4. NFC
12.3.5. Others
12.4. Connected Retail Market Size (US$ Bn) Forecast, By Component, 2015 - 2025
12.4.1. Hardware
12.4.2. Software
12.5. Connected Retail Market Size (US$ Bn) Forecast, By End User, 2015 - 2025
12.5.1. Electronics and Appliances
12.5.2. Beauty
12.5.3. Home and Personal Care
12.5.4. Food and Beverage
12.5.5. Apparel, Footwear and Accessories
12.5.6. Home Goods
12.5.7. Sporting Goods and Toys
12.5.8. Others
12.6. Connected Retail Market Size (US$ Bn) Forecast, By Country, 2015 - 2025
12.6.1. GCC
12.6.2. South Africa
12.6.3. Rest of Middle East and Africa
12.7. Market Attractiveness Analysis
12.7.1. By Connectivity
12.7.2. By Component
12.7.3. By End User
12.7.4. By Country
13. South America Connected Retail Market Analysis and Forecast
13.1. Key Findings
13.2. Key Trends
13.3. Connected Retail Market Size (US$ Bn) Forecast, By Connectivity, 2015 - 2025
13.3.1. Zigbee
13.3.2. Wi-Fi
13.3.3. Bluetooth
13.3.4. NFC
13.3.5. Others
13.4. Connected Retail Market Size (US$ Bn) Forecast, By Component, 2015 - 2025
13.4.1. Hardware
13.4.2. Software
13.5. Connected Retail Market Size (US$ Bn) Forecast, By End User, 2015 - 2025
13.5.1. Electronics and Appliances
13.5.2. Beauty
13.5.3. Home and Personal Care
13.5.4. Food and Beverage
13.5.5. Apparel, Footwear and Accessories
13.5.6. Home Goods
13.5.7. Sporting Goods and Toys
13.5.8. Others
13.6. Connected Retail Market Size (US$ Bn) Forecast, By Country, 2015 - 2025
13.6.1. Brazil
13.6.2. Rest of South America
13.7. Market Attractiveness Analysis
13.7.1. By Connectivity
13.7.2. By Component
13.7.3. By End User
13.7.4. By Country
14. Competition Landscape
14.1. Market Player – Competition Matrix (By Tier and Size of companies)
14.2. Market Share Analysis By Company (2017)
14.3. Company Profiles (Details – Overview, Financials, SWOT Analysis, Strategy)
14.3.1. Cisco Systems
14.3.1.1. Company Details (HQ, Foundation Year, Revenue, Employee Strength)
14.3.1.2. Company Description
14.3.1.3. SWOT Analysis
14.3.1.4. Strategic Overview
14.3.2. Verizon
14.3.2.1. Company Details (HQ, Foundation Year, Revenue, Employee Strength)
14.3.2.2. Company Description
14.3.2.3. SWOT Analysis
14.3.2.4. Strategic Overview
14.3.3. IBM Corporation
14.3.3.1. Company Details (HQ, Foundation Year, Revenue, Employee Strength)
14.3.3.2. Company Description
14.3.3.3. SWOT Analysis
14.3.3.4. Strategic Overview
14.3.4. Belatrix Software
14.3.3.1. Company Details (HQ, Foundation Year, Revenue, Employee Strength)
14.3.3.2. Company Description
14.3.3.3. SWOT Analysis
14.3.3.4. Strategic Overview
14.3.5. ARM Holding PLC
14.3.5.1. Company Details (HQ, Foundation Year, Revenue, Employee Strength)
14.3.5.2. Company Description
14.3.5.3. SWOT Analysis
14.3.5.4. Strategic Overview
14.3.6 Softweb Solutions Inc.
14.3.6.1. Company Details (HQ, Foundation Year, Revenue, Employee Strength)
14.3.6.2. Company Description
14.3.6.3. SWOT Analysis
14.3.6.4. Strategic Overview
14.3.7. Atmel Corporation
14.3.7.1. Company Details (HQ, Foundation Year, Revenue, Employee Strength)
14.3.7.2. Company Description
14.3.7.3. SWOT Analysis
14.3.7.4. Strategic Overview
14.3.8. Google Inc.
14.3.8.1. Company Details (HQ, Foundation Year, Revenue, Employee Strength)
14.3.8.2. Company Description
14.3.8.3. SWOT Analysis
14.3.8.4. Strategic Overview
14.3.9. Microsoft Corporation
14.3.9.1. Company Details (HQ, Foundation Year, Revenue, Employee Strength)
14.3.9.2. Company Description
14.3.9.3. SWOT Analysis
14.3.9.4. Strategic Overview
14.3.10. Intel Corporation
14.3.10.1. Company Details (HQ, Foundation Year, Revenue, Employee Strength)
14.3.10.2. Company Description
14.3.10.3. SWOT Analysis
14.3.10.4. Strategic Overview
14.3.11. SAP SE
14.3.11.1. Company Details (HQ, Foundation Year, Revenue, Employee Strength)
14.3.11.2. Company Description
14.3.11.3. SWOT Analysis
14.3.11.4. Strategic Overview
14.3.12. NXP Semiconductors N.V.
14.3.12.1. Company Details (HQ, Foundation Year, Revenue, Employee Strength)
14.3.12.2. Company Description
14.3.12.3. SWOT Analysis
14.3.12.4. Strategic Overview
14.3.13. Zebra Technologies Corp.
14.3.13.1. Company Details (HQ, Foundation Year, Revenue, Employee Strength)
14.3.13.2. Company Description
14.3.13.3. SWOT Analysis
14.3.13.4. Strategic Overview
14.3.14. Fujitsu Limited
14.3.14.1. Company Details (HQ, Foundation Year, Revenue, Employee Strength)
14.3.14.2. Company Description
14.3.14.3. SWOT Analysis
14.3.14.4. Strategic Overview
14.3.15. PTC Inc.
14.3.15.1. Company Details (HQ, Foundation Year, Revenue, Employee Strength)
14.3.15.2. Company Description
14.3.15.3. SWOT Analysis
14.3.15.4. Strategic Overview
15. Key Takeaways
List of Tables
Table 1: Global Connected Retail Market, By Connectivity (US$ Bn)
Table 2: Global Connected Retail Market, By Component (US$ Bn)
Table 3: Global Connected Retail Market, By End Use (US$ Bn)
Table 4: Global Connected Retail Market, By Region (US$ Bn)
Table 5: North America Connected Retail Market, By Connectivity (US$ Bn)
Table 6: North America Connected Retail Market, By Component (US$ Bn)
Table 8: North America Connected Retail Market, By End Use (US$ Bn)
Table 9: North America Connected Retail Market, By Country (US$ Bn)
Table 10: Europe Connected Retail Market, By Connectivity (US$ Bn)
Table 11: Europe Connected Retail Market, By Component (US$ Bn)
Table 12: Europe Connected Retail Market, By End Use (US$ Bn)
Table 13: Europe Connected Retail Market, By Country (US$ Bn)
Table 14: Asia Pacific Connected Retail Market, By Connectivity (US$ Bn)
Table 15: Asia Pacific Connected Retail Market, By Component (US$ Bn)
Table 16: Asia Pacific Connected Retail Market, By End Use (US$ Bn)
Table 17: Asia Pacific Connected Retail Market, By Country (US$ Bn)
Table 18: Middle East and Africa Connected Retail Market, By Connectivity (US$ Bn)
Table 19: Middle East and Africa Connected Retail Market, By Component (US$ Bn)
Table 20: Middle East and Africa Connected Retail Market, By End Use (US$ Bn)
Table 21: Middle East and Africa Connected Retail Market, By Country (US$ Bn)
Table 22: South America Connected Retail Market, By Connectivity (US$ Bn)
Table 23: South America Connected Retail Market, By Component (US$ Bn)
Table 24: South America Connected Retail Market, By End Use (US$ Bn)
Table 25: South America Connected Retail Market, By Country (US$ Bn)
List of Figures
Fig 1: Global Connected Retail Market, Revenue (US$ Bn) Forecast, 2015 – 2025
Fig 2: Connected Retail Market Value Share Analysis, By Connectivity, 2017 and 2025 (US$ Bn)
Fig 3: Global Connected Retail Market Attractiveness Analysis, By Connectivity (2017)
Fig 4: Connected Retail Market Value Share Analysis, By Component, 2017 and 2025 (US$ Bn)
Fig 5: Global Connected Retail Market Attractiveness Analysis, By Component (2017)
Fig 6: Connected Retail Market Value Share Analysis, By End Use, 2017 and 2025 (US$ Bn)
Fig 7: Global Connected Retail Market Attractiveness Analysis, By End Use (2017)
Fig 8: Connected Retail Market Value Share Analysis, By Region, 2017 and 2025 (US$ Bn)
Fig 9: North America Connected Retail Market, Revenue (US$ Bn) Forecast, 2015 – 2025
Fig 10: North America Connected Retail Market Value Share Analysis, By Connectivity, 2017 and 2025 (US$ Bn)
Fig 11: North America Connected Retail Market Attractiveness Analysis, By Connectivity (2017)
Fig 12: North America Connected Retail Market Value Share Analysis, By Component, 2017 and 2025 (US$ Bn)
Fig 13: North America Connected Retail Market Attractiveness Analysis, By Component (2017)
Fig 14: North America Connected Retail Market Value Share Analysis, By End Use, 2017 and 2025 (US$ Bn)
Fig 15: North America Connected Retail Market Attractiveness Analysis, By End Use (2017)
Fig 16: North America Connected Retail Market Value Share Analysis, By Country, 2017 and 2025 (US$ Bn)
Fig 17: North America Connected Retail Market Attractiveness Analysis, By Country (2017)
Fig 18: Europe Connected Retail Market, Revenue (US$ Bn) Forecast, 2015 – 2025
Fig 19: Europe Connected Retail Market Value Share Analysis, By Connectivity, 2017 and 2025 (US$ Bn)
Fig 20: Europe Connected Retail Market Attractiveness Analysis, By Connectivity (2017)
Fig 21: Europe Connected Retail Market Value Share Analysis, By Component, 2017 and 2025 (US$ Bn)
Fig 22: Europe Connected Retail Market Attractiveness Analysis, By Component (2017)
Fig 23: Europe Connected Retail Market Value Share Analysis, By End Use, 2017 and 2025 (US$ Bn)
Fig 24: Europe Connected Retail Market Attractiveness Analysis, By End Use (2017)
Fig 25: Europe Connected Retail Market Value Share Analysis, By Country, 2017 and 2025 (US$ Bn)
Fig 26: Europe Connected Retail Market Attractiveness Analysis, By Country (2017)
Fig 27: Asia Pacific Connected Retail Market, Revenue (US$ Bn) Forecast, 2015 – 2025
Fig 28: Asia Pacific Connected Retail Market Value Share Analysis, By Connectivity, 2017 and 2025 (US$ Bn)
Fig 29: Asia Pacific Connected Retail Market Attractiveness Analysis, By Connectivity (2017)
Fig 30: Asia Pacific Connected Retail Market Value Share Analysis, By Component, 2017 and 2025 (US$ Bn)
Fig 31: Asia Pacific Connected Retail Market Attractiveness Analysis, By Component (2017)
Fig 32: Asia Pacific Connected Retail Market Value Share Analysis, By End Use, 2017 and 2025 (US$ Bn)
Fig 33: Asia Pacific Connected Retail Market Attractiveness Analysis, By End Use (2017)
Fig 34: Asia Pacific Connected Retail Market Value Share Analysis, By Country, 2017 and 2025 (US$ Bn)
Fig 35: Asia Pacific Connected Retail Market Attractiveness Analysis, By Country (2017)
Fig 36: Middle East and Africa Connected Retail Market Value Share Analysis, By Connectivity, 2017 and 2025 (US$ Bn)
Fig 37: Middle East and Africa Connected Retail Market Attractiveness Analysis, By Connectivity (2017)
Fig 38: Middle East and Africa Connected Retail Market Value Share Analysis, By Component, 2017 and 2025 (US$ Bn)
Fig 39: Middle East and Africa Connected Retail Market Attractiveness Analysis, By Component (2017)
Fig 40: Middle East and Africa Connected Retail Market Value Share Analysis, By End Use, 2017 and 2025 (US$ Bn)
Fig 41: Middle East and Africa Connected Retail Market Attractiveness Analysis, By End Use (2017)
Fig 42: Middle East and Africa Connected Retail Market Value Share Analysis, By Country, 2017 and 2025 (US$ Bn)
Fig 43: South America Connected Retail Market Value Share Analysis, By Connectivity, 2017 and 2025 (US$ Bn)
Fig 44: South America Connected Retail Market Attractiveness Analysis, By Connectivity (2017)
Fig 45: South America Connected Retail Market Value Share Analysis, By Component, 2017 and 2025 (US$ Bn)
Fig 46: South America Connected Retail Market Attractiveness Analysis, By Component (2017)
Fig 47: South America Connected Retail Market Value Share Analysis, By End Use, 2017 and 2025 (US$ Bn)
Fig 48: South America Connected Retail Market Attractiveness Analysis, By End Use (2017)
Fig 49: South America Connected Retail Market Value Share Analysis, By Country, 2017 and 2025 (US$ Bn)
Fig 50: South America Connected Retail Market Attractiveness Analysis, By Country (2017)
Fig 51: Breakdown of Revenue, by country (2016)
Fig 52: Revenue (US$ Mn) & Y-o-Y Growth (%), 2014-2016
Fig 53: Breakdown of Revenue, by country (2016)
Fig 54: Revenue (US$ Mn) & Y-o-Y Growth (%), 2014-2016
Fig 55: Breakdown of Revenue, by country (2016)
Fig 56: Revenue (US$ Mn) & Y-o-Y Growth (%), 2014-2016
Fig 57: Breakdown of Revenue, by country (2016)
Fig 59: Revenue (US$ Mn) & Y-o-Y Growth (%), 2014-2016
Fig 60: Breakdown of Revenue, by country (2016)
Fig 61: Revenue (US$ Mn) & Y-o-Y Growth (%), 2014-2016
Fig 62: Breakdown of Revenue, by country (2016)
Fig 63: Revenue (US$ Mn) & Y-o-Y Growth (%), 2014-2016
Fig 64: Breakdown of Revenue, by country (2016)
Fig 65: Revenue (US$ Mn) & Y-o-Y Growth (%), 2014-2016
Fig 66: Breakdown of Revenue, by country (2016)
Fig 67: Revenue (US$ Mn) & Y-o-Y Growth (%), 2014-2016
Fig 68: Breakdown of Revenue, by country (2016)
Fig 69: Revenue (US$ Mn) & Y-o-Y Growth (%), 2014-2016
Fig 70: Breakdown of Revenue, by country (2016)
Fig 71: Revenue (US$ Mn) & Y-o-Y Growth (%), 2014-2016
Fig 72: Breakdown of Revenue, by country (2016)
Fig 73: Revenue (US$ Mn) & Y-o-Y Growth (%), 2014-2016
Fig 74: Breakdown of Revenue, by country (2016)
Fig 75: Revenue (US$ Mn) & Y-o-Y Growth (%), 2014-2016
Fig 76: Breakdown of Revenue, by country (2016)
Fig 77: Revenue (US$ Mn) & Y-o-Y Growth (%), 2014-2016
Copyright © Transparency Market Research, Inc. All Rights reserved
Trust Online


Connected Retail Market