
Analysts’ Viewpoint on Composite Cans Market Scenario
Increase in demand for food and beverages; and rise in adoption of sustainable and cost-efficient packaging solutions are the key factors anticipated to drive the global composite cans market during the forecast period. Composite cans can be mass produced in almost any form or dimension, conforming to the exact requirements of customers. Composite cans are corrosion and moisture resistant. They are also chemical resistant and oxygen resistant. These properties are useful in preserving the aroma and taste of food items for a longer period. Composite cans help extend the shelf life of products compared to plastic cans, as composite cans keep food fresh. Manufacturers operating in the global composite cans market should tap into incremental opportunities by developing innovative products to broaden their revenue streams.
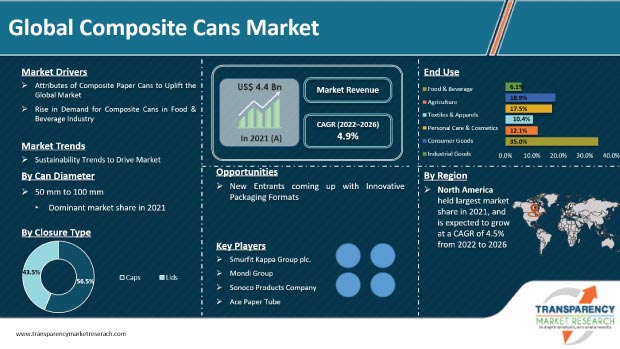
Growth in the food & beverage industry is one of the key factors expected to drive the global composite cans market during the forecast period. Increase in need for safe packaging products in the food & beverage industry is contributing to market growth. Composite cans are available in various shapes and sizes. Hence, their demand is increasing in industries such as food & beverage, agriculture, personal care & cosmetics, industrial goods, and consumer goods.
Outbreak of the Covid-19 pandemic adversely affected the overall packaging industry. Production and supply activities were halted due to disruptions in supply chains. However, demand for food packaging increased during the pandemic. key end-use industries such as food & beverage witnessed an impressive rise in demand for quality packaging solutions. This has created growth opportunities for players operating in the composite cans market.
Request a sample to get extensive insights into the Composite Cans Market
Demand for frozen food and online food deliveries has increased significantly from online grocery stores. Demand for safe and affordable packaging such as composite cans is rising in the food industry owing to the increase in demand for online orders. Composite cans be a sustainable form of packaging for manufacturers, retailers, and consumers. Rise in emphasis on nutritious and hygienic food due to COVID-19 has encouraged the packaging industry to adopt packaging solutions that are sustainable and cost-effective. Industrialization has increased the demand for fresh, nutritious, and safe food and beverages. This is leading to major innovations in the packaging industry. Safe packaging helps protect the food right from the manufacturing period to its usage by consumers.
Composite cans are being increasingly used as lightweight, eco-friendly, and cost-effective packaging solutions in the food & beverage industry. These cans have a high sealing property, which reduces the risk of spillage of dry grains. It also makes them easy to carry around. The requirement for a can opener decreases due to the rise in popularity of easy-to-open and resalable composite cans. Both hot and cold beverages can be stored in composite cans, as these cans are resistant to heat and moisture.
Request a custom report on Composite Cans Market
Plastic cans are used to store and carry food and beverages. However, consumer focus is shifting toward composite cans due to the rise in awareness about environmental concerns. These cans are 100% recyclable and have the same primary properties as plastic cans, such as protecting food products from any contamination, spillage, etc. Composite cans increase the shelf life of food products and are easy to carry. Therefore, manufacturers are focusing on developing composite cans instead of plastic cans. This offers lucrative opportunities to small players to enter the market. Governments of several countries have enacted stringent regulations related to environmental issues. The replacement of plastic cans with recyclable composite cans is expected to drive the market for composite cans in the near future.
Growth in environmental concerns has compelled consumers and marketers to turn toward green products and services; and also focus more on products that are reusable or recyclable or both. Over the last few decades, many companies have been using natural resources for manufacturing cans. Composite paper, which was earlier manufactured with the help of plastic, is now being made using paper that is easily recyclable. Usage of eco-friendly raw materials in the production of composite cans will not only help attain customer satisfaction toward the goal of being environmentally friendly. but also aim to preserve nature through green packaging of products. Government regulations and initiatives such as the Hazardous Waste Management Regulations in India and Strategic Sustainability Performance Plan in the U.S. are also anticipated to drive the composite cans market.
Composite cans are an amalgamation of different substrates engineered to a cylindrical shape. These cans can be manufactured using methods such as spiral winding, convolute winding, and linear draw. Composite cans are made of several layers including aluminum foil and plastic materials in various combinations. Barrier coatings are applied to the inner wall of composite cans depending upon the product filled inside. Aluminum foil liners are mostly used for food packaging. Composite cans are primarily used to pack dry food items such as chips, flakes, dry fruits, coffee/tea, spices, dry herbs, and other granular products. These cans prevent foodstuffs from getting crushed, while resealable lids keep products fresh for a longer period. Composite cans are vacuum-sealed against moisture and oxygen to preserve the freshness of the product. These cans can protect foodstuffs for up to 18 months or longer. Composite cans come with easy to seal membrane that helps maintain freshness without the hassle of having to use a separate closure such as a chip clip or rubber band.
The supply of composite cans for foodstuffs is highly seasonal. High-volume products packaged in composite cans such as gravy granules and beverages such as tea and coffee tend to be consumed outside the summer months. Alcohol and premium spirit bottle packaging experiences peak growth during Christmas and Easter holidays. The wine and spirits industry is going through a revolution that is changing and challenging the packaging of premium liquors. Spirits are now being packaged in composite cans or tubes for better appearance. Spirit bottles packaged in composite cans are visually appealing. Not only liquor but cookies and chocolates are also in high demand during the Christmas season. Manufacturers work close to full capacity to meet the increase in seasonal demand and operate with excess capacity rather than maintaining a steady production process over the whole year. This is expected to fuel the global composite cans market during the forecast period.
North America is expected to emerge as the dominant region of the global market during the forecast period. The market in the region is projected to expand 1.2X its present market value by the end of the forecast period. It is anticipated to grow at a healthy CAGR of 4.5% by 2026. Asia Pacific is projected to emerge as the fastest-growing market for composite cans during the forecast period. Major factors boosting the production across the region are easy availability of raw materials, cost-effective labor, and availability of the latest production technologies to top players in the region.
Developing countries such as China and India constitute around 50% share of the Asia Pacific composite cans market. Rise in demand for food and beverages and emergence of various local & global packaging manufacturers are driving the market in Asia Pacific. Rise in awareness about hygienic packaging for food is also driving the demand for composite cans in the region.
The global composite cans market is fragmented, with the presence of large numbers of manufacturers that control majority of the share. Mergers and acquisitions and development of product portfolios are major strategies adopted by key players. The global composite cans market assessment report includes various sections such as composite cans market drivers, composite cans market restraints, composite cans market challenges, composite cans market pricing analysis, composite cans market sales analysis, and composite cans market opportunities analysis. It also focuses on composite cans market competition analysis, composite cans market recent developments, and composite cans market demand analysis. Leading players operating in the market are Smurfit Kappa Group plc, Mondi Group, Sonoco Products Company, Ace Paper Tube, Irwin Packaging Pty Limited, Halaspack Packaging Bt., and Nagel Paper.
Each of these players has been profiled in global composite cans market report based on parameters such as company overview, financial overview, business strategies, product portfolio, business segments, and recent developments.
|
Attribute |
Detail |
|
Market Size Value in 2021 |
US$ 4.4 Bn |
|
Market Forecast Value in 2026 |
US$ 5.6 Bn |
|
Growth Rate (CAGR) |
4.9% |
|
Forecast Period |
2022–2026 |
|
Quantitative Units |
US$ Bn for Value, Units for Volume |
|
Market Analysis |
It includes cross-segment analysis at the global as well as regional levels. Moreover, the qualitative analysis includes drivers, restraints, opportunities, key trends, and a parent industry overview. |
|
Competition Landscape |
|
|
Format |
Electronic (PDF) + Excel |
|
Market Segmentation |
|
|
Regions Covered |
|
|
Countries Covered |
|
|
Companies Profiled |
|
|
Customization Scope |
Available upon request |
|
Pricing |
Available upon request |
The global composite cans market was valued at US$ 4.4 Bn in 2021
The global composite cans market is projected to grow at a CAGR of 4.9% during 2022-2026
The global composite cans market is projected to reach US$ 5.6 Bn by the end of 2026
Rise in sale of composite paper cans in the food & beverage industry
Caps as a closure type is majorly preferred by composite cans manufacturers due to its various benefits
North America is estimated to showcase the highest demand for composite cans during the forecast period
Smurfit Kappa Group plc, Mondi Group, Sonoco Products Company, Ace Paper Tube, Irwin Packaging Pty Limited, Halaspack Packaging Bt., and Nagel Paper
As per TMR analysis, the China composite cans market is anticipated to grow 1.3X times the current market value during the forecast period
1. Executive Summary
1.1. Market Overview
1.2. Market Analysis
1.3. TMR Analysis and Recommendations
2. Market Viewpoint
2.1. Market Definition
2.2. Market Taxonomy
3. Composite Cans Market Overview
3.1. Introduction
3.2. Global Composite Cans Market Overview
3.3. Composite Cans Market (US$ Mn) and Forecast
3.4. Value Chain Analysis
3.4.1. Exhaustive List of Active Participants
3.4.1.1. Raw Material Suppliers
3.4.1.2. Composite Cans Manufacturers/Distributor
3.4.1.3. End Users/Customers
3.4.2. Profitability Margins
3.5. Macro-economic Factors – Correlation Analysis
3.6. Forecast Factors – Relevance & Impact
4. Impact of COVID-19
4.1. Current Statistics and Probable Future Impact
4.2. Impact of COVID-19 on Target Market
5. Composite Cans Market Analysis
5.1. Pricing Analysis
5.1.1. Pricing Assumption
5.1.2. Price Projections By Region
5.2. Market Size (US$ Mn) and Forecast
5.2.1. Market Size and Y-o-Y Growth
5.2.2. Absolute $ Opportunity
6. Composite Cans Market Dynamics
6.1. Drivers
6.2. Restraints
6.3. Opportunity Analysis
6.4. Trends
7. Global Composite Cans Market Analysis and Forecast, By Can Diameter
7.1. Introduction
7.1.1. Market share and Basis Points (BPS) Analysis, By Can Diameter
7.1.2. Y-o-Y Growth Projections, By Can Diameter
7.2. Historical Market Value (US$ Mn) and Volume (Units), 2017-2021, By Can Diameter
7.2.1. Less than 50 mm
7.2.2. 50 mm-100 mm
7.2.3. Above 100 mm
7.3. Market Size (US$ Mn) and Volume (Units) Forecast Analysis 2022-2026, By Can Diameter
7.3.1. Less than 50 mm
7.3.2. 50 mm-100 mm
7.3.3. Above 100 mm
7.4. Market Attractiveness Analysis, By Can Diameter
8. Global Composite Cans Market Analysis and Forecast, By Closure Type
8.1. Introduction
8.1.1. Market share and Basis Points (BPS) Analysis, By Closure Type
8.1.2. Y-o-Y Growth Projections, By Closure Type
8.2. Historical Market Value (US$ Mn) and Volume (Units), 2017-2021, By Closure Type
8.2.1. Caps
8.2.1.1. Snap on
8.2.1.2. Plug
8.2.2. Lids
8.2.2.1. Aluminum Membrane
8.2.2.2. Plastic Membrane
8.2.2.3. Paperboard Ends
8.3. Market Size (US$ Mn) and Volume (Units) Forecast Analysis 2022-2026, By Closure Type
8.3.1. Caps
8.3.1.1. Snap on
8.3.1.2. Plug
8.3.2. Lids
8.3.2.1. Aluminum Membrane
8.3.2.2. Plastic Membrane
8.3.2.3. Paperboard Ends
8.4. Market Attractiveness Analysis, By Closure Type
9. Global Composite Cans Market Analysis and Forecast, By Production Type
9.1. Introduction
9.1.1. Market share and Basis Points (BPS) Analysis, By Production Type
9.1.2. Y-o-Y Growth Projections, By Production Type
9.2. Historical Market Value (US$ Mn) and Volume (Units), 2017-2021, By Production Type
9.2.1. Spiral Winding
9.2.2. Convolute Winding
9.2.3. Linear Draw
9.3. Market Size (US$ Mn) and Volume (Units) Forecast Analysis 2022-2026, By Production Type
9.3.1. Spiral Winding
9.3.2. Convolute Winding
9.3.3. Linear Draw
9.4. Market Attractiveness Analysis, By Production Type
10. Global Composite Cans Market Analysis and Forecast, By End Use
10.1. Introduction
10.1.1. Market share and Basis Points (BPS) Analysis, By End Use
10.1.2. Y-o-Y Growth Projections, By End Use
10.2. Historical Market Value (US$ Mn) and Volume (Units), 2017-2021, By End Use
10.2.1. Food & Beverage
10.2.1.1. Tea/Coffee
10.2.1.2. Snacks
10.2.1.3. Liquor Bottle Packaging
10.2.1.4. Others
10.2.2. Agriculture
10.2.2.1. Flower Seeds
10.2.2.2. Grass Seeds
10.2.2.3. Insecticides
10.2.2.4. Others
10.2.3. Textiles & Apparels
10.2.3.1. T-Shirts
10.2.3.2. Caps
10.2.3.3. Socks
10.2.3.4. Others
10.2.4. Personal Care & Cosmetics
10.2.4.1. Perfume Bottles
10.2.4.2. Talcum Powders
10.2.4.3. Soaps
10.2.4.4. Others
10.2.5. Consumer Goods
10.2.6. Industrial Goods
10.3. Market Size (US$ Mn) and Volume (Units) Forecast Analysis 2022-2026, By End Use
10.3.1. Food & Beverage
10.3.1.1. Tea/Coffee
10.3.1.2. Snacks
10.3.1.3. Liquor Bottle Packaging
10.3.1.4. Others
10.3.2. Agriculture
10.3.2.1. Flower Seeds
10.3.2.2. Grass Seeds
10.3.2.3. Insecticides
10.3.2.4. Others
10.3.3. Textiles & Apparels
10.3.3.1. T-Shirts
10.3.3.2. Caps
10.3.3.3. Socks
10.3.3.4. Others
10.3.4. Personal Care & Cosmetics
10.3.4.1. Perfume Bottles
10.3.4.2. Talcum Powders
10.3.4.3. Soaps
10.3.4.4. Others
10.3.5. Consumer Goods
10.3.6. Industrial Goods
10.4. Market Attractiveness Analysis, By End Use
10.5. Prominent Trends
11. Global Composite Cans Market Analysis and Forecast, By Region
11.1. Introduction
11.1.1. Market share and Basis Points (BPS) Analysis By Region
11.1.2. Y-o-Y Growth Projections By Region
11.2. Historical Market Value (US$ Mn) and Volume (Units), 2017-2021, By Region
11.2.1. North America
11.2.2. Latin America
11.2.3. Europe
11.2.4. Asia Pacific
11.2.5. Middle East and Africa
11.3. Market Size (US$ Mn) and Volume (Units) Forecast Analysis 2022-2026 By Region
11.3.1. North America
11.3.2. Latin America
11.3.3. Europe
11.3.4. Asia Pacific
11.3.5. Middle East and Africa
11.4. Market Attractiveness Analysis By Region
12. North America Composite Cans Market Analysis and Forecast
12.1. Introduction
12.1.1. Market share and Basis Points (BPS) Analysis, By Country
12.1.2. Y-o-Y Growth Projections, By Country
12.2. Historical Market Value (US$ Mn) and Volume (Units), 2017-2021, By Country
12.3. Market Size (US$ Mn) and Volume (Units) Forecast Analysis 2022-2026, By Country
12.3.1. U.S.
12.3.2. Canada
12.4. Historical Market Value (US$ Mn) and Volume (Units), 2017-2021, By Can Diameter
12.5. Market Size (US$ Mn) and Volume (Units) Forecast Analysis 2022-2026, By Can Diameter
12.5.1. Less than 50 mm
12.5.2. 50 mm-100 mm
12.5.3. Above 100 mm
12.6. Historical Market Value (US$ Mn) and Volume (Units), 2017-2021, By Closure Type
12.7. Market Size (US$ Mn) and Volume (Units) Forecast Analysis 2022-2026, By Closure Type
12.7.1. Caps
12.7.1.1. Snap on
12.7.1.2. Plug
12.7.2. Lids
12.7.2.1. Aluminum Membrane
12.7.2.2. Plastic Membrane
12.7.2.3. Paperboard Ends
12.8. Historical Market Value (US$ Mn) and Volume (Units), 2017-2021, By Production Type
12.9. Market Size (US$ Mn) and Volume (Units) Forecast Analysis 2022-2026, By Production Type
12.9.1. Spiral Winding
12.9.2. Convolute Winding
12.9.3. Linear Draw
12.10. Historical Market Value (US$ Mn) and Volume (Units), 2017-2021, By End Use
12.11. Market Size (US$ Mn) and Volume (Units) Forecast Analysis 2022-2026, By End Use
12.11.1. Food & Beverage
12.11.1.1. Tea/Coffee
12.11.1.2. Snacks
12.11.1.3. Liquor Bottle Packaging
12.11.1.4. Others
12.11.2. Agriculture
12.11.2.1. Flower Seeds
12.11.2.2. Grass Seeds
12.11.2.3. Insecticides
12.11.2.4. Others
12.11.3. Textiles & Apparels
12.11.3.1. T-Shirts
12.11.3.2. Caps
12.11.3.3. Socks
12.11.3.4. Others
12.11.4. Personal Care & Cosmetics
12.11.4.1. Perfume Bottles
12.11.4.2. Talcum Powders
12.11.4.3. Soaps
12.11.4.4. Others
12.11.5. Consumer Goods
12.11.6. Industrial Goods
12.12. Market Attractiveness Analysis
12.12.1. By Country
12.12.2. By Can Diameter
12.12.3. By Closure Type
12.12.4. By Production Type
12.12.5. By End Use
13. Latin America Composite Cans Market Analysis and Forecast
13.1. Introduction
13.1.1. Market share and Basis Points (BPS) Analysis, By Country
13.1.2. Y-o-Y Growth Projections, By Country
13.2. Historical Market Value (US$ Mn) and Volume (Units), 2017-2021, By Country
13.3. Market Size (US$ Mn) and Volume (Units) Forecast Analysis 2022-2026, By Country
13.3.1. Brazil
13.3.2. Mexico
13.3.3. Argentina
13.3.4. Rest of Latin America
13.4. Historical Market Value (US$ Mn) and Volume (Units), 2017-2021, By Can Diameter
13.5. Market Size (US$ Mn) and Volume (Units) Forecast Analysis 2022-2026, By Can Diameter
13.5.1. Less than 50 mm
13.5.2. 50 mm-100 mm
13.5.3. Above 100 mm
13.6. Historical Market Value (US$ Mn) and Volume (Units), 2017-2021, By Closure Type
13.7. Market Size (US$ Mn) and Volume (Units) Forecast Analysis 2022-2026, By Closure Type
13.7.1. Caps
13.7.1.1. Snap on
13.7.1.2. Plug
13.7.2. Lids
13.7.2.1. Aluminum Membrane
13.7.2.2. Plastic Membrane
13.7.2.3. Paperboard Ends
13.8. Historical Market Value (US$ Mn) and Volume (Units), 2017-2021, By Production Type
13.9. Market Size (US$ Mn) and Volume (Units) Forecast Analysis 2022-2026, By Production Type
13.9.1. Spiral Winding
13.9.2. Convolute Winding
13.9.3. Linear Draw
13.10. Historical Market Value (US$ Mn) and Volume (Units), 2017-2021, By End Use
13.11. Market Size (US$ Mn) and Volume (Units) Forecast Analysis 2022-2026, By End Use
13.11.1. Food & Beverage
13.11.1.1. Tea/Coffee
13.11.1.2. Snacks
13.11.1.3. Liquor Bottle Packaging
13.11.1.4. Others
13.11.2. Agriculture
13.11.2.1. Flower Seeds
13.11.2.2. Grass Seeds
13.11.2.3. Insecticides
13.11.2.4. Others
13.11.3. Textiles & Apparels
13.11.3.1. T-Shirts
13.11.3.2. Caps
13.11.3.3. Socks
13.11.3.4. Others
13.11.4. Personal Care & Cosmetics
13.11.4.1. Perfume Bottles
13.11.4.2. Talcum Powders
13.11.4.3. Soaps
13.11.4.4. Others
13.11.5. Consumer Goods
13.11.6. Industrial Goods
13.12. Market Attractiveness Analysis
13.12.1. By Country
13.12.2. By Can Diameter
13.12.3. By Closure Type
13.12.4. By Production Type
13.12.5. By End Use
14. Europe Composite Cans Market Analysis and Forecast
14.1. Introduction
14.1.1. Market share and Basis Points (BPS) Analysis, By Country
14.1.2. Y-o-Y Growth Projections, By Country
14.2. Historical Market Value (US$ Mn) and Volume (Units), 2017-2021, By Country
14.3. Market Size (US$ Mn) and Volume (Units) Forecast Analysis 2022-2026, By Country
14.3.1. Germany
14.3.2. Italy
14.3.3. France
14.3.4. Spain
14.3.5. Nordics
14.3.6. U.K.
14.3.7. Benelux
14.3.8. Russia
14.3.9. Poland
14.3.10. Rest of Europe
14.4. Historical Market Value (US$ Mn) and Volume (Units), 2017-2021, By Can Diameter
14.5. Market Size (US$ Mn) and Volume (Units) Forecast Analysis 2022-2026, By Can Diameter
14.5.1. Less than 50 mm
14.5.2. 50 mm-100 mm
14.5.3. Above 100 mm
14.6. Historical Market Value (US$ Mn) and Volume (Units), 2017-2021, By Closure Type
14.7. Market Size (US$ Mn) and Volume (Units) Forecast Analysis 2022-2026, By Closure Type
14.7.1. Caps
14.7.1.1. Snap on
14.7.1.2. Plug
14.7.2. Lids
14.7.2.1. Aluminum Membrane
14.7.2.2. Plastic Membrane
14.7.2.3. Paperboard Ends
14.8. Historical Market Value (US$ Mn) and Volume (Units), 2017-2021, By Production Type
14.9. Market Size (US$ Mn) and Volume (Units) Forecast Analysis 2022-2026, By Production Type
14.9.1. Spiral Winding
14.9.2. Convolute Winding
14.9.3. Linear Draw
14.10. Historical Market Value (US$ Mn) and Volume (Units), 2017-2021, By End Use
14.11. Market Size (US$ Mn) and Volume (Units) Forecast Analysis 2022-2026, By End Use
14.11.1. Food & Beverage
14.11.1.1. Tea/Coffee
14.11.1.2. Snacks
14.11.1.3. Liquor Bottle Packaging
14.11.1.4. Others
14.11.2. Agriculture
14.11.2.1. Flower Seeds
14.11.2.2. Grass Seeds
14.11.2.3. Insecticides
14.11.2.4. Others
14.11.3. Textiles & Apparels
14.11.3.1. T-Shirts
14.11.3.2. Caps
14.11.3.3. Socks
14.11.3.4. Others
14.11.4. Personal Care & Cosmetics
14.11.4.1. Perfume Bottles
14.11.4.2. Talcum Powders
14.11.4.3. Soaps
14.11.4.4. Others
14.11.5. Consumer Goods
14.11.6. Industrial Goods
14.12. Market Attractiveness Analysis
14.12.1. By Country
14.12.2. By Can Diameter
14.12.3. By Closure Type
14.12.4. By Production Type
14.12.5. By End Use
15. Asia Pacific Composite Cans Market Analysis and Forecast
15.1. Introduction
15.1.1. Market share and Basis Points (BPS) Analysis, By Country
15.1.2. Y-o-Y Growth Projections, By Country
15.2. Historical Market Value (US$ Mn) and Volume (Units), 2017-2021, By Country
15.3. Market Size (US$ Mn) and Volume (Units) Forecast Analysis 2022-2026, By Country
15.3.1. China
15.3.2. India
15.3.3. ASEAN
15.3.4. Australia & New Zealand
15.3.5. Japan
15.3.6. Rest of APAC
15.4. Historical Market Value (US$ Mn) and Volume (Units), 2017-2021, By Can Diameter
15.5. Market Size (US$ Mn) and Volume (Units) Forecast Analysis 2022-2026, By Can Diameter
15.5.1. Less than 50 mm
15.5.2. 50 mm-100 mm
15.5.3. Above 100 mm
15.6. Historical Market Value (US$ Mn) and Volume (Units), 2017-2021, By Closure Type
15.7. Market Size (US$ Mn) and Volume (Units) Forecast Analysis 2022-2026, By Closure Type
15.7.1. Caps
15.7.1.1. Snap on
15.7.1.2. Plug
15.7.2. Lids
15.7.2.1. Aluminum Membrane
15.7.2.2. Plastic Membrane
15.7.2.3. Paperboard Ends
15.8. Historical Market Value (US$ Mn) and Volume (Units), 2017-2021, By Production Type
15.9. Market Size (US$ Mn) and Volume (Units) Forecast Analysis 2022-2026, By Production Type
15.9.1. Spiral Winding
15.9.2. Convolute Winding
15.9.3. Linear Draw
15.10. Historical Market Value (US$ Mn) and Volume (Units), 2017-2021, By End Use
15.11. Market Size (US$ Mn) and Volume (Units) Forecast Analysis 2022-2026, By End Use
15.11.1. Food & Beverage
15.11.1.1. Tea/Coffee
15.11.1.2. Snacks
15.11.1.3. Liquor Bottle Packaging
15.11.1.4. Others
15.11.2. Agriculture
15.11.2.1. Flower Seeds
15.11.2.2. Grass Seeds
15.11.2.3. Insecticides
15.11.2.4. Others
15.11.3. Textiles & Apparels
15.11.3.1. T-Shirts
15.11.3.2. Caps
15.11.3.3. Socks
15.11.3.4. Others
15.11.4. Personal Care & Cosmetics
15.11.4.1. Perfume Bottles
15.11.4.2. Talcum Powders
15.11.4.3. Soaps
15.11.4.4. Others
15.11.5. Consumer Goods
15.11.6. Industrial Goods
15.12. Market Attractiveness Analysis
15.12.1. By Country
15.12.2. By Can Diameter
15.12.3. By Closure Type
15.12.4. By Production Type
15.12.5. By End Use
16. Middle East and Africa Composite Cans Market Analysis and Forecast
16.1. Introduction
16.1.1. Market share and Basis Points (BPS) Analysis, By Country
16.1.2. Y-o-Y Growth Projections, By Country
16.2. Historical Market Value (US$ Mn) and Volume (Units), 2017-2021, By Country
16.3. Market Size (US$ Mn) and Volume (Units) Forecast Analysis 2022-2026, By Country
16.3.1. Northern Africa
16.3.2. GCC Countries
16.3.3. South Africa
16.3.4. Rest of MEA
16.4. Historical Market Value (US$ Mn) and Volume (Units), 2017-2021, By Can Diameter
16.5. Market Size (US$ Mn) and Volume (Units) Forecast Analysis 2022-2026, By Can Diameter
16.5.1. Less than 50 mm
16.5.2. 50 mm-100 mm
16.5.3. Above 100 mm
16.6. Historical Market Value (US$ Mn) and Volume (Units), 2017-2021, By Closure Type
16.7. Market Size (US$ Mn) and Volume (Units) Forecast Analysis 2022-2026, By Closure Type
16.7.1. Caps
16.7.1.1. Snap on
16.7.1.2. Plug
16.7.2. Lids
16.7.2.1. Aluminum Membrane
16.7.2.2. Plastic Membrane
16.7.2.3. Paperboard Ends
16.8. Historical Market Value (US$ Mn) and Volume (Units), 2017-2021, By Production Type
16.9. Market Size (US$ Mn) and Volume (Units) Forecast Analysis 2022-2026, By Production Type
16.9.1. Spiral Winding
16.9.2. Convolute Winding
16.9.3. Linear Draw
16.10. Historical Market Value (US$ Mn) and Volume (Units), 2017-2021, By End Use
16.11. Market Size (US$ Mn) and Volume (Units) Forecast Analysis 2022-2026, By End Use
16.11.1. Food & Beverage
16.11.1.1. Tea/Coffee
16.11.1.2. Snacks
16.11.1.3. Liquor Bottle Packaging
16.11.1.4. Others
16.11.2. Agriculture
16.11.2.1. Flower Seeds
16.11.2.2. Grass Seeds
16.11.2.3. Insecticides
16.11.2.4. Others
16.11.3. Textiles & Apparels
16.11.3.1. T-Shirts
16.11.3.2. Caps
16.11.3.3. Socks
16.11.3.4. Others
16.11.4. Personal Care & Cosmetics
16.11.4.1. Perfume Bottles
16.11.4.2. Talcum Powders
16.11.4.3. Soaps
16.11.4.4. Others
16.11.5. Consumer Goods
16.11.6. Industrial Goods
16.12. Market Attractiveness Analysis
16.12.1. By Country
16.12.2. By Can Diameter
16.12.3. By Closure Type
16.12.4. By Production Type
16.12.5. By End Use
17. Country wise Composite Cans Market Analysis, 2022-2026
17.1. U.S. Composite Cans Market Analysis
17.1.1. By Can Diameter
17.1.2. By Closure Type
17.1.3. By Production Type
17.1.4. By End Use
17.2. Canada Composite Cans Market Analysis
17.2.1. By Can Diameter
17.2.2. By Closure Type
17.2.3. By Production Type
17.2.4. By End Use
17.3. Brazil Composite Cans Market Analysis
17.3.1. By Can Diameter
17.3.2. By Closure Type
17.3.3. By Production Type
17.3.4. By End Use
17.4. Mexico Composite Cans Market Analysis
17.4.1. By Can Diameter
17.4.2. By Closure Type
17.4.3. By Production Type
17.4.4. By End Use
17.5. Germany Composite Cans Market Analysis
17.5.1. By Can Diameter
17.5.2. By Closure Type
17.5.3. By Production Type
17.5.4. By End Use
17.6. Spain Composite Cans Market Analysis
17.6.1. By Can Diameter
17.6.2. By Closure Type
17.6.3. By Production Type
17.6.4. By End Use
17.7. France Composite Cans Market Analysis
17.7.1. By Can Diameter
17.7.2. By Closure Type
17.7.3. By Production Type
17.7.4. By End Use
17.8. U K Composite Cans Market Analysis
17.8.1. By Can Diameter
17.8.2. By Closure Type
17.8.3. By Production Type
17.8.4. By End Use
17.9. Italy Composite Cans Market Analysis
17.9.1. By Can Diameter
17.9.2. By Closure Type
17.9.3. By Production Type
17.9.4. By End Use
17.10. Russia Composite Cans Market Analysis
17.10.1. By Can Diameter
17.10.2. By Closure Type
17.10.3. By Production Type
17.10.4. By End Use
17.11. China Composite Cans Market Analysis
17.11.1. By Can Diameter
17.11.2. By Closure Type
17.11.3. By Production Type
17.11.4. By End Use
17.12. India Composite Cans Market Analysis
17.12.1. By Can Diameter
17.12.2. By Closure Type
17.12.3. By Production Type
17.12.4. By End Use
17.13. Japan Composite Cans Market Analysis
17.13.1. By Can Diameter
17.13.2. By Closure Type
17.13.3. By Production Type
17.13.4. By End Use
17.14. GCC Countries Composite Cans Market Analysis
17.14.1. By Can Diameter
17.14.2. By Closure Type
17.14.3. By Production Type
17.14.4. By End Use
17.15. South Africa Composite Cans Market Analysis
17.15.1. By Can Diameter
17.15.2. By Closure Type
17.15.3. By Production Type
17.15.4. By End Use
18. Competitive Landscape
18.1. Market Structure
18.2. Competition Dashboard
18.3. Company Market Share Analysis
18.4. Company Profiles (Details – Overview, Financials, Strategy, Recent Developments, SWOT analysis)
18.5. Competition Deep Dive
(Key Global Market Players)
18.5.1. Smurfit Kappa Group
18.5.1.1. Overview
18.5.1.2. Financials
18.5.1.3. Strategy
18.5.1.4. Recent Developments
18.5.1.5. SWOT Analysis
18.5.2. Mondi Group
18.5.2.1. Overview
18.5.2.2. Financials
18.5.2.3. Strategy
18.5.2.4. Recent Developments
18.5.2.5. SWOT Analysis
18.5.3. Sonoco Products Company
18.5.3.1. Overview
18.5.3.2. Financials
18.5.3.3. Strategy
18.5.3.4. Recent Developments
18.5.3.5. SWOT Analysis
18.5.4. Ace Paper Tube
18.5.4.1. Overview
18.5.4.2. Financials
18.5.4.3. Strategy
18.5.4.4. Recent Developments
18.5.4.5. SWOT Analysis
18.5.5. Irwin Packaging Pty limited
18.5.5.1. Overview
18.5.5.2. Financials
18.5.5.3. Strategy
18.5.5.4. Recent Developments
18.5.5.5. SWOT Analysis
18.5.6. Halaspack bt Packaging
18.5.6.1. Overview
18.5.6.2. Financials
18.5.6.3. Strategy
18.5.6.4. Recent Developments
18.5.6.5. SWOT Analysis
18.5.7. Nagel Paper
18.5.7.1. Overview
18.5.7.2. Financials
18.5.7.3. Strategy
18.5.7.4. Recent Developments
18.5.7.5. SWOT Analysis
18.5.8. Corex Group
18.5.8.1. Overview
18.5.8.2. Financials
18.5.8.3. Strategy
18.5.8.4. Recent Developments
18.5.8.5. SWOT Analysis
18.5.9. Quality Container Company
18.5.9.1. Overview
18.5.9.2. Financials
18.5.9.3. Strategy
18.5.9.4. Recent Developments
18.5.9.5. SWOT Analysis
18.5.10. Hangzhou Qunle Packaging Co., Ltd.
18.5.10.1. Overview
18.5.10.2. Financials
18.5.10.3. Strategy
18.5.10.4. Recent Developments
18.5.10.5. SWOT Analysis
18.5.11. PTS Manufacturing Co. Ltd.
18.5.11.1. Overview
18.5.11.2. Financials
18.5.11.3. Strategy
18.5.11.4. Recent Developments
18.5.11.5. SWOT Analysis
18.5.12. Heartland Products Group, LLC
18.5.12.1. Overview
18.5.12.2. Financials
18.5.12.3. Strategy
18.5.12.4. Recent Developments
18.5.12.5. SWOT Analysis
18.5.13. Bharath Paper Conversions
18.5.13.1. Overview
18.5.13.2. Financials
18.5.13.3. Strategy
18.5.13.4. Recent Developments
18.5.13.5. SWOT Analysis
18.5.14. CANFAB PACKAGING INC.
18.5.14.1. Overview
18.5.14.2. Financials
18.5.14.3. Strategy
18.5.14.4. Recent Developments
18.5.14.5. SWOT Analysis
18.5.15. Shetron Group
18.5.15.1. Overview
18.5.15.2. Financials
18.5.15.3. Strategy
18.5.15.4. Recent Developments
18.5.15.5. SWOT Analysis
19. Assumptions and Acronyms Used
20. Research Methodology
List of Tables
Table 01: Global Composite Cans Market Historic Value (US$ Mn), By Can Diameter 2017(H)-2021(A)
Table 02: Global Composite Cans Market Forecast Value (US$ Mn), By Can Diameter 2022(E)-2026(F)
Table 03: Global Composite Cans Market Historic Volume (Units), By Can Diameter 2017(H)-2021(A)
Table 04: Global Composite Cans Market Forecast Volume (Units), By Can Diameter 2022(E)-2026(F)
Table 05: Global Composite Cans Market Historic Value (US$ Mn), By Closure Type 2017(H)-2021(A)
Table 06: Global Composite Cans Market Forecast Value (US$ Mn), By Closure Type 2022(E)-2026(F)
Table 07: Global Composite Cans Market Historic Volume (Units), By Closure Type 2017(H)-2021(A)
Table 08: Global Composite Cans Market Forecast Volume (Units), By Closure Type 2022(E)-2026(F)
Table 09: Global Composite Cans Market Historic Value (US$ Mn), By Production Type 2017(H)-2021(A)
Table 10: Global Composite Cans Market Forecast Value (US$ Mn), By Production Type 2022(E)-2026(F)
Table 11: Global Composite Cans Market Historic Volume (Units), By Production Type 2017(H)-2021(A)
Table 12: Global Composite Cans Market Forecast Volume (Units), By Production Type 2022(E)-2026(F)
Table 13: Global Composite Cans Market Historic Value (US$ Mn), By End Use 2017(H)-2021(A)
Table 14: Global Composite Cans Market Forecast Value (US$ Mn), By End Use 2022(E)-2026(F)
Table 15: Global Composite Cans Market Historic Volume (Units), By End Use 2017(H)-2021(A)
Table 16: Global Composite Cans Market Forecast Volume (Units), By End Use 2022(E)-2026(F)
Table 17: Global Composite Cans Market Historic Value (US$ Mn), By Region 2017(H)-2021(A)
Table 18: Global Composite Cans Market Forecast Value (US$ Mn), By Region 2022(E)-2026(F)
Table 19: Global Composite Cans Market Historic Volume (Units), By Region 2017(H)-2021(A)
Table 20: Global Composite Cans Market Forecast Volume (Units), By Region 2022(E)-2026(F)
Table 21: North America Composite Cans Market Historic Value (US$ Mn), By Can Diameter 2017(H)-2021(A)
Table 22: North America Composite Cans Market Forecast Value (US$ Mn), By Can Diameter 2022(E)-2026(F)
Table 23: North America Composite Cans Market Historic Volume (Units), By Can Diameter 2017(H)-2021(A)
Table 24: North America Composite Cans Market Forecast Volume (Units), By Can Diameter 2022(E)-2026(F)
Table 25: North America Composite Cans Market Historic Value (US$ Mn), By Closure Type 2017(H)-2021(A)
Table 26: North America Composite Cans Market Forecast Value (US$ Mn), By Closure Type 2022(E)-2026(F)
Table 27: North America Composite Cans Market Historic Volume (Units), By Closure Type 2017(H)-2021(A)
Table 28: North America Composite Cans Market Forecast Volume (Units), By Closure Type 2022(E)-2026(F)
Table 29: North America Composite Cans Market Historic Value (US$ Mn), By Production Type 2017(H)-2021(A)
Table 30: North America Composite Cans Market Forecast Value (US$ Mn), By Production Type 2022(E)-2026(F)
Table 31: North America Composite Cans Market Historic Volume (Units), By Production Type 2017(H)-2021(A)
Table 32: North America Composite Cans Market Forecast Volume (Units), By Production Type 2022(E)-2026(F)
Table 33: North America Composite Cans Market Historic Value (US$ Mn), By End Use 2017(H)-2021(A)
Table 34: North America Composite Cans Market Forecast Value (US$ Mn), By End Use 2022(E)-2026(F)
Table 35: North America Composite Cans Market Historic Volume (Units), By End Use 2017(H)-2021(A)
Table 36: North America Composite Cans Market Forecast Volume (Units), By End Use 2022(E)-2026(F)
Table 37: North America Composite Cans Market Historic Value (US$ Mn), By Country 2017(H)-2021(A)
Table 38: North America Composite Cans Market Forecast Value (US$ Mn), By Country 2022(E)-2026(F)
Table 39: North America Composite Cans Market Historic Volume (Units), By Country 2017(H)-2021(A)
Table 40: North America Composite Cans Market Forecast Volume (Units), By Country 2022(E)-2026(F)
Table 41: Latin America Composite Cans Market Historic Value (US$ Mn), By Can Diameter 2017(H)-2021(A)
Table 42: Latin America Composite Cans Market Forecast Value (US$ Mn), By Can Diameter 2022(E)-2026(F)
Table 43: Latin America Composite Cans Market Historic Volume (Units), By Can Diameter 2017(H)-2021(A)
Table 44: Latin America Composite Cans Market Forecast Volume (Units), By Can Diameter 2022(E)-2026(F)
Table 45: Latin America Composite Cans Market Historic Value (US$ Mn), By Closure Type 2017(H)-2021(A)
Table 46: Latin America Composite Cans Market Forecast Value (US$ Mn), By Closure Type 2022(E)-2026(F)
Table 47: Latin America Composite Cans Market Historic Volume (Units), By Closure Type 2017(H)-2021(A)
Table 48: Latin America Composite Cans Market Forecast Volume (Units), By Closure Type 2022(E)-2026(F)
Table 49: Latin America Composite Cans Market Historic Value (US$ Mn), By Production Type 2017(H)-2021(A)
Table 50: Latin America Composite Cans Market Forecast Value (US$ Mn), By Production Type 2022(E)-2026(F)
Table 51: Latin America Composite Cans Market Historic Volume (Units), By Production Type 2017(H)-2021(A)
Table 52: Latin America Composite Cans Market Forecast Volume (Units), By Production Type 2022(E)-2026(F)
Table 53: Latin America Composite Cans Market Historic Value (US$ Mn), By End Use 2017(H)-2021(A)
Table 54: Latin America Composite Cans Market Forecast Value (US$ Mn), By End Use 2022(E)-2026(F)
Table 55: Latin America Composite Cans Market Historic Volume (Units), By End Use 2017(H)-2021(A)
Table 56: Latin America Composite Cans Market Forecast Volume (Units), By End Use 2022(E)-2026(F)
Table 57: Latin America Composite Cans Market Historic Value (US$ Mn), By Country 2017(H)-2021(A)
Table 58: Latin America Composite Cans Market Forecast Value (US$ Mn), By Country 2022(E)-2026(F)
Table 59: Latin America Composite Cans Market Historic Volume (Units), By Country 2017(H)-2021(A)
Table 60: Latin America Composite Cans Market Forecast Volume (Units), By Country 2022(E)-2026(F)
Table 61: Europe Composite Cans Market Historic Value (US$ Mn), By Can Diameter 2017(H)-2021(A)
Table 62: Europe Composite Cans Market Forecast Value (US$ Mn), By Can Diameter 2022(E)-2026(F)
Table 63: Europe Composite Cans Market Historic Volume (Units), By Can Diameter 2017(H)-2021(A)
Table 64: Europe Composite Cans Market Forecast Volume (Units), By Can Diameter 2022(E)-2026(F)
Table 65: Europe Composite Cans Market Historic Value (US$ Mn), By Closure Type 2017(H)-2021(A)
Table 66: Europe Composite Cans Market Forecast Value (US$ Mn), By Closure Type 2022(E)-2026(F)
Table 67: Europe Composite Cans Market Historic Volume (Units), By Closure Type 2017(H)-2021(A)
Table 68: Europe Composite Cans Market Forecast Volume (Units), By Closure Type 2022(E)-2026(F)
Table 69: Europe Composite Cans Market Historic Value (US$ Mn), By Production Type 2017(H)-2021(A)
Table 70: Europe Composite Cans Market Forecast Value (US$ Mn), By Production Type 2022(E)-2026(F)
Table 71: Europe Composite Cans Market Historic Volume (Units), By Production Type 2017(H)-2021(A)
Table 72: Europe Composite Cans Market Forecast Volume (Units), By Production Type 2022(E)-2026(F)
Table 73: Europe Composite Cans Market Historic Value (US$ Mn), By End Use 2017(H)-2021(A)
Table 74: Europe Composite Cans Market Forecast Value (US$ Mn), By End Use 2022(E)-2026(F)
Table 75: Europe Composite Cans Market Historic Volume (Units), By End Use 2017(H)-2021(A)
Table 76: Europe Composite Cans Market Forecast Volume (Units), By End Use 2022(E)-2026(F)
Table 77: Europe Composite Cans Market Historic Value (US$ Mn), By Country 2017(H)-2021(A)
Table 78: Europe Composite Cans Market Forecast Value (US$ Mn), By Country 2022(E)-2026(F)
Table 79: Europe Composite Cans Market Historic Volume (Units), By Country 2017(H)-2021(A)
Table 80: Europe Composite Cans Market Forecast Volume (Units), By Country 2022(E)-2026(F)
Table 81: Asia Pacific Composite Cans Market Historic Value (US$ Mn), By Can Diameter 2017(H)-2021(A)
Table 82: Asia Pacific Composite Cans Market Forecast Value (US$ Mn), By Can Diameter 2022(E)-2026(F)
Table 83: Asia Pacific Composite Cans Market Historic Volume (Units), By Can Diameter 2017(H)-2021(A)
Table 84: Asia Pacific Composite Cans Market Forecast Volume (Units), By Can Diameter 2022(E)-2026(F)
Table 85: Asia Pacific Composite Cans Market Historic Value (US$ Mn), By Closure Type 2017(H)-2021(A)
Table 86: Asia Pacific Composite Cans Market Forecast Value (US$ Mn), By Closure Type 2022(E)-2026(F)
Table 87: Asia Pacific Composite Cans Market Historic Volume (Units), By Closure Type 2017(H)-2021(A)
Table 88: Asia Pacific Composite Cans Market Forecast Volume (Units), By Closure Type 2022(E)-2026(F)
Table 89: Asia Pacific Composite Cans Market Historic Value (US$ Mn), By Production Type 2017(H)-2021(A)
Table 90: Asia Pacific Composite Cans Market Forecast Value (US$ Mn), By Production Type 2022(E)-2026(F)
Table 91: Asia Pacific Composite Cans Market Historic Volume (Units), By Production Type 2017(H)-2021(A)
Table 92: Asia Pacific Composite Cans Market Forecast Volume (Units), By Production Type 2022(E)-2026(F)
Table 93: Asia Pacific Composite Cans Market Historic Value (US$ Mn), By End Use 2017(H)-2021(A)
Table 94: Asia Pacific Composite Cans Market Forecast Value (US$ Mn), By End Use 2022(E)-2026(F)
Table 95: Asia Pacific Composite Cans Market Historic Volume (Units), By End Use 2017(H)-2021(A)
Table 96: Asia Pacific Composite Cans Market Forecast Volume (Units), By End Use 2022(E)-2026(F)
Table 97: Asia Pacific Composite Cans Market Historic Value (US$ Mn), By Country 2017(H)-2021(A)
Table 98: Asia Pacific Composite Cans Market Forecast Value (US$ Mn), By Country 2022(E)-2026(F)
Table 99: Asia Pacific Composite Cans Market Historic Volume (Units), By Country 2017(H)-2021(A)
Table 100: Asia Pacific Composite Cans Market Forecast Volume (Units), By Country 2022(E)-2026(F)
Table 101: MEA Composite Cans Market Historic Value (US$ Mn), By Can Diameter 2017(H)-2021(A)
Table 102: MEA Composite Cans Market Forecast Value (US$ Mn), By Can Diameter 2022(E)-2026(F)
Table 103: MEA Composite Cans Market Historic Volume (Units), By Can Diameter 2017(H)-2021(A)
Table 104: MEA Composite Cans Market Forecast Volume (Units), By Can Diameter 2022(E)-2026(F)
Table 105: MEA Composite Cans Market Historic Value (US$ Mn), By Closure Type 2017(H)-2021(A)
Table 106: MEA Composite Cans Market Forecast Value (US$ Mn), By Closure Type 2022(E)-2026(F)
Table 107: MEA Composite Cans Market Historic Volume (Units), By Closure Type 2017(H)-2021(A)
Table 108: MEA Composite Cans Market Forecast Volume (Units), By Closure Type 2022(E)-2026(F)
Table 109: MEA Composite Cans Market Historic Value (US$ Mn), By Production Type 2017(H)-2021(A)
Table 110: MEA Composite Cans Market Forecast Value (US$ Mn), By Production Type 2022(E)-2026(F)
Table 111: MEA Composite Cans Market Historic Volume (Units), By Production Type 2017(H)-2021(A)
Table 112: MEA Composite Cans Market Forecast Volume (Units), By Production Type 2022(E)-2026(F)
Table 113: MEA Composite Cans Market Historic Value (US$ Mn), By End Use 2017(H)-2021(A)
Table 114: MEA Composite Cans Market Forecast Value (US$ Mn), By End Use 2022(E)-2026(F)
Table 115: MEA Composite Cans Market Historic Volume (Units), By End Use 2017(H)-2021(A)
Table 116: MEA Composite Cans Market Forecast Volume (Units), By End Use 2022(E)-2026(F)
Table 117: MEA Composite Cans Market Historic Value (US$ Mn), By Country 2017(H)-2021(A)
Table 118: MEA Composite Cans Market Forecast Value (US$ Mn), By Country 2022(E)-2026(F)
Table 119: MEA Composite Cans Market Historic Volume (Units), By Country 2017(H)-2021(A)
Table 120: MEA Composite Cans Market Forecast Volume (Units), By Country 2022(E)-2026(F)
List of Figures
Figure 01: Global Composite Cans Market Share Analysis by Can Diameter, 2022E & 2026F
Figure 02: Global Composite Cans Market Attractiveness Analysis by Can Diameter, 2022E-2026F
Figure 03: Global Composite Cans Market Y-o-Y Analysis by Can Diameter, 2019H-2026F
Figure 04: Global Composite Cans Market Share Analysis by Closure Type, 2022E & 2026F
Figure 05: Global Composite Cans Market Attractiveness Analysis by Closure Type, 2022E-2026F
Figure 06: Global Composite Cans Market Y-o-Y Analysis by Closure Type, 2019H-2026F
Figure 07: Global Composite Cans Market Share Analysis by Production Type, 2022E & 2026F
Figure 08: Global Composite Cans Market Attractiveness Analysis by Production Type, 2022E-2026F
Figure 09: Global Composite Cans Market Y-o-Y Analysis by Production Type, 2019H-2026F
Figure 10: Global Composite Cans Market Share Analysis by End Use, 2022E & 2026F
Figure 11: Global Composite Cans Market Attractiveness Analysis by End Use, 2022E-2026F
Figure 12: Global Composite Cans Market Y-o-Y Analysis by End Use, 2019H-2026F
Figure 13: Global Composite Cans Market Share Analysis by Region, 2022E & 2026F
Figure 14: Global Composite Cans Market Attractiveness Analysis by Region, 2022E-2026F
Figure 15: Global Composite Cans Market Y-o-Y Analysis by Region, 2019H-2026F
Figure 16: North America Composite Cans Market Share Analysis by Can Diameter, 2022E & 2026F
Figure 17: North America Composite Cans Market Value Share Analysis by Closure Type 2022(E)
Figure 18: North America Composite Cans Market Value Share Analysis by Production Type 2022(E)
Figure 19: North America Composite Cans Market Attractiveness Analysis by End Use, 2022E-2026F
Figure 20: North America Composite Cans Market Value Share Analysis by Country 2022(E)
Figure 21: Latin America Composite Cans Market Share Analysis by Can Diameter, 2022E & 2026F
Figure 22: Latin America Composite Cans Market Value Share Analysis by Closure Type 2022(E)
Figure 23: Latin America Composite Cans Market Value Share Analysis by Production Type 2022(E)
Figure 24: Latin America Composite Cans Market Attractiveness Analysis by End Use, 2022E-2026F
Figure 25: Latin America Composite Cans Market Value Share Analysis by Country 2022(E)
Figure 26: Europe Composite Cans Market Share Analysis by Can Diameter, 2022E & 2026F
Figure 27: Europe Composite Cans Market Value Share Analysis by Closure Type 2022(E)
Figure 28: Europe Composite Cans Market Value Share Analysis by Production Type 2022(E)
Figure 29: Europe Composite Cans Market Attractiveness Analysis by End Use, 2022E-2026F
Figure 30: Europe Composite Cans Market Value Share Analysis by Country 2022(E)
Figure 31: Asia Pacific Composite Cans Market Share Analysis by Can Diameter, 2022E & 2026F
Figure 32: Asia Pacific Composite Cans Market Value Share Analysis by Closure Type 2022(E)
Figure 33: Asia Pacific Composite Cans Market Value Share Analysis by Production Type 2022(E)
Figure 34: Asia Pacific Composite Cans Market Attractiveness Analysis by End Use, 2022E-2026F
Figure 35: Asia Pacific Composite Cans Market Value Share Analysis by Country 2022(E)
Figure 36: MEA Composite Cans Market Share Analysis by Can Diameter, 2022E & 2026F
Figure 37: MEA Composite Cans Market Value Share Analysis by Closure Type 2022(E)
Figure 38: MEA Composite Cans Market Value Share Analysis by Production Type 2022(E)
Figure 39: MEA Composite Cans Market Attractiveness Analysis by End Use, 2022E-2026F
Figure 40: MEA Composite Cans Market Value Share Analysis by Country 2022(E)
Figure 41: U.S. Composite Cans Market Value Share Analysis, by Can Diameter, 2022E & 2026F
Figure 42: U.S. Composite Cans Market Value Share Analysis, by Closure Type, 2022E
Figure 43: U.S. Composite Cans Market Value Share Analysis, by Production Type, 2022E
Figure 44: U.S. Composite Cans Market Value Share Analysis, by End Use, 2022E & 2026F
Figure 45: Canada Composite Cans Market Value Share Analysis, by Can Diameter, 2022E & 2026F
Figure 46: Canada Composite Cans Market Value Share Analysis, by Closure Type, 2022E
Figure 47: Canada Composite Cans Market Value Share Analysis, by Production Type, 2022E
Figure 48: Canada Composite Cans Market Value Share Analysis, by End Use, 2022E & 2026F
Figure 49: Brazil Composite Cans Market Value Share Analysis, by Can Diameter, 2022E & 2026F
Figure 50: Brazil Composite Cans Market Value Share Analysis, by Closure Type, 2022E
Figure 51: Brazil Composite Cans Market Value Share Analysis, by Production Type, 2022E
Figure 52: Brazil Composite Cans Market Value Share Analysis, by End Use, 2022E & 2026F
Figure 53: Mexico Composite Cans Market Value Share Analysis, by Can Diameter, 2022E & 2026F
Figure 54: Mexico Composite Cans Market Value Share Analysis, by Closure Type, 2022E
Figure 55: Mexico Composite Cans Market Value Share Analysis, by Production Type, 2022E
Figure 56: Mexico Composite Cans Market Value Share Analysis, by End Use, 2022E & 2026F
Figure 57: Germany Composite Cans Market Value Share Analysis, by Can Diameter, 2022E & 2026F
Figure 58: Germany Composite Cans Market Value Share Analysis, by Closure Type, 2022E
Figure 59: Germany Composite Cans Market Value Share Analysis, by Production Type, 2022E
Figure 60: Germany Composite Cans Market Value Share Analysis, by End Use, 2022E & 2026F
Figure 61: Spain Composite Cans Market Value Share Analysis, by Can Diameter, 2022E & 2026F
Figure 62: Spain Composite Cans Market Value Share Analysis, by Closure Type, 2022E
Figure 63: Spain Composite Cans Market Value Share Analysis, by Production Type, 2022E
Figure 64: Spain Composite Cans Market Value Share Analysis, by End Use, 2022E & 2026F
Figure 65: France Composite Cans Market Value Share Analysis, by Can Diameter, 2022E & 2026F
Figure 66: France Composite Cans Market Value Share Analysis, by Closure Type, 2022E
Figure 67: France Composite Cans Market Value Share Analysis, by Production Type, 2022E
Figure 68: France Composite Cans Market Value Share Analysis, by End Use, 2022E & 2026F
Figure 69: U.K. Composite Cans Market Value Share Analysis, by Can Diameter, 2022E & 2026F
Figure 70: U.K. Composite Cans Market Value Share Analysis, by Closure Type, 2022E
Figure 71: U.K. Composite Cans Market Value Share Analysis, by Production Type, 2022E
Figure 72: U.K. Composite Cans Market Value Share Analysis, by End Use, 2022E & 2026F
Figure 73: Italy Composite Cans Market Value Share Analysis, by Can Diameter, 2022E & 2026F
Figure 74: Italy Composite Cans Market Value Share Analysis, by Closure Type, 2022E
Figure 75: Italy Composite Cans Market Value Share Analysis, by Production Type, 2022E
Figure 76: Italy Composite Cans Market Value Share Analysis, by End Use, 2022E & 2026F
Figure 77: Russia Composite Cans Market Value Share Analysis, by Can Diameter, 2022E & 2026F
Figure 78: Russia Composite Cans Market Value Share Analysis, by Closure Type, 2022E
Figure 79: Russia Composite Cans Market Value Share Analysis, by Production Type, 2022E
Figure 80: Russia Composite Cans Market Value Share Analysis, by End Use, 2022E & 2026F
Figure 81: China Composite Cans Market Value Share Analysis, by Can Diameter, 2022E & 2026F
Figure 82: China Composite Cans Market Value Share Analysis, by Closure Type, 2022E
Figure 83: China Composite Cans Market Value Share Analysis, by Production Type, 2022E
Figure 84: China Composite Cans Market Value Share Analysis, by End Use, 2022E & 2026F
Figure 85: India Composite Cans Market Value Share Analysis, by Can Diameter, 2022E & 2026F
Figure 86: India Composite Cans Market Value Share Analysis, by Closure Type, 2022E
Figure 87: India Composite Cans Market Value Share Analysis, by Production Type, 2022E
Figure 88: India Composite Cans Market Value Share Analysis, by End Use, 2022E & 2026F
Figure 89: Japan Composite Cans Market Value Share Analysis, by Can Diameter, 2022E & 2026F
Figure 90: Japan Composite Cans Market Value Share Analysis, by Closure Type, 2022E
Figure 91: Japan Composite Cans Market Value Share Analysis, by Production Type, 2022E
Figure 92: Japan Composite Cans Market Value Share Analysis, by End Use, 2022E & 2026F
Figure 93: GCC Countries Composite Cans Market Value Share Analysis, by Can Diameter, 2022E & 2026F
Figure 94: GCC Countries Composite Cans Market Value Share Analysis, by Closure Type, 2022E
Figure 95: GCC Countries Composite Cans Market Value Share Analysis, by Production Type, 2022E
Figure 96: GCC Countries Composite Cans Market Value Share Analysis, by End Use, 2022E & 2026F
Figure 97: South Africa Composite Cans Market Value Share Analysis, by Can Diameter, 2022E & 2026F
Figure 98: South Africa Composite Cans Market Value Share Analysis, by Closure Type, 2022E
Figure 99: South Africa Composite Cans Market Value Share Analysis, by Production Type, 2022E
Figure 100: South Africa Composite Cans Market Value Share Analysis, by End Use, 2022E & 2026F
Copyright © Transparency Market Research, Inc. All Rights reserved
Trust Online


Composite Cans Market