
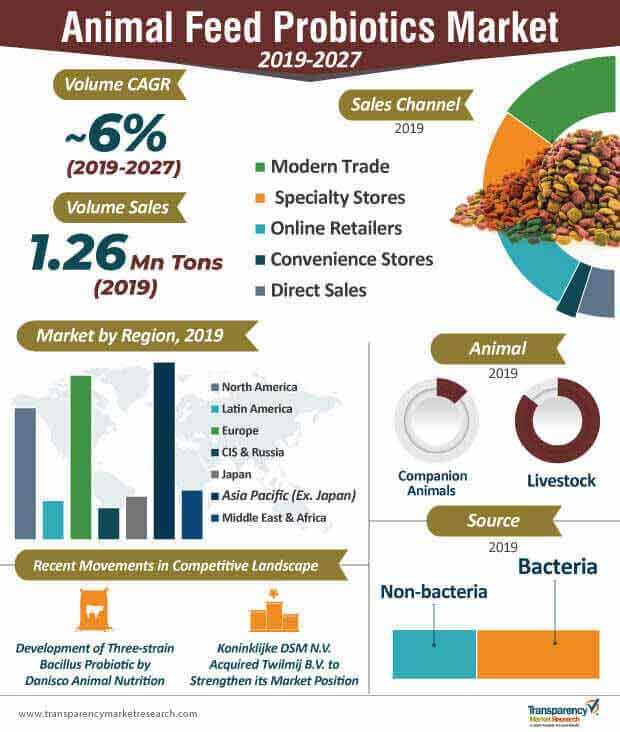
The animal feed probiotics market recorded volume sales of 1.19 Mn tons in 2018, and sensing the above-average growth potential of this landscape, market players are dedicating their focus on R&D activities for introducing innovative products.
Seasoned analysts at Transparency Market Research (TMR) consider the innovative approach to remain the mainstay of the animal feed probiotics market’s vertical scramble. For instance, in 2018, Alltech announced the launch of Viligen™ - a feed additive to promote the health of gut and microflora among pigs - at ONE: The Alltech Ideas Conference. Also, technological excellence in the molecular biology and gene sequencing process has exerted a weighted influence on the development of new probiotic-based animal feed products.
On the demand side, an increase in the consumption of animal-protein has put pressure on livestock farmers to ensure adequate nutritional supplements in feeds. Increasing consumption of animal products, such as meat, chicken, eggs, and beef, has intensified the scrutiny level of regulatory bodies, and antibiotic-fed farm animals face rejection. Taking an opportunity from the regulatory protocols, market players are being successful in penetrating probiotic-based animal feeds in the antibiotic-led market.
Request a sample to get extensive insights into the Animal Feed Probiotics market
Despite technological advancements, the animal feed probiotics market is yet to realize its full potential, on account of the stronghold of the antibiotic-based animal feed market. Surprisingly, knowledge regarding pernicious influences of antibiotic-based feeds is limited even in developed countries, which impedes the exposure of animal feed probiotics. Also, probiotics are beneficial when used in moderate quantities, and any recklessness in the dosage may cause digestive dysfunction in animals.
Given the profound impact of limited information regarding the benefits of probiotics, and negative impact on brand value caused by adverse effects due to incorrect dosage, are likely to impede the growth of the animal feed probiotics market.
To understand how our report can bring difference to your business strategy, Ask for a brochure
Besides the presence of stringent laws against the consumption of beef in India, Islam religion followers residing in Pakistan, Bangladesh, Indonesia, and China consider the consumption of pork as 'haram'. However, it may come out as a surprise that the consumption of animal products overrules religious sentiments in APEJ, as the region enjoys a leading position in the animal feed probiotics market.
Population explosion in APEJ is the driving force behind the rapid rise in the consumption of eggs, milk, and meat, and the influence of urban sprawl coupled with increasing restaurant chains has further complemented the demand for livestock in the region. As knowledge regarding the consumption of clean food and beverages gains prominence, the demand for healthy livestock has, in turn, created opportunities for the animal feed probiotics market.
Given the influence of Western culture, pet ownership is fast-penetrating as the new normal in the APEJ society, and, with the financial lucidity of consumers, they are able to provide premium and healthy feeds to their pets. All-in-all, APEJ is projected to remain a high-value and high-growth animal feed probiotics market during the forecast period, with an anticipated volume CAGR of ~6%.
Stuck in a neck-to-neck competition with other brands? Request a custom report on “Animal Feed Probiotics market”
Analysts’ View on the Animal Feed Probiotics Market
Analysts of the TMR study estimate that, the volume consumption of animal feed probiotics will grow from 1.26 Mn in 2019 to 2.02 Mn in 2027, and increasing awareness regarding the benefits of probiotics over antibiotics is likely to remain a profound driver of the market. As farm animals are an integral part of the food chain, regulations regarding the quality of their feeds are growing in importance, which has hard-pressed players operating in the animal feed probiotics market to deliver high-quality products. Market players can enhance their portfolios with the dry form of animal feed probiotics, since these products are easy to store along with low storage costs, offer ease of transportation, and possess longer shelf life, as opposed to the liquid form of products. Overall, the growth prospects of the market seems promising, with an estimated CAGR of ~7% during 2019-2027.
Animal Feed Probiotics Market: Overview
Animal Feed Probiotics Market: Frontrunners
Animal Feed Probiotics Market: Trends
Animal Feed Probiotics Market: Strategies
Target Region for Animal Feed Probiotics Market
Animal Feed Probiotics Market: Key Players
Key Segments of the Animal Feed Probiotics Market
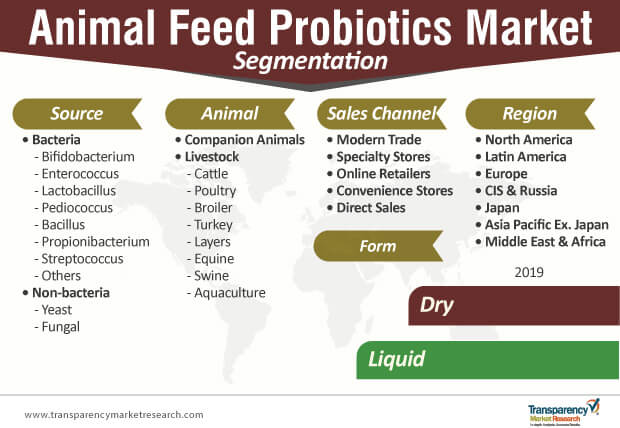
TMR’s study on the animal feed probiotics market offers information divided into important segments - source, animal, form, sales channel, and region. This report offers comprehensive data and information about the important market dynamics and growth parameters associated with these categories.
|
Source |
|
|
Animal |
|
|
Form |
|
|
Sales Channel |
|
|
Region |
|
1. Global Animal Feed Probiotics Market - Executive Summary
1.1. Global Animal Feed Probiotics Market Country Analysis
1.2. Application – Product Mapping
1.3. Competition Blueprint
1.4. Technology Time Line Mapping
1.5. TMR Analysis and Recommendations
2. Market Overview
2.1. Market Introduction
2.2. Market Definition
2.3. Market Taxonomy
3. Market Dynamics
3.1. Macro-economic Factors
3.2. Drivers
3.2.1. Economic Drivers
3.2.2. Supply Side Drivers
3.2.3. Demand Side Drivers
3.3. Market Restraints
3.4. Market Opportunities
3.5. Forecast Factors – Relevance and Impact
3.6. Top exporters/Importers for Animal Feed Probiotic
3.7. Key Regulations and Claims
3.7.1. Labeling and Claims
3.7.2. Import/Export Regulations
4. Key Market Trends
4.1. Key Trends Impacting the Market
4.2. Product Innovation / Development Trends
4.3. Deciphering Consumer Buying Pattern
5. Sentiment Analysis
5.1. Consumer Sentiment Analysis
5.2. Social Media Sentiment Analysis
6. Supply Chain Analysis
6.1. Profitability and Gross Margin Analysis By Competition
6.2. List of Active Participants- By Region
7. Global Animal Feed Probiotics Market Pricing Analysis
7.1. Price Point Assessment by Region
7.1.1. Manufacturer Level Pricing
7.1.2. Distributor Level Pricing
7.1.3. Retailer Level Pricing
7.2. Price Point Assessment by Animal
7.3. Price Forecast till 2027
8. Global Animal Feed Probiotics Market Analysis and Forecast
8.1. Market Size Analysis (2014-2018) and Forecast (2019-2027)
8.1.1. Market Value (US$ Mn) and Volume (Tons) and Y-o-Y Growth
8.1.2. Absolute $ Opportunity
8.2. Global Animal Feed Probiotics Market Scenario Forecast (Optimistic, Likely and Conservative Market Conditions)
8.2.1. Forecast Factors and Relevance of Impact
8.2.2. Regional Animal Feed Probiotics Market Business Performance Summary
9. Global Animal Feed Probiotics Market Analysis By Source
9.1. Introduction
9.1.1. Y-o-Y Growth Comparison By Source
9.1.2. Basis Point Share (BPS) Analysis By Source
9.2. Animal Feed Probiotics Market Size (US$ Mn) and Volume (MT) Analysis (2014-2018) & Forecast (2019-2027) By Source
9.2.1. Bacteria
9.2.1.1. Bifidobacterium
9.2.1.2. Enterococcus
9.2.1.3. Lactobacillus
9.2.1.4. Pediococcus
9.2.1.5. Bacillus
9.2.1.6. Propionibacterium
9.2.1.7. Streptococcus
9.2.1.8. Others
9.2.2. Non Bacteria
9.2.2.1. Yeast
9.2.2.2. Fungal
9.3. Market Attractiveness Analysis By Source
10. Global Animal Feed Probiotics Market Analysis By Animal
10.1. Introduction
10.1.1. Y-o-Y Growth Comparison By Animal
10.1.2. Basis Point Share (BPS) Analysis By Animal
10.2. Animal Feed Probiotics Market Size (US$ Mn) and Volume (MT) Analysis (2014-2018) & Forecast (2019-2027) By Animal
10.2.1. Companion Animals
10.2.2. Livestock
10.2.2.1. Cattle
10.2.2.2. Poultry
10.2.2.3. Broiler
10.2.2.4. Turkey
10.2.2.5. Layers
10.2.2.6. Equine
10.2.2.7. Swine
10.2.2.8. Aquaculture
10.3. Market Attractiveness Analysis By Animal
11. Global Animal Feed Probiotics Market Analysis By Form
11.1. Introduction
11.1.1. Y-o-Y Growth Comparison By Form
11.1.2. Basis Point Share (BPS) Analysis By Form
11.2. Animal Feed Probiotics Market Size (US$ Mn) and Volume (MT) Analysis (2014-2018) & Forecast (2019-2027) By Form
11.2.1. Liquid
11.2.2. Dry
11.3. Market Attractiveness Analysis By Form
12. Global Animal Feed Probiotics Market Analysis By Sales Channel
12.1. Introduction
12.1.1. Y-o-Y Growth Comparison By Sales Channel
12.1.2. Basis Point Share (BPS) Analysis By Sales Channel
12.2. Animal Feed Probiotics Market Size (US$ Mn) and Volume (MT) Analysis (2014-2018) & Forecast (2019-2027) By Sales Channel
12.2.1. Modern Trade
12.2.2. Specialty Stores
12.2.3. Online Retailers
12.2.4. Convenience Stores
12.2.5. Direct Sales
12.3. Market Attractiveness Analysis By Sales Channel
13. Global Animal Feed Probiotics Market Analysis and Forecast, By Region
13.1. Introduction
13.1.1. Basis Point Share (BPS) Analysis By Region
13.1.2. Y-o-Y Growth Projections By Region
13.2. Animal Feed Probiotics Market Size (US$ Mn) and Volume (MT) & Forecast (2019-2027) Analysis By Region
13.2.1. North America
13.2.2. Europe
13.2.3. CIS and Russia
13.2.4. APEJ
13.2.5. Japan
13.2.6. Latin America
13.2.7. Middle East and Africa
13.3. Market Attractiveness Analysis By Region
14. North America Animal Feed Probiotics Market Analysis and Forecast
14.1. Introduction
14.1.1. Basis Point Share (BPS) Analysis By Country
14.1.2. Y-o-Y Growth Projections By Country
14.2. Animal Feed Probiotics Market Size (Value (US$) and Volume (MT) Analysis (2014-2018) and Forecast (2019-2027)
14.2.1. Market Attractiveness By Country
14.2.1.1. U.S.
14.2.1.2. Canada
14.2.2. By Source
14.2.3. By Animal
14.2.4. By Form
14.2.5. By Sales Channel
14.3. Market Attractiveness Analysis
14.3.1. By Country
14.3.2. By Source
14.3.3. By Animal
14.3.4. By Form
14.3.5. By Sales Channel
14.4. Drivers and Restraints: Impact Analysis
14.5. Heat Map Analysis
14.6. Market Trends
15. Latin America Animal Feed Probiotics Market Analysis and Forecast
15.1. Introduction
15.1.1. Basis Point Share (BPS) Analysis By Country
15.1.2. Y-o-Y Growth Projections By Country
15.1.3. Key Regulations
15.2. Animal Feed Probiotics Market Size (Value (US$) and Volume (MT) Analysis (2014-2018) and Forecast (2019-2027)
15.2.1. By Country
15.2.1.1. Brazil
15.2.1.2. Mexico
15.2.1.3. Chile
15.2.1.4. Peru
15.2.1.5. Argentina
15.2.1.6. Rest of Latin America
15.2.2. By Source
15.2.3. By Animal
15.2.4. By Form
15.2.5. By Sales Channel
15.3. Market Attractiveness Analysis
15.3.1. By Country
15.3.2. By Source
15.3.3. By Animal
15.3.4. By Form
15.3.5. By Sales Channel
15.4. Drivers and Restraints: Impact Analysis
15.5. Heat Map Analysis
15.6. Market Trends
16. Europe Animal Feed Probiotics Market Analysis and Forecast
16.1. Introduction
16.1.1. Basis Point Share (BPS) Analysis By Country
16.1.2. Y-o-Y Growth Projections By Country
16.1.3. Key Regulations
16.2. Animal Feed Probiotics Market Size (Value (US$) and Volume (MT) Analysis (2014-2018) and Forecast (2019-2027)
16.2.1. By Country
16.2.1.1. Germany
16.2.1.2. France
16.2.1.3. Italy
16.2.1.4. U.K.
16.2.1.5. BENELUX
16.2.1.6. Rest of Europe
16.2.2. By Source
16.2.3. By Animal
16.2.4. By Form
16.2.5. By Sales Channel
16.3. Market Attractiveness Analysis
16.3.1. By Country
16.3.2. By Source
16.3.3. By Animal
16.3.4. By Form
16.3.5. By Sales Channel
16.4. Drivers and Restraints: Impact Analysis
16.5. Heat Map Analysis
16.6. Market Trends
17. CIS & Russia Animal Feed Probiotics Market Analysis and Forecast
17.1. Introduction
17.1.1. Basis Point Share (BPS) Analysis By Country
17.1.2. Y-o-Y Growth Projections By Country
17.1.3. Key Regulations
17.2. Animal Feed Probiotics Market Size (Value (US$) and Volume (MT) Analysis (2014-2018) and Forecast (2019-2027)
17.2.1. By Source
17.2.2. By Animal
17.2.3. By Form
17.2.4. By Sales Channel
17.3. Market Attractiveness Analysis
17.3.1. By Source
17.3.2. By Animal
17.3.3. By Form
17.3.4. By Sales Channel
17.4. Drivers and Restraints: Impact Analysis
17.5. Heat Map Analysis
17.6. Market Trends
18. APEJ Animal Feed Probiotics Market Analysis and Forecast
18.1. Introduction
18.1.1. Basis Point Share (BPS) Analysis By Country
18.1.2. Y-o-Y Growth Projections By Country
18.1.3. Key Regulations
18.2. Animal Feed Probiotics Market Size (Value (US$) and Volume (MT) Analysis (2014-2018) and Forecast (2019-2027)
18.2.1. By Country
18.2.1.1. Greater China
18.2.1.2. India
18.2.1.3. Australia & New Zealand
18.2.1.4. ASEAN
18.2.1.5. Rest of APEJ
18.2.2. By Source
18.2.3. By Animal
18.2.4. By Form
18.2.5. By Sales Channel
18.3. Market Attractiveness Analysis
18.3.1. By Country
18.3.2. By Source
18.3.3. By Animal
18.3.4. By Form
18.3.5. By Sales Channel
18.4. Drivers and Restraints: Impact Analysis
18.5. Heat Map Analysis
18.6. Market Trends
19. Japan Animal Feed Probiotics Market Analysis and Forecast
19.1. Introduction
19.1.1. Basis Point Share (BPS) Analysis By Country
19.1.2. Y-o-Y Growth Projections By Country
19.1.3. Key Regulations
19.2. Animal Feed Probiotics Market Size (Value (US$) and Volume (MT) Analysis (2014-2018) and Forecast (2019-2027)
19.2.1. By Source
19.2.2. By Animal
19.2.3. By Form
19.2.4. By Sales Channel
19.3. Market Attractiveness Analysis
19.3.1. By Source
19.3.2. By Animal
19.3.3. By Form
19.3.4. By Sales Channel
19.4. Drivers and Restraints: Impact Analysis
19.5. Heat Map Analysis
19.6. Market Trends
20. Middle East and Africa (MEA) Animal Feed Probiotics Market Analysis and Forecast
20.1. Introduction
20.1.1. Basis Point Share (BPS) Analysis By Country
20.1.2. Y-o-Y Growth Projections By Country
20.1.3. Key Regulations
20.2. Animal Feed Probiotics Market Size (Value (US$) and Volume (MT) Analysis (2014-2018) and Forecast (2019-2027)
20.2.1. By Country
20.2.1.1. GCC Countries
20.2.1.2. South Africa
20.2.1.3. Turkey
20.2.1.4. Iran
20.2.1.5. Israel
20.2.1.6. Rest of MEA
20.2.2. By Source
20.2.3. By Animal
20.2.4. By Form
20.2.5. By Sales Channel
20.3. Market Attractiveness Analysis
20.3.1. By Country
20.3.2. By Source
20.3.3. By Animal
20.3.4. By Form
20.3.5. By Sales Channel
20.4. Drivers and Restraints: Impact Analysis
20.5. Heat Map Analysis
20.6. Market Trends
21. Competition Assessment
21.1. Global Animal Feed Probiotics Market Competition - a Dashboard View
21.2. Global Animal Feed Probiotics Market Structure Analysis
21.3. Global Animal Feed Probiotics Market Company Share Analysis
21.3.1. For Tier 1 Market Players, 2018
21.3.2. Company Market Share Analysis of Top 5 Players, By Region
21.4. Key Participants Market Presence (Intensity Mapping) by Region
22. Competition Deep-dive (Manufacturers/Suppliers)
22.1. Alltech Inc
22.1.1. Overview
22.1.1.1. Product Portfolio
22.1.1.2. Sales Footprint
22.1.1.3. Channel Footprint
22.1.1.3.1. Distributors List
22.1.1.3.2. Sales Channel (Clients)
22.1.1.4. Strategy Overview
22.1.1.4.1. Marketing Strategy
22.1.1.4.2. Culture Strategy
22.1.1.4.3. Channel Strategy
22.1.1.5. SWOT Analysis
22.1.1.6. Financial Analysis
22.1.1.7. Revenue Share
22.1.1.8. Key Clients
22.1.1.9. Analyst Comments
22.2. DuPont Company
22.2.1. Overview
22.2.1.1. Product Portfolio
22.2.1.2. Sales Footprint
22.2.1.3. Channel Footprint
22.2.1.3.1. Distributors List
22.2.1.3.2. Sales Channel (Clients)
22.2.1.4. Strategy Overview
22.2.1.4.1. Marketing Strategy
22.2.1.4.2. Culture Strategy
22.2.1.4.3. Channel Strategy
22.2.1.5. SWOT Analysis
22.2.1.6. Financial Analysis
22.2.1.7. Revenue Share
22.2.1.8. Key Clients
22.2.1.9. Analyst Comments
22.3. Koninklijke DSM N.V.
22.3.1. Overview
22.3.1.1. Product Portfolio
22.3.1.2. Sales Footprint
22.3.1.3. Channel Footprint
22.3.1.3.1. Distributors List
22.3.1.3.2. Sales Channel (Clients)
22.3.1.4. Strategy Overview
22.3.1.4.1. Marketing Strategy
22.3.1.4.2. Culture Strategy
22.3.1.4.3. Channel Strategy
22.3.1.5. SWOT Analysis
22.3.1.6. Financial Analysis
22.3.1.7. Revenue Share
22.3.1.8. Key Clients
22.3.1.9. Analyst Comments
22.4. Chr. Hansen Holding A/S
22.4.1. Overview
22.4.1.1. Product Portfolio
22.4.1.2. Sales Footprint
22.4.1.3. Channel Footprint
22.4.1.3.1. Distributors List
22.4.1.3.2. Sales Channel (Clients)
22.4.1.4. Strategy Overview
22.4.1.4.1. Marketing Strategy
22.4.1.4.2. Culture Strategy
22.4.1.4.3. Channel Strategy
22.4.1.5. SWOT Analysis
22.4.1.6. Financial Analysis
22.4.1.7. Revenue Share
22.4.1.8. Key Clients
22.4.1.9. Analyst Comments
22.5. Evonik Industries AG
22.5.1. Overview
22.5.1.1. Product Portfolio
22.5.1.2. Sales Footprint
22.5.1.3. Channel Footprint
22.5.1.3.1. Distributors List
22.5.1.3.2. Sales Channel (Clients)
22.5.1.4. Strategy Overview
22.5.1.4.1. Marketing Strategy
22.5.1.4.2. Culture Strategy
22.5.1.4.3. Channel Strategy
22.5.1.5. SWOT Analysis
22.5.1.6. Financial Analysis
22.5.1.7. Revenue Share
22.5.1.8. Key Clients
22.5.1.9. Analyst Comments
22.6. Adisseo France SAS
22.6.1. Overview
22.6.1.1. Product Portfolio
22.6.1.2. Sales Footprint
22.6.1.3. Channel Footprint
22.6.1.3.1. Distributors List
22.6.1.3.2. Sales Channel (Clients)
22.6.1.4. Strategy Overview
22.6.1.4.1. Marketing Strategy
22.6.1.4.2. Culture Strategy
22.6.1.4.3. Channel Strategy
22.6.1.5. SWOT Analysis
22.6.1.6. Financial Analysis
22.6.1.7. Revenue Share
22.6.1.8. Key Clients
22.6.1.9. Analyst Comments
22.7. Novus International Inc.
22.7.1. Overview
22.7.1.1. Product Portfolio
22.7.1.2. Sales Footprint
22.7.1.3. Channel Footprint
22.7.1.3.1. Distributors List
22.7.1.3.2. Sales Channel (Clients)
22.7.1.4. Strategy Overview
22.7.1.4.1. Marketing Strategy
22.7.1.4.2. Culture Strategy
22.7.1.4.3. Channel Strategy
22.7.1.5. SWOT Analysis
22.7.1.6. Financial Analysis
22.7.1.7. Revenue Share
22.7.1.8. Key Clients
22.7.1.9. Analyst Comments
22.8. Lallemand Inc.
22.8.1. Overview
22.8.1.1. Product Portfolio
22.8.1.2. Sales Footprint
22.8.1.3. Channel Footprint
22.8.1.3.1. Distributors List
22.8.1.3.2. Sales Channel (Clients)
22.8.1.4. Strategy Overview
22.8.1.4.1. Marketing Strategy
22.8.1.4.2. Culture Strategy
22.8.1.4.3. Channel Strategy
22.8.1.5. SWOT Analysis
22.8.1.6. Financial Analysis
22.8.1.7. Revenue Share
22.8.1.8. Key Clients
22.8.1.9. Analyst Comments
22.9. Calpis Co. Ltd.
22.9.1. Overview
22.9.1.1. Product Portfolio
22.9.1.2. Sales Footprint
22.9.1.3. Channel Footprint
22.9.1.3.1. Distributors List
22.9.1.3.2. Sales Channel (Clients)
22.9.1.4. Strategy Overview
22.9.1.4.1. Marketing Strategy
22.9.1.4.2. Culture Strategy
22.9.1.4.3. Channel Strategy
22.9.1.5. SWOT Analysis
22.9.1.6. Financial Analysis
22.9.1.7. Revenue Share
22.9.1.8. Key Clients
22.9.1.9. Analyst Comments
23. Recommendation- Critical Success Factors
24. Research Methodology
25. Assumptions & Acronyms Used
List of Tables:
Table 01: Global Animal Feed Probiotics Market Value (US$ Mn) by Region, 2013-2027
Table 02: Global Animal Feed Probiotics Market Volume (Tons) by Region, 2013-2027
Table 03: Global Animal Feed Probiotics Market Value (US$ Mn) by Source, 2013-2027
Table 04: Global Animal Feed Probiotics Market Volume (Tons) by Source, 2013-2027
Table 05: Global Animal Feed Probiotics Market Value (US$ Mn) by Animal, 2013-2027
Table 06: Global Animal Feed Probiotics Market Volume (Tons) by Animal, 2013-2027
Table 07: Global Animal Feed Probiotics Market Value (US$ Mn) by Form, 2013-2027
Table 08: Global Animal Feed Probiotics Market Volume (Tons) by Form, 2013-2027
Table 09: Global Animal Feed Probiotics Market Value (US$ Mn) by Sales Channel, 2013-2027
Table 10: Global Animal Feed Probiotics Market Volume (Tons) by Sales Channel, 2013-2027
Table 11: North America Animal Feed Probiotics Market Value (US$ Mn) by Country, 2013-2027
Table 12: North America Animal Feed Probiotics Market Volume (Tons) by Country, 2013-2027
Table 13: North America Animal Feed Probiotics Market Value (US$ Mn) by Source, 2013-2027
Table 14: North America Animal Feed Probiotics Market Volume (Tons) by Source, 2013-2027
Table 15: North America Animal Feed Probiotics Market Value (US$ Mn) by Animal, 2013-2027
Table 16: North America Animal Feed Probiotics Market Volume (Tons) by Animal, 2013-2027
Table 17: North America Animal Feed Probiotics Market Value (US$ Mn) by Form, 2013-2027
Table 18: North America Animal Feed Probiotics Market Volume (Tons) by Form, 2013-2027
Table 19: North America Animal Feed Probiotics Market Value (US$ Mn) by Sales Channel, 2013-2027
Table 20: North America Animal Feed Probiotics Market Volume (Tons) by Sales Channel, 2013-2027
Table 21: Latin America Animal Feed Probiotics Market Value (US$ Mn) by Region, 2013-2027
Table 22: Latin America Animal Feed Probiotics Market Volume (Tons) by Region, 2013-2027
Table 23: Latin America Animal Feed Probiotics Market Value (US$ Mn) by Source, 2013-2027
Table 24: Latin America Animal Feed Probiotics Market Volume (Tons) by Source, 2013-2027
Table 25: Latin America Animal Feed Probiotics Market Value (US$ Mn) by Animal, 2013-2027
Table 26: Latin America Animal Feed Probiotics Market Volume (Tons) by Animal, 2013-2027
Table 27: Latin America Animal Feed Probiotics Market Value (US$ Mn) by Form, 2013-2027
Table 28: Latin America Animal Feed Probiotics Market Volume (Tons) by Form, 2013-2027
Table 29: Latin America Animal Feed Probiotics Market Value (US$ Mn) by Sales Channel, 2013-2027
Table 30: Latin America Animal Feed Probiotics Market Volume (Tons) by Sales Channel, 2013-2027
Table 31: Europe Animal Feed Probiotics Market Value (US$ Mn) by Country, 2013-2027
Table 32: Europe Animal Feed Probiotics Market Volume (Tons) by Country, 2013-2027
Table 33: Europe Animal Feed Probiotics Market Value (US$ Mn) by Source, 2013-2027
Table 34: Europe Animal Feed Probiotics Market Volume (Tons) by Source, 2013-2027
Table 35: Europe Animal Feed Probiotics Market Value (US$ Mn) by Animal, 2013-2027
Table 36: Europe Animal Feed Probiotics Market Volume (Tons) by Animal, 2013-2027
Table 37: Europe Animal Feed Probiotics Market Value (US$ Mn) by Form, 2013-2027
Table 38: Europe Animal Feed Probiotics Market Volume (Tons) by Form, 2013-2027
Table 39: Europe Animal Feed Probiotics Market Value (US$ Mn) by Sales Channel, 2013-2027
Table 40: Europe Animal Feed Probiotics Market Volume (Tons) by Sales Channel, 2013-2027
Table 41: CIS & Russia Animal Feed Probiotics Market Value (US$ Mn) by Source, 2013-2027
Table 42: CIS & Russia Animal Feed Probiotics Market Volume (Tons) by Source, 2013-2027
Table 43: CIS & Russia Animal Feed Probiotics Market Value (US$ Mn) by Animal, 2013-2027
Table 44: CIS & Russia Animal Feed Probiotics Market Volume (Tons) by Animal, 2013-2027
Table 45: CIS & Russia Animal Feed Probiotics Market Value (US$ Mn) by Form, 2013-2027
Table 46: CIS & Russia Animal Feed Probiotics Market Volume (Tons) by Form, 2013-2027
Table 47: CIS & Russia Animal Feed Probiotics Market Value (US$ Mn) by Sales Channel, 2013-2027
Table 48: CIS & Russia Animal Feed Probiotics Market Volume (Tons) by Sales Channel, 2013-2027
Table 49: Japan Animal Feed Probiotics Market Value (US$ Mn) by Source, 2013-2027
Table 50: Japan Animal Feed Probiotics Market Volume (Tons) by Source, 2013-2027
Table 51: Japan Animal Feed Probiotics Market Value (US$ Mn) by Animal, 2013-2027
Table 52: Japan Animal Feed Probiotics Market Volume (Tons) by Animal, 2013-2027
Table 53: Japan Animal Feed Probiotics Market Value (US$ Mn) by Form, 2013-2027
Table 54: Japan Animal Feed Probiotics Market Volume (Tons) by Form, 2013-2027
Table 55: Japan Animal Feed Probiotics Market Value (US$ Mn) by Sales Channel, 2013-2027
Table 56: Japan Animal Feed Probiotics Market Volume (Tons) by Sales Channel, 2013-2027
Table 57: APEJ Animal Feed Probiotics Market Value (US$ Mn) by Region, 2013-2027
Table 58: APEJ Animal Feed Probiotics Market Volume (Tons) by Region, 2013-2027
Table 59: APEJ Animal Feed Probiotics Market Value (US$ Mn) by Source, 2013-2027
Table 60: APEJ Animal Feed Probiotics Market Volume (Tons) by Source, 2013-2027
Table 61: APEJ Animal Feed Probiotics Market Value (US$ Mn) by Animal, 2013-2027
Table 62: APEJ Animal Feed Probiotics Market Volume (Tons) by Animal, 2013-2027
Table 63: APEJ Animal Feed Probiotics Market Value (US$ Mn) by Form, 2013-2027
Table 64: APEJ Animal Feed Probiotics Market Volume (Tons) by Form, 2013-2027
Table 65: APEJ Animal Feed Probiotics Market Value (US$ Mn) by Sales Channel, 2013-2027
Table 66: APEJ Animal Feed Probiotics Market Volume (Tons) by Sales Channel, 2013-2027
Table 67: MEA Animal Feed Probiotics Market Value (US$ Mn) by Country, 2013-2027
Table 68: MEA Animal Feed Probiotics Market Volume (Tons) by Country, 2013-2027
Table 69: MEA Animal Feed Probiotics Market Value (US$ Mn) by Source, 2013-2027
Table 70: MEA Animal Feed Probiotics Market Volume (Tons) by Source, 2013-2027
Table 71: MEA Animal Feed Probiotics Market Value (US$ Mn) by Animal, 2013-2027
Table 72: MEA Animal Feed Probiotics Market Volume (Tons) by Animal, 2013-2027
Table 73: MEA Animal Feed Probiotics Market Value (US$ Mn) by Form, 2013-2027
Table 74: MEA Animal Feed Probiotics Market Volume (Tons) by Form, 2013-2027
Table 75: MEA Animal Feed Probiotics Market Value (US$ Mn) by Sales Channel, 2013-2027
Table 76: MEA Animal Feed Probiotics Market Volume (Tons) by Sales Channel, 2013-2027
List of Figures:
Figure 01: Global Animal Feed Probiotics Market Analysis value (US$ Mn) & Volume (Tons), 2013-2018
Figure 02: Global Animal Feed Probiotics Market Analysis value (US$ Mn) & Volume (Tons), 2019-2027
Figure 03: Global Animal Feed Probiotics Market Share Analysis by Region 2013, 2019 & 2027
Figure 04: Global Animal Feed Probiotics Market Y-o-Y Growth Projections by Region , 2019-2027
Figure 05: Global Animal Feed Probiotics Market Attractiveness Index by Region , 2019–2027
Figure 06: Global Animal Feed Probiotics Market Share Analysis by Source, 2013, 2019 & 2027
Figure 07: Global Animal Feed Probiotics Market Y-o-Y Growth Projections by Source, 2019-2027
Figure 08: Global Animal Feed Probiotics Market Attractiveness Index by Source, 2019–2027
Figure 09: Global Bacteria Market Share Analysis by Source 2013, 2019 & 2027
Figure 10: Global Bacteria Market Y-o-Y Growth Projections by Source, 2019-2027
Figure 11: Global Non-Bacteria Market Share Analysis by Source 2013, 2019 & 2027
Figure 12: Global Non-Bacteria Market Y-o-Y Growth Projections by Source, 2019-2027
Figure 13: Global Animal Feed Probiotics Market Share Analysis by Animal 2013, 2019 & 2027
Figure 14: Global Animal Feed Probiotics Market Y-o-Y Growth Projections by Animal, 2019-2027
Figure 15: Global Animal Feed Probiotics Market Attractiveness Index by Animal, 2019–2027
Figure 16: Global Livestock Market Share Analysis by Animal 2013, 2019 & 2027
Figure 17: Global Livestock Market Y-o-Y Growth Projections by Animal, 2019-2027
Figure 18: Global Poultry Market Share Analysis by Animal 2013, 2019 & 2027
Figure 19: Global Poultry Market Y-o-Y Growth Projections by Animal, 2019-2027
Figure 20: Global Animal Feed Probiotics Market Share Analysis by Form 2013, 2019 & 2027
Figure 21: Global Animal Feed Probiotics Market Y-o-Y Growth Projections by Form, 2019-2027
Figure 22: Global Animal Feed Probiotics Market Attractiveness Index by Form, 2019–2027
Figure 23: Global Animal Feed Probiotics Market Share Analysis by Sales Channel 2013, 2019 & 2027
Figure 24: Global Animal Feed Probiotics Market Y-o-Y Growth Projections by Sales Channel, 2019-2027
Figure 25: Global Animal Feed Probiotics Market Attractiveness Index by Sales Channel, 2019–2027
Figure 26: Global Animal Feed Probiotics Market Analysis value (US$ Mn) & Volume (Tons), 2013-2018
Figure 27: Global Animal Feed Probiotics Market Analysis value (US$ Mn) & Volume (Tons), 2019-2027
Figure 28: North America Animal Feed Probiotics Market Share Analysis by Country 2013, 2019 & 2027
Figure 29: North America Animal Feed Probiotics Market Y-o-Y Growth Projections by Country , 2019-2027
Figure 30: North America Animal Feed Probiotics Market Attractiveness Index by Country , 2019–2027
Figure 31: North America Animal Feed Probiotics Market Share Analysis by Source, 2013, 2019 & 2027
Figure 32: North America Animal Feed Probiotics Market Y-o-Y Growth Projections by Source, 2019-2027
Figure 33: North America Animal Feed Probiotics Market Attractiveness Index by Source, 2019–2027
Figure 34: North America Bacteria Market Share Analysis by Source 2013, 2019 & 2027
Figure 35: North America Bacteria Market Y-o-Y Growth Projections by Source, 2019-2027
Figure 36: North America Non-Bacteria Market Share Analysis by Source 2013, 2019 & 2027
Figure 37: North America Non-Bacteria Market Y-o-Y Growth Projections by Source, 2019-2027
Figure 38: North America Animal Feed Probiotics Market Share Analysis by Animal 2013, 2019 & 2027
Figure 39: North America Animal Feed Probiotics Market Y-o-Y Growth Projections by Animal, 2019-2027
Figure 40: North America Animal Feed Probiotics Market Attractiveness Index by Animal, 2019–2027
Figure 41: North America Livestock Market Share Analysis by Animal 2013, 2019 & 2027
Figure 42: North America Livestock Market Y-o-Y Growth Projections by Animal, 2019-2027
Figure 43: North America Poultry Market Share Analysis by Animal 2013, 2019 & 2027
Figure 44: North America Poultry Market Y-o-Y Growth Projections by Animal, 2019-2027
Figure 45: North America Animal Feed Probiotics Market Share Analysis by Form 2013, 2019 & 2027
Figure 46: North America Animal Feed Probiotics Market Y-o-Y Growth Projections by Form, 2019-2027
Figure 47: North America Animal Feed Probiotics Market Attractiveness Index by Form, 2019–2027
Figure 48: North America Animal Feed Probiotics Market Share Analysis by Sales Channel 2013, 2019 & 2027
Figure 49: North America Animal Feed Probiotics Market Y-o-Y Growth Projections by Sales Channel, 2019-2027
Figure 50: North America Animal Feed Probiotics Market Attractiveness Index by Sales Channel, 2019–2027
Figure 51: Latin America Animal Feed Probiotics Market Analysis value (US$ Mn) & Volume (Tons), 2013-2018
Figure 52: Latin America Animal Feed Probiotics Market Analysis value (US$ Mn) & Volume (Tons), 2019-2027
Figure 53: Latin America Animal Feed Probiotics Market Share Analysis by Region 2013, 2019 & 2027
Figure 54: Latin America Animal Feed Probiotics Market Y-o-Y Growth Projections by Region , 2019-2027
Figure 55: Latin America Animal Feed Probiotics Market Attractiveness Index by Region , 2019–2027
Figure 56: Latin America Animal Feed Probiotics Market Share Analysis by Source, 2013, 2019 & 2027
Figure 57: Latin America Animal Feed Probiotics Market Y-o-Y Growth Projections by Source, 2019-2027
Figure 58: Latin America Animal Feed Probiotics Market Attractiveness Index by Source, 2019–2027
Figure 59: Latin America Bacteria Market Share Analysis by Source 2013, 2019 & 2027
Figure 60: Latin America Bacteria Market Y-o-Y Growth Projections by Source, 2019-2027
Figure 81: Europe Animal Feed Probiotics Market Share Analysis by Source, 2013, 2019 & 2027
Figure 82: Europe Animal Feed Probiotics Market Y-o-Y Growth Projections by Source, 2019-2027
Figure 83: Europe Animal Feed Probiotics Market Attractiveness Index by Source, 2019–2027
Figure 84: Europe Bacteria Market Share Analysis by Source 2013, 2019 & 2027
Figure 85: Europe Bacteria Market Y-o-Y Growth Projections by Source, 2019-2027
Figure 86: Europe Non-Bacteria Market Share Analysis by Source 2013, 2019 & 2027
Figure 87: Europe Non-Bacteria Market Y-o-Y Growth Projections by Source, 2019-2027
Figure 88: Europe Animal Feed Probiotics Market Share Analysis by Animal 2013, 2019 & 2027
Figure 89: Europe Animal Feed Probiotics Market Y-o-Y Growth Projections by Animal, 2019-2027
Figure 90: Europe Animal Feed Probiotics Market Attractiveness Index by Animal, 2019–2027
Figure 91: Europe Livestock Market Share Analysis by Animal 2013, 2019 & 2027
Figure 92: Europe Livestock Market Y-o-Y Growth Projections by Animal, 2019-2027
Figure 93: Europe Poultry Market Share Analysis by Animal 2013, 2019 & 2027
Figure 94: Europe Poultry Market Y-o-Y Growth Projections by Animal, 2019-2027
Figure 95: Europe Animal Feed Probiotics Market Share Analysis by Form 2013, 2019 & 2027
Figure 96: Europe Animal Feed Probiotics Market Y-o-Y Growth Projections by Form, 2019-2027
Figure 97: Europe Animal Feed Probiotics Market Attractiveness Index by Form, 2019–2027
Figure 98: Europe Animal Feed Probiotics Market Share Analysis by Sales Channel 2013, 2019 & 2027
Figure 99: Europe Animal Feed Probiotics Market Y-o-Y Growth Projections by Sales Channel, 2019-2027
Figure 100: Europe Animal Feed Probiotics Market Attractiveness Index by Sales Channel, 2019–2027
Figure 101: CIS & Russia Animal Feed Probiotics Market Analysis by value(US$ Mn) & Volume (Tons), 2013 - 2018
Figure 102: CIS & Russia Animal Feed Probiotics Market Analysis by value(US$ Mn) & Volume (Tons), 2019 - 2027
Figure 103: CIS & Russia Animal Feed Probiotics Market Share Analysis by Source, 2013, 2019 & 2027
Figure 104: CIS & Russia Animal Feed Probiotics Market Y-o-Y Growth Projections by Source, 2019-2027
Figure 105: CIS & Russia Animal Feed Probiotics Market Attractiveness Index by Source, 2019–2027
Figure 106: CIS & Russia Bacteria Market Share Analysis by Source 2013, 2019 & 2027
Figure 107: CIS & Russia Bacteria Market Y-o-Y Growth Projections by Source, 2019-2027
Figure 108: CIS & Russia Non-Bacteria Market Share Analysis by Source 2013, 2019 & 2027
Figure 109: CIS & Russia Non-Bacteria Market Y-o-Y Growth Projections by Source, 2019-2027
Figure 110: CIS & Russia Animal Feed Probiotics Market Share Analysis by Animal 2013, 2019 & 2027
Figure 111: CIS & Russia Animal Feed Probiotics Market Y-o-Y Growth Projections by Animal, 2019-2027
Figure 112: CIS & Russia Animal Feed Probiotics Market Attractiveness Index by Animal, 2019–2027
Figure 113: CIS & Russia Livestock Market Share Analysis by Animal 2013, 2019 & 2027
Figure 114: CIS & Russia Livestock Market Y-o-Y Growth Projections by Animal, 2019-2027
Figure 115: CIS & Russia Poultry Market Share Analysis by Animal 2013, 2019 & 2027
Figure 116: CIS & Russia Poultry Market Y-o-Y Growth Projections by Animal, 2019-2027
Figure 117: CIS & Russia Animal Feed Probiotics Market Share Analysis by Form 2013, 2019 & 2027
Figure 118: CIS & Russia Animal Feed Probiotics Market Y-o-Y Growth Projections by Form, 2019-2027
Figure 119: CIS & Russia Animal Feed Probiotics Market Attractiveness Index by Form, 2019–2027
Figure 120: CIS & Russia Animal Feed Probiotics Market Share Analysis by Sales Channel 2013, 2019 & 2027
Figure 121: CIS & Russia Animal Feed Probiotics Market Y-o-Y Growth Projections by Sales Channel, 2019-2027
Figure 122: CIS & Russia Animal Feed Probiotics Market Attractiveness Index by Sales Channel, 2019–2027
Figure 123: Japan Animal Feed Probiotics Market Analysis by value(US$ Mn) & Volume (Tons), 2013 - 2018
Figure 124: Japan Animal Feed Probiotics Market Analysis by value(US$ Mn) & Volume (Tons), 2019 - 2027
Figure 125: Japan Animal Feed Probiotics Market Share Analysis by Source, 2013, 2019 & 2027
Figure 126: Japan Animal Feed Probiotics Market Y-o-Y Growth Projections by Source, 2019-2027
Figure 127: Japan Animal Feed Probiotics Market Attractiveness Index by Source, 2019–2027
Figure 128: Japan Bacteria Market Share Analysis by Source 2013, 2019 & 2027
Figure 129: Japan Bacteria Market Y-o-Y Growth Projections by Source, 2019-2027
Figure 130: Japan Non-Bacteria Market Share Analysis by Source 2013, 2019 & 2027
Figure 131: Japan Non-Bacteria Market Y-o-Y Growth Projections by Source, 2019-2027
Figure 132: Japan Animal Feed Probiotics Market Share Analysis by Animal 2013, 2019 & 2027
Figure 133: Japan Animal Feed Probiotics Market Y-o-Y Growth Projections by Animal, 2019-2027
Figure 134: Japan Animal Feed Probiotics Market Attractiveness Index by Animal, 2019–2027
Figure 135: Japan Livestock Market Share Analysis by Animal 2013, 2019 & 2027
Figure 136: Japan Livestock Market Y-o-Y Growth Projections by Animal, 2019-2027
Figure 137: Japan Poultry Market Share Analysis by Animal 2013, 2019 & 2027
Figure 138: Japan Poultry Market Y-o-Y Growth Projections by Animal, 2019-2027
Figure 139: Japan Animal Feed Probiotics Market Share Analysis by Form 2013, 2019 & 2027
Figure 140: Japan Animal Feed Probiotics Market Y-o-Y Growth Projections by Form, 2019-2027
Figure 141: Japan Animal Feed Probiotics Market Attractiveness Index by Form, 2019–2027
Figure 142: Japan Animal Feed Probiotics Market Share Analysis by Sales Channel 2013, 2019 & 2027
Figure 143: Japan Animal Feed Probiotics Market Y-o-Y Growth Projections by Sales Channel, 2019-2027
Figure 144: Japan Animal Feed Probiotics Market Attractiveness Index by Sales Channel, 2019–2027
Figure 145: APEJ Animal Feed Probiotics Market Analysis by value(US$ Mn) & Volume (Tons), 2013 - 2018
Figure 146: APEJ Animal Feed Probiotics Market Analysis by value(US$ Mn) & Volume (Tons), 2019 - 2027
Figure 147: APEJ Animal Feed Probiotics Market Share Analysis by Region 2013, 2019 & 2027
Figure 148: APEJ Animal Feed Probiotics Market Y-o-Y Growth Projections by Region , 2019-2027
Figure 149: APEJ Animal Feed Probiotics Market Attractiveness Index by Region , 2019–2027
Figure 150: APEJ Animal Feed Probiotics Market Share Analysis by Source, 2013, 2019 & 2027
Figure 151: APEJ Animal Feed Probiotics Market Y-o-Y Growth Projections by Source, 2019-2027
Figure 152: APEJ Animal Feed Probiotics Market Attractiveness Index by Source, 2019–2027
Figure 153: APEJ Bacteria Market Share Analysis by Source 2013, 2019 & 2027
Figure 154: APEJ Bacteria Market Y-o-Y Growth Projections by Source, 2019-2027
Figure 155: APEJ Non-Bacteria Market Share Analysis by Source 2013, 2019 & 2027
Figure 156: APEJ Non-Bacteria Market Y-o-Y Growth Projections by Source, 2019-2027
Figure 157: APEJ Animal Feed Probiotics Market Share Analysis by Animal 2013, 2019 & 2027
Figure 158: APEJ Animal Feed Probiotics Market Y-o-Y Growth Projections by Animal, 2019-2027
Figure 159: APEJ Animal Feed Probiotics Market Attractiveness Index by Animal, 2019–2027
Figure 160: APEJ Livestock Market Share Analysis by Animal 2013, 2019 & 2027
Figure 161: APEJ Livestock Market Y-o-Y Growth Projections by Animal, 2019-2027
Figure 162: APEJ Poultry Market Share Analysis by Animal 2013, 2019 & 2027
Figure 163: APEJ Poultry Market Y-o-Y Growth Projections by Animal, 2019-2027
Figure 164: APEJ Animal Feed Probiotics Market Share Analysis by Form 2013, 2019 & 2027
Figure 165: APEJ Animal Feed Probiotics Market Y-o-Y Growth Projections by Form, 2019-2027
Figure 166: APEJ Animal Feed Probiotics Market Attractiveness Index by Form, 2019–2027
Figure 167: APEJ Animal Feed Probiotics Market Share Analysis by Sales Channel 2013, 2019 & 2027
Figure 168: APEJ Animal Feed Probiotics Market Y-o-Y Growth Projections by Sales Channel, 2019-2027
Figure 169: APEJ Animal Feed Probiotics Market Attractiveness Index by Sales Channel, 2019–2027
Figure 170: MEA Animal Feed Probiotics Market Analysis by value(US$ Mn) & Volume (Tons), 2013 - 2018
Figure 171: MEA Animal Feed Probiotics Market Analysis by value(US$ Mn) & Volume (Tons), 2019 - 2027
Figure 172: MEA Animal Feed Probiotics Market Share Analysis by Country 2013, 2019 & 2027
Figure 173: MEA Animal Feed Probiotics Market Y-o-Y Growth Projections by Country , 2019-2027
Figure 174: MEA Animal Feed Probiotics Market Attractiveness Index by Country, 2019–2027
Figure 175: MEA Animal Feed Probiotics Market Share Analysis by Source, 2013, 2019 & 2027
Figure 176: MEA Animal Feed Probiotics Market Y-o-Y Growth Projections by Source, 2019-2027
Figure 177: MEA Animal Feed Probiotics Market Attractiveness Index by Source, 2019–2027
Figure 178: MEA Bacteria Market Share Analysis by Source 2013, 2019 & 2027
Figure 179: MEA Bacteria Market Y-o-Y Growth Projections by Source, 2019-2027
Figure 180: MEA Non-Bacteria Market Share Analysis by Source 2013, 2019 & 2027
Figure 181: MEA Non-Bacteria Market Y-o-Y Growth Projections by Source, 2019-2027
Figure 182: MEA Animal Feed Probiotics Market Share Analysis by Animal 2013, 2019 & 2027
Figure 183: MEA Animal Feed Probiotics Market Y-o-Y Growth Projections by Animal, 2019-2027
Figure 184: MEA Animal Feed Probiotics Market Attractiveness Index by Animal, 2019–2027
Figure 185: MEA Livestock Market Share Analysis by Animal 2013, 2019 & 2027
Figure 186: MEA Livestock Market Y-o-Y Growth Projections by Animal, 2019-2027
Figure 187: MEA Poultry Market Share Analysis by Animal 2013, 2019 & 2027
Figure 188: MEA Poultry Market Y-o-Y Growth Projections by Animal, 2019-2027
Figure 189: MEA Animal Feed Probiotics Market Share Analysis by Form 2013, 2019 & 2027
Figure 190: MEA Animal Feed Probiotics Market Y-o-Y Growth Projections by Form, 2019-2027
Figure 191: MEA Animal Feed Probiotics Market Attractiveness Index by Form, 2019–2027
Figure 192: MEA Animal Feed Probiotics Market Share Analysis by Sales Channel 2013, 2019 & 2027
Figure 193: MEA Animal Feed Probiotics Market Y-o-Y Growth Projections by Sales Channel, 2019-2027
Figure 194: MEA Animal Feed Probiotics Market Attractiveness Index by Sales Channel, 2019–2027
Copyright © Transparency Market Research, Inc. All Rights reserved
Trust Online


Animal Feed Probiotics Market